A Look at Horizontal Well Production in Virginia
Horizontal gas wells in Virginia in 2008 to 2009. Note that they are all clustered in the extreme western portion of the Commonwealth.
According to the Virginia Department of Mines, Minerals, and Energy’s (DMME) Division of Gas and Oil, there are 30 horizontal gas wells that produced gas between January 2008 and December 2009 (1). While this is not a large number of horizontal wells, the dataset is interesting, since Virginia publishes monthly production data online.
Of the 30 wells, only nine were in production for at least 12 of the 24 months that I looked at. This is, admittedly, a small sample size, but is as good an entry point as any into the discussion of how gas production changes over time.

Chart 1: Production in Thousands of Cubic Feet (Mcf) of Horizontal Gas Wells in Virginia, with at least 12 months of production between 2008 to 2009.
Many of the wells in this analysis have a spike in production within the first few months of production, followed by a gradual decline.
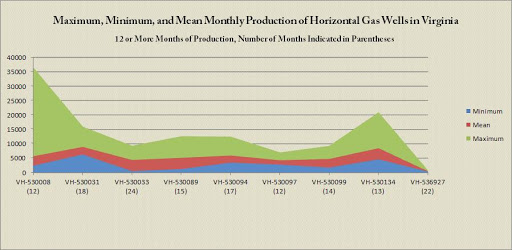
Chart 2: Maximum, Minimum, and Mean Production of Horizontal Gas Wells in Virginia, with at least 12 months of production between 2008 to 2009.
For wells with at least 12 months of production, the mean production value tends to be closer to the minimum value than the maximum. This is particularly true for those wells which show a significant spike in production, such as VH-520008.
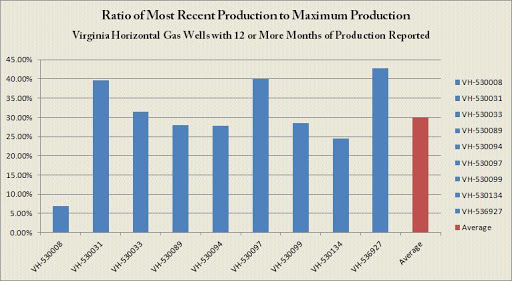
Chart 3: Ratio of Most Recent Monthly Production to Peak Monthly Production of Horizontal Gas Wells in Virginia, with at least 12 months of production between 2008 to 2009.
Ratio of December 2009 production to each well’s maximum monthly production for all horizontal gas wells. Please click the gray compass rose and double carat (^) to hide those menus. Click the “i” tool then any map feature for more information.
For these nine horizontal gas wells in Virginia, the average production of the most recent month (December 2009) is slightly less than 30 percent of the peak monthly production. This figure is skewed on the one side by a well with a tremendous production spike (VH-530008, 6.93%) and on the other by a well with low but relatively steady production (VH-536927, 42.75%). When all wells are considered (as with the map) the range of values is much greater.
Each of these wells had been in production between 12 and 24 months as of December 2009, and none of them produced even half as much gas in that month as the month for their respective maximum production values. The complete production data is available on FracTracker’s DataTool.
- The most recent production data currently available is for January 2010, one month after the end of this analysis.