Six Months of Production and Waste From PA’s Unconventional Wells
The Pennsylvania Department of Environmental Protection (DEP) recently published its biannual reports for production and waste from unconventional wells throughout the state for the last half of 2012. FracTracker has learned the hard way not to be too eager in analyzing this data. In the previous cycle, this data was released without the contribution several operators, one of which happened to be the biggest player in the state, Chesapeake Appalachia. That incident prompted the inclusion of a data disclaimer from DEP, which includes the following text:
The Oil and Gas Act reporting is a self-reporting system, meaning that data is reported from producers to DEP as required by law. All production data is posted as it was received from the unconventional well operators. DEP does not independently verify the data before it is posted.
While the Oil and Gas Act requires accurate and on-time data reporting by producers, and the producers and DEP endeavor to correct any errors discovered after the data is posted, DEP makes no claims, promises or guarantees regarding the accuracy, completeness or timeliness of the operators’ data that DEP is required to post.
While considering content regarding production and waste in Pennsylvania, it is worth noting that the DEP considers the data to belong to the various operators. All data for this post was downloaded on February 25, 2013, and while it seems reasonably complete, it is important to note that there could be operators which have not posted their data to DEP in a timely fashion.
PA Production and Waste From Unconventional Wells: July 2012 to December 2012. Click on any map icon for more information, or click the “Fullscreen” button at the top right of the map to access more toolbars. To access data for individual wells, viewers must zoom in to 1:750,000, or an area equivalent to several counties.
The default map frame includes most of the activity for unconventional oil and gas production and waste from Pennsylvania, but if you zoom out, you can find a landfill in southwestern Idaho that accepted 11 tons of flowback fracturing sand for disposal. Unfortunately, the available data does not give any indication of why an operator might choose to ship waste over 2,000 miles away from its source.
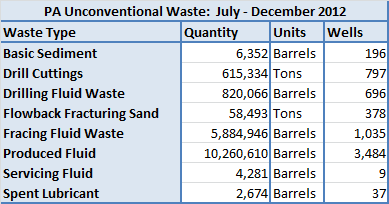
Below are the six month statewide production and waste totals for Pennsylvania’s unconventional wells, including the number of wells that contributed to each total:
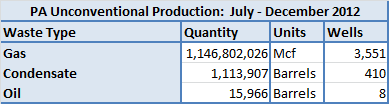
Production from unconventional wells in Pennsylvania from July to December 2012. Mcf represents 1,000 cubic feet, and barrels measure 42 US gallons.
The total gas produced was over 1.1 trillion cubic feet (Tcf) for the six month period, which was over 250 billion cubic feet (Bcf) higher than the previous total of 895 Bcf.
Waste produced by unconventional wells in Pennsylvania from June to December 2012.
And here is a look at the disposal method for each type of waste, in terms of percentage:
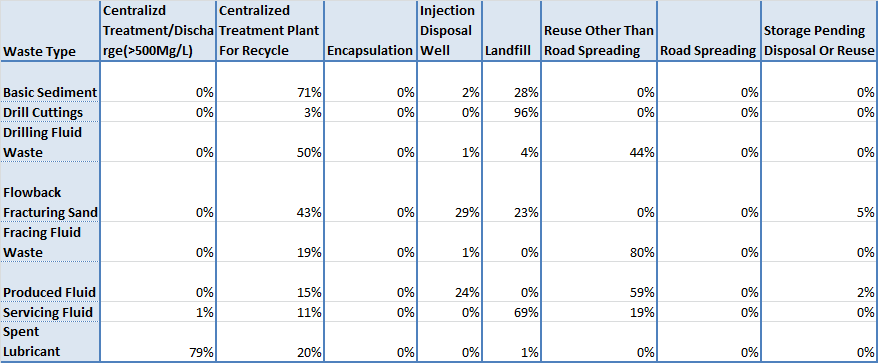
Disposal methods of Pennsylvania unconventional oil and gas waste products, in terms of percentage of the waste type. July – December 2012.
Note that while road spreading rounds down to 0%, 425 barrels of produced fluid were used in this effort.
Dear Matt and Barbara:
Matt thanks for calculating the produced fluid which is 2.34 million gallons a day.
but you also need to add the frack fluid wastes which is about half as many barrels that would make it about 1 million gallons /day and then there there is the drilling fluid waste which is a little less than a million for a total of
4 million gallons a day .
To get a better picture of what that represents: ask any farmer and he will tell you a milktruck hauls about 6,000 gallons so divide that into 4 million gallons and you get 666 trucks loads of waste every day !!!!! or if you imagine a train with 100 or so railroad cars in tow , it would be 6 train loads every single day!
The lateral drill pipe underground follows and is embedded in shale rock which contains radium.for about a mile as compared to a vertical well which just passes thru the shale of about 100 feet max. Radium dissolves in water somewhat and will be in the waste fluid and more so than is “natural” as in “Natural Occurring Radioactive materials ” NORM
The radium is technically enhanced by cutting up the rock into drill cuttings which contain a lot more surface area and therefore is a lot more soluable . It also will be contained in the waste liquid because of the technically enhanced fracs that are kept open with further technical methods of fine sand to prop it open. The entire process is certainly enhancing the radium in water which can be especially dangerous if it comes into the drinking water The waste contains not NORM but TENORM – stands for technically enhanced. TENORM requires a special landfill and cannot be deposited in a ordinary household landfill as they are doing right now with the drill cuttings. Radium dissolved in water is one of the most carcinogenic active radionuclides: Outside the body- it is harmless– inside the body- carcinogenic!.
There has not been a scientific analysis made at all about where these 666 trucks of liquid waste will go daily!! Everybody should complain about this to all officials on all levels– you will affect the health of the entire area if the radium ends up in the drinking water as it is absorbed inside the body in bone tissue and will keep on radiating for the rest of the persons life and cause a lot of different cancers. It will take ten years to diagnose this but you need to object to this cavalier treatment of the liquid wastes in these huge quantities – NOW.
Thank you , I am a nurse, I worked at Roswell park, we can prevent cancer now — here is the opportunity- call your local politician and tell them what you learned today.
Our organization, The American Association of University Women (AAUW-PA), is completing an updated report on Marcellus Shale (in PA) and we are having trouble finding the 2012 wastewater/flowback amount produced in terms of MGD (Millions of gallons per day). We have the amounts for 2009, 2010 & 2011 in MGD. Is there a total available for 2012 in MGD instead of barrels?
Many thanks,
Barbara Rooney, Chair, AAUW-PA Marcellus Shale Committee
Hi Barbara,
The waste here is reported in 42 gallon barrels, and this data represents half a year (184 days) of unconventional waste. So to convert the waste from barrels to MGD, you’d have to multiply by the following fraction: (42) / (1,000,000 * 184), which equals 0.00000023.
So for example, there were 10,260,610 barrels of produced fluid from unconventional wells in PA during the last half of the year, which works out to 2.34 million gallons per day.