Science, Democracy, and Community Decisions on Fracking forum

By Kyle Ferrar, CA Program Coordinator, FracTracker Alliance

The “Science, Democracy, and Community Decisions on Fracking” forum hosted by The Union of Concerned Scientists focused on the full spectrum of the broad range of issues accompanying unconventional resource extraction and hydraulic fracturing.  The meeting included a full day of roundtable discussions focused on three topics, with participants handpicked and assigned to one of three groups.  Roundtable discussions with invited participants convened July 24th, with a public forum held the following day.  Participants included leading thinkers and experts from academia, industry, nonprofit organizations, and government.  The working groups focused on one of three topics:

  1. The current state of science and technical knowledge
  2. Public policy and the regulatory framework for managing development
  3. Public Access to data and resources.

The FracTracker Alliance participated in the public access discussions.  The chair(s) of each of the three committees presented their findings during the public forum on July 25th, followed by “dynamic public discussion.”

The public forum began with opening remarks from Kathleen Rest, Executive Director of UCS, and Edward A. Parson, Professor of law and Co-Director of the Emmet Center on Climate Change and the Environment at the UCLA Law School, and a warm greeting from U.S. Congressman Henry A Waxman, via telecast as Congress is currently in session. Opening remarks by Adrienne Alvord (UCS) introduced the three committees and their respective charges. A short video, filmed and produced by UCS, presenting the need for public awareness on the issue of hydraulic fracturing and unconventional resource development was then exhibited.  The video can be found on the UCS website.

The committee discussing the current state of science and knowledge gaps was chaired by Kevin Hurst, former Assistant Director of energy R&D for the White House Office of Science and Technology Policy.  In his presentation Kevin acknowledged the various risks of media contamination, including groundwater, soil, surface water, and air, that have occurred during both conventional and unconventional oil and gas extraction, but felt that his committee had reached an overall consensus within his group that when best practices are employed responsibly, these risks can be managed effectively.  Specifically, the risks to groundwater and green-house gas emissions are relatively similar to the risks associated with conventional resource development (vertically drilled oil and natural gas wells that are not “frac’ed”).  The risk management issues result from the scale of development.  Proper management will necessarily require comprehensive monitoring plans, including all media as well as wildlife and public health, necessarily from industry but also from the public sector and citizens.  Monitoring will need to be consistent, transparent, and widespread.  For each particular failure that has been realized, there will need to be a collaboration between industry and regulatory bodies (state and federal) to drive down risk.  For data collection on a comprehensive scale there will also need to be collaboration between public and private institutions for a coalition that supports public engagement.

Kate Konschnik, Policy Director of the Environmental Law and Policy program at the Harvard Law School and former chief environmental counsel to U.S. senator Sheldon Whitehouse, presented on behalf of the policy working group.  Kate began by addressing what is working and what is not working in terms of the goals of the many interest groups focused on hydraulic fracturing issues.  Among other interests they include moratoriums and a complete ban.  In the case of local rural interests groundwater protection has been a main focus, whereas in urban communities it is typically a concern for air quality.  On a global scale green-house gas emissions are the focus.  On all levels these are progressive issues due to the difference of scale as compared to previous oil and gas activity in most parts of the United States.  To manage this scale of development there are both regulatory and non-regulatory tools.  Regulatory tools include roles for the federal, state, tribal, and local governments such as the role the EPA has in supporting green completions of well-heads, although they could be required as addressed in the clean air act.  Non-regulatory bodies possess other tools such as shareholder interests and actions and third party certifications such as LEED certifications.  In regards to regulatory action, there seems to be a lack of will to apply existing rules on the books, whereas there is also the capacity for new rules that need to be created in such a way that authority is shared without duplicating efforts and with clear response plans.  Having government regulatory agencies lead the charge in data collection is important to inspire innovation to reduce risks, develop performance standards from the ground level and will address the trust issue for accountability and continued improvement of technologies.  Information that needs to be collected includes baseline data and ongoing monitoring in a consistent format across multiple states, as well as chemical disclosures.

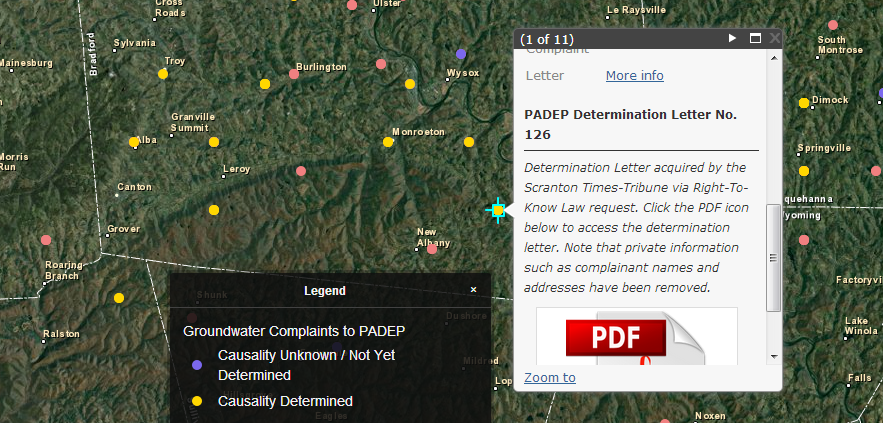
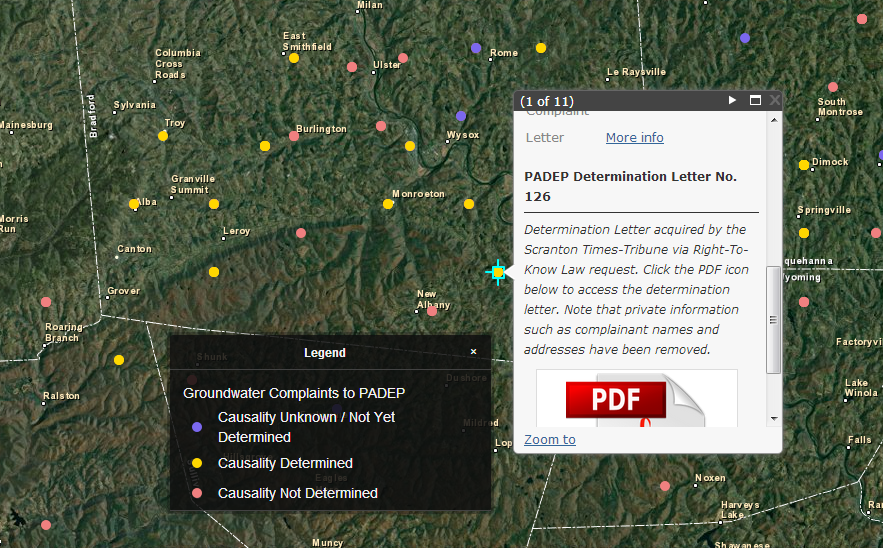
The third working group, focused on issues of public access to information, was chaired by Tom Wilbur, author of Under the Surface: Fracking, Fortunes, and the Fate of the Marcellus Shale and Shale Gas Review blog.  Tom’s presentation centered on the question, “What can be done to help citizens seek, find, and digest information, while recognizing misinformation, so as to inform decision-making?”  Answers should improve access to information that will in turn inform decision-making.  The main findings were framed in terms of the best outcome for most people, such that public health and environmental health issues trump issues of trade secrets and non-disclosures.  The first finding was that the sources of information need to be trusted, and community generated information is the most trusted.  This includes the involvement of regulatory agencies, such as closing the loopholes in the Resource Conservation and Recovery Act of 1976 (hazardous wastes) and the Clean Water Act.  Disclosure of all chemicals is therefore also necessary.  The full process of data dissemination must also be considered, from translation of data to information, to synthesis of results and conclusions, and then explanations of the implications.  Validation of all information by trusted sources is critical.

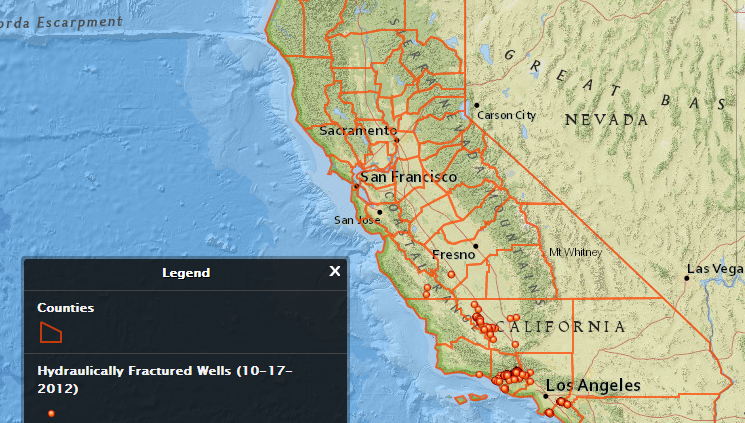
Additional presenters who had not participated in the roundtable discussions provided insight into the various themes, to tie the discussions together.  Amy Jaffy Myers, Executive Director for energy and sustainability at the University of California-Davis, discussed global energy security economic, and geopolitics of frac’ing.  Amy explained why the issue of energy independence is so important to the future of the United States.  Everyone wants the freedom of mobility to drive cars on liquid fuel and warmth to heat their homes.  In turn, the public’s demand for responsible policies should be responded with a commitment from the private sector.    Felicia Marcus, Chair of the California State Water Resources Control Board provided the context for why the issue is so important in the State of California, and summarized the current set of draft rules and regulations that are currently being considered by the state legislature.  They include provisions for monitoring, transparency, and bonding.  Jose Bravo, executive director of the Just Transition Alliance, gave a moving talk about the environmental justice issues that have accompanied oil and natural gas development in California communities.  Todd Platts, former U.S. Representative, gave a lecture on the need for information for community-empowerment as well as the need for transparency in a functioning democracy, and Andrew Rosenberg, Director of the Center for Science and Democracy and The Union of Concerned Scientist provided closing remarks, which summed up the entire conference with the words “Informed decisions need to be made on the merits.”

FracTracker Expands Westward

By Brook Lenker, Executive Director, FracTracker Alliance

The FracTracker Alliance is coming to California. The generous support of the Palo Alto-based 11th Hour Project, a working program of the Schmidt Family Foundation, has enabled us to hire Kyle Ferrar, MPH to be our first program coordinator in the state. Kyle – an accomplished researcher who has studied the fate and effect of contaminants transported through environmental media and has extensive experience in GIS, policy analysis, and risk communication – will have his hands full. While California has a legacy of oil and gas development, the advent and scale of modern extraction technologies poses risks to the complexion of the landscape, the integrity of natural resources, the safety of agricultural commodities, the health of people and animals – wild and domestic – and the fabric of local communities. With two-thirds of the United States’ total estimated shale oil reserves in California’s Monterey Shale (a formation covering 1,750 square miles), the state could soon be overwhelmed by the demand for these energy riches.

In his new role with FracTracker, Kyle will collect and analyze data, develop maps and articles, train and coordinate volunteers, present and display at events and symposia, and network with a variety of organizations, agencies, and the news media – all toward improving the effectiveness and reach of our work. Our California operations will be based at the HUB in Berkeley. The HUB is an innovative shared workspace with maximum opportunity to connect to other people, organizations, and ideas. And if that work environment wasn’t inspiring enough, the HUB in Berkeley is located at the David Brower Center, a very green (LEED Platinum!) building and home to numerous conservation organizations.

Adding additional wisdom to our Pacific coast presence, FracTracker welcomes Brian Segee as the newest member of our board of directors. Brian is a Staff Attorney at the Environmental Defense Center in Santa Barbara, a group with a legacy of addressing oil issues and other topics of importance to FracTracker.

To Kyle, Brian, and the 11th Hour project, a great big thanks for your commitment to us and what we do. Together may we cast a helpful light in the golden state!

North Dakota Bakken Gas Flares

Gas Flaring and Venting: Data Availability and New Methods for Oversight

By Samir Lakhani, GIS Intern, FracTracker Alliance

In the hazy world of gas flaring and venting, finding worthwhile data often leads one to a dead end. Although the Energy Information Administration (EIA) holds the authority to require active oil/gas companies to disclose this data, they choose not to. EIA will not proceed with such actions because, “…assessing the volume of natural gas vented and flared would add significant reporting burdens to natural gas producers causing them substantial investments.” Additionally, the EIA is not confident that oil/gas producing companies have the capability to accurately estimate their own emissions from venting or flaring activities.

Piece-Meal

Some states do voluntarily submit their estimates, but only 8 of the nation’s 32 oil and gas producing states submit their data. This makes attempts for national estimates incomplete and inaccurate. State officials have repeatedly complained that the EIA has provided them with insufficient guidelines as to how the data should be submitted, and in what format. It appears the only way that concerned parties are able to monitor this practice is with satellite imagery from the sky, to literally watch flaring as it occurs.

Bird’s Eye View

The Bakken Shale Formation has received a considerable amount of attention. We’ve all seen the nighttime satellite images of North Dakota, where a normally quiet portion of the state light up like a bustling city. It is to be understood that not all the lights in this region are gas flares. Much of it is emergency lighting and temporary housing associated with drilling companies.

There are a few obvious issues with satellite surveillance. Firstly, it is difficult to monitor venting emissions from a bird’s eye perspective. Venting is the process by which unsought gas is purposely wafted from drill sites into the atmosphere. Venting is a much more environmentally costly decision compared to the ignited alternative, as pure natural gas is twenty times more potent than CO2 as a greenhouse gas. To monitor venting behavior, from up high, Infrared sensors must be used. Unfortunately, these emissions do not transmit well through the atmosphere. Proper detection must be made much closer to earth’s surface, perhaps from an airplane or on the ground. Secondly, flaring is almost impossible to detect during the day using satellites. One could equate it to attempting to see a flashlight’s beam when the sun is out. Lastly, when the time comes to churn out an estimate on how much gas is really being wasted—the statistics vary wildly.

Using SkyTruth’s satellite image, and GIS data retrieved from North Dakota’s Department of Mineral Resources, it is now possible to pinpoint North Dakota’s most active gas flaring sites. Using this, more accurate estimates are now within reach. North Dakota gas drillers may flare their “associated” gas for up to one year. However, Officials at Mineral Management Service claim that it is not difficult to get an extension, due to economic hardship. There are always instances of gas/oil operators flaring or venting without authorization. In 2003, Shell paid a 49 million dollar settlement over an unnoticed gas flaring and venting operation that lasted several years. The beauty of satellite imagery and GIS detail is the observer’s ability to pinpoint flaring operations and by referencing the leases, evaluate whether or not such practices were authorized.

This map shows flaring activity in the Bakken Formation from January 1 through June 30, 2013. Please click the “Fullscreen” icon in the upper right hand corner to access the full set of map controls.

Regulation and Control

If flaring and venting are costly to the environment and result in a loss of company product (methane), you may ask why these practices are still conducted. Flaring and venting practices are cheaper than building the infrastructure necessary to harness this energy, unfortunately. To effectively collect this resource, a serious piping network is needed. It is as if a solar farm has been built in the desert, but there is no grid to take this power to homes. To lay down piping is an expensive endeavor, and it requires continuous repairs and on-site monitors. Even when North Dakota burns over 30% of their usable product, there is little initiative to invest in long term savings. A second method, called “green completions”, is becoming a more popular choice for oil and gas companies. A green completion is a portable refinery and condensate tank aimed to recover more than half of excess methane produced from drilling. Green completions are the best management practice of today, and the EPA wishes to implement green completion technology nationwide by 2015.

The best way to estimate gas flare and venting emissions is through submissions from gas/oil companies and to analyze the data using GIS applications. Concerned organizations and citizens should not have to rely on satellite services to watch over the towering infernos. There is new research coming out each day on adverse health effects from living in close proximity to a gas flare and vent. It releases a corrosive mixture of chemicals, and returns to the earth as acid rain. Please refer to this publication for a thorough assessment of possible health effects.

This issue is not limited to US borders only; flaring has wreaked havoc in South America, Russia, Africa, and the Middle-East. During the extraction of oil, gas may return to the surface. In many of these areas where oil drilling is prevalent, there are no well-developed gas markets and pipeline infrastructure, which makes venting and flaring a more attractive way to dispose of an unintentionally extracted resource. If the US were to make substantial changes to the way we monitor, regulate, and reduce gas flaring/venting, and accessibility to data, we would set the standard on an international level. Such policy changes include: carbon taxation, streamlining the leasing process (Many oil/gas officials despise the leasing applications for pipelines), installing flaring/venting meters and controls, and tax incentives (to flare and green complete, rather than vent).

All of these changes would tremendously reduce and regulate gas flaring in the US, but without accurate and comprehensive data these proposed policies are meaningless. Data is, and forever will be, the diving board on which policy and change is founded.


Special thanks to Paul Woods and Yolandita Franklin of Skytruth, for using VIIRS and IR technologies to compile the data for the above map.

Registered Water Withdrawals in New York State

By Karen Edelstein, NY Program Coordinator, FracTracker Alliance

As of April 1, 2013, new regulations 6 NYCRR Parts 601 and 621 in New York State have been in effect that require users of large quantities of water to apply for withdrawal permits. The largest users of water—those with withdrawals of more than 100 million gallons per day—are the first group required to apply. The permit system then adds users on a yearly basis, targeting systems with decreasingly need. In 2014, the target group is users of 10-100 million gallons/day; in 2015, it is 2-10 million gallons/day, and so on. The full schedule is in Table 1, below. There are no fees associated with this permitting process.

In order to assess the geographic impacts of these varying uses, attorney Rachel Treichler submitted a Freedom of Information Law (FOIL) request to the New York State Department of Environmental Conservation. FracTracker Alliance assisted her in this effort by visualizing the data. Treichler believes that the new regulations make it virtually impossible for DEC to balance competing needs between large and small users.

In this interactive map, larger dots signify larger withdrawal. Click on each dot in the map to get more information.

Yellow: 0.0001-0.5 million gal/day
Light green: 0.5001-2 million gal/day
Dark green: 2.001-10 million gal/day
Medium blue: 10.001-100 million gal/day
Dark blue: >100 million gal/day

Until the adoption of these permitting requirements, water withdrawals in New York were governed by riparian rights determined by case law. Riparian rights are correlative–they fluctuate depending on the needs of other users and the amount of water available. Although the new regulations affirm that riparian rights will not be affected by the granting of permits, there is concern that users granted permits for stated amounts of water usage may be reluctant to adjust to the needs of other users in times of water scarcity. In New York State, both the Susquehanna River Basin Commission (SRBC) and the Delaware River Basin Commission (DRBC) have strong regulatory authority over withdrawals, and the new New York regulations provide that withdrawals subject to permitting by these commissions are exempt from the permitting requirements of the regulations. Comparable commissions with authority to regulate water withdrawals do not exist in the Great Lakes watershed, which includes the Finger Lakes Region, or in the other watersheds in the state, and in these watersheds, the permitting requirements of the regulations are the only generally-applicable water permitting requirements.

Currently, New York State has an abundance of water—there is certainly enough to go around to meet domestic and commercial uses. However, with climate change, continued population growth, and the potential for an uptick in hydrofracking throughout the Marcellus and Utica Shale region, the possibility for New York State being asked to sell or export our water increases considerably.

Under the current system, even by 2017, withdrawal permits will not be required for daily use under 100,000 gallons. While cumbersome, it would not be difficult for a typical hydrofracked site to sidestep any withdrawal permitting process if the water were removed over the course of several days by several different private haulers, particularly if the water were hauled any distance. It is conceivable that the gas drilling industry could readily exploit this loophole in the regulations.

Table 1. Dates by which Application for Initial Permit Must Be Completed

June 1, 2013 Systems that withdraw or are designed to withdraw a volume of 100 million gallons per day (mgd) or more
Feb. 15, 2014 Systems that withdraw or are designed to withdraw a volume equal to or greater than 10 mgd but less than 100 mgd
Feb. 15, 2015 Systems that withdraw or are designed to withdraw a volume equal to or greater than 2 mgd but less than 10 mgd
Feb. 15, 2016 Systems that withdraw or are designed to withdraw a volume equal to or greater than 0.5 mgd but less than 2 mgd
Feb. 15, 2017 Systems that withdraw or are designed to withdraw a volume equal to or greater than 0.1 but less than 0.5 mgd


Table 2. Water Users with Maximum Usage over 100 MGD

Facility Name Town/City County Average Units Max. Units
St. Lawrence/ FDR Power Project Massena St.Lawrence 79278.00 MGD 108686.00 MGD
Niagara Power Project Lewiston Niagara 47463.00 MGD 62164.00 MGD
Indian Point 2&3 LLCs Cortlandt Westchester 2024.00 MGD 2489.00 MGD
New York City DEP Neversink Sullivan 1078.00 MGD 1418.00 MGD
James A. Fitzpatrick Nuclear Power Plant Scriba Oswego 543.00 MGD 596.00 MGD
Ravenswood Generating Station Queens Queens 512.90 MGD 1390.00 MGD
Arthur Kill Generating Station Richmond Richmond 480.00 MGD 712.80 MGD
Astoria Generating Station Queens Queens 455.60 MGD 723.70 MGD
RE Ginna Nuclear Power Plant Ontario Wayne 427.00 MGD 511.00 MGD
Nine Mile Point Nuclear Station Scriba Oswego 401.10 MGD 457.10 MGD
Roseton Generating Station Newburgh Orange 340.54 MGD 794.40 MGD
Dunkirk Generating Station Dunkirk Chautauqua 304.00 MGD
Danskammer Generating Newburgh Orange 278.80 MGD 455.04 MGD
East River Generating Station New York New York 264.10 MGD 371.80 MGD
AES Somerset Somerset Niagara 239.00 MGD 274.00 MGD
AES Cayuga Lansing Tompkins 214.12 MGD 243.36 MGD
Huntley Generating Station Tonawanda Erie 200.00 MGD 406.00 MGD
Oswego Harbor Power Oswego Oswego 167.70 MGD 364.21 MGD
Genon Bowline Haverstraw Rockland 74.94 MGD 989.29 MGD
Monroe County Water Authority-Shoremont Greece Monroe 55.40 MGD 109.00 MGD


 Special thanks to Rachel Treichler for her insights and extensive background knowledge on this topic.

Determination Letters Added to PADEP Groundwater Complaints Map

A couple of months ago, Laura Legere of the Scranton Times-Tribune published an article showing her research into determination letters sent by the Pennsylvania Department of Environmental Protection (PADEP) in response to people who claimed that their groundwater had been impacted by oil and gas activity in the state.  Of the 973 complaints represented on this dataset, the PADEP has determined a causality between the oil and gas activity and the water complaint in 162 instances.  Note that not all of these complaints are necessarily as a result of the hydraulic fracturing (a.k.a. fracking) stage of operations.

The FracTracker Alliance assisted in the project by creating an interactive map of the instances throughout the state.  As the Scranton Times-Tribune has now made digital scans of each of the 973 records available on their servers, we have been able to link to them on the map.

In this screen capture, the popup box for the first of eleven complaints mapped at this location is shown.  In order to access the determination letter, the user must simply click on the PDF logo.

In this screen capture, the popup box for the first of eleven complaints mapped at this location is shown. In order to access the determination letter, the user must simply click on the PDF logo.

Names, addresses, and other personal information about the complainants have been removed from this dataset in order to protect their privacy.  And because the locations are drawn at the center-point of the municipality in which they live, we can get a general sense for the distribution of the events without being able to zoom in one the affected parties’ houses.

To get an idea of what the determination letters look like, here is one example in which the PADEP indicates that someone’s water supply has been impacted by gas drilling:

A portion of one of the determination letters sent by PADEP to a landowner in response to a complaint about groundwater.  Click the image to access the full PDF file.

A portion of one of the determination letters sent by PADEP to a landowner in response to a complaint about groundwater. Click the image to access the full PDF file.

Here is the dynamic version of the map of the complaints:


Please click on the Fullscreen icon to load our full suite of controls.

This updated data has also been added to the US Map of Suspected Well Water Impact project:

NY State Hydraulic Fracturing Bans Relative to Population

By Karen Edelstein, NY Program Coordinator

According to industry projections, one of the next big frontiers for Marcellus shale-gas development may be in the New York State Counties bordering northern Pennsylvania. However, after more than four years of discussion, two versions of the Supplemental Generic Environmental Impact Statement (SGEIS), and hundreds of thousands of citizen and professional comments on the SGEIS and regulatory framework, the future for hydrofracturing for natural gas in New York  is still highly contested–both in statewide political and locally-based fora.

This map shows the municipalities, as of July 2013, that have enacted hydrofracking prohibitions, represented relative to the population size of those towns. New York State municipalities began invoking home rule laws as early as 2010 to prohibit high volume hydraulic fracturing for natural gas. Primarily implementing zoning tools, these towns found that while they could not regulate against drilling, outright, they could determine appropriate land uses within the town or village boundaries. In this map, bans are shown as red circles, moratoria are shown as lavender, and movements for bans or moratoria are shown in yellow.

As of June 2013, 61 municipalities have passed permanent bans against HVHF, and 111 municipalities have enacted temporary moratoria while they explore the issue more fully, or draft ban legislation.

Within the area of New York State that overlies the Utica Shale, the major population centers, including Buffalo, Rochester, Syracuse, Binghamton, Union, Utica, and Albany have all enacted bans or moratoria. This unprecedented movement is the reaction to concerns of residents who do not desire large-scale energy industrialization, and who have been frustrated with the pace at which the New York State government has been finalizing their generic environmental impact statement, health review, and gas extraction regulations. Large urban centers account for more than 13% of the population in the area over the shale-gas formation that have enacted local prohibitions. These municipalities, along with more than 150 more across the region, (accounting for more than 28% of the region’s total population) have taken precautions to protect the air, water, food, and landscape from the potential risks of hydraulic fracturing that other communities in Pennsylvania, Texas, North Dakota, Wyoming, and beyond, have experienced.  An additional 88 towns (representing over 8% of the population over the Utica Shale formation) have grassroots movements that are spearheading discussions on the need and desire for bans or moratoria. On a town-by-town basis, population-dense centers, as well as rural towns and villages, are exercising democracy to determine whether or not they will risk living with this form of industrial development.