Data transparency is a major issue in the oil and gas world. Some states in the U.S. do not make the location or other details associated with wells easy to find. If one is looking for Pennsylvania data, however, the basic datasets are quite accessible. The PA Department of Environmental Protection (DEP) maintains several datasets on unconventional drilling activity in the Commonwealth and provides this information online and free of charge to the public. The following databases are ones that we commonly use to update our maps and perform data analyses:
Below are tips for how to search the PA DEP’s records and download datasets if you would like:
Dates
Date ranges must be entered in these databases in order to narrow down the search. We suggest starting with 1/1/2000 through current if you would like to see all unconventional activity to date.
County, Municipality, Region, and Operator
This criteria can be further refined by selecting particular counties, regions, etc.
Unconventional Only
For all datasets, “Unconventional Only – Yes” should be selected if you are only interested in the wells that have been drilled into unconventional shale formations and hydraulically fractured, or “fracked.”
“Unconventional” definitions according to PA Code, Chapter 78:
Unconventional well — A bore hole drilled or being drilled for the purpose of or to be used for the production of natural gas from an unconventional formation.
Unconventional formation — A geological shale formation existing below the base of the Elk Sandstone or its geologic equivalent stratigraphic interval where natural gas generally cannot be produced at economic flow rates or in economic volumes except by vertical or horizontal well bores stimulated by hydraulic fracture treatments or by using multilateral well bores or other techniques to expose more of the formation to the well bore.
Download
Once search criteria have been defined, click View Report to see the most up to date information compiled below. From there, the file can be downloaded in different formats, such as a PDF or Excel file.
Visit this page to see all of the oil and gas reports that the PA DEP issues.
https://www.fractracker.org/a5ej20sjfwe/wp-content/uploads/2014/03/DEP-centered-rgb.png470811FracTracker Alliancehttps://www.fractracker.org/a5ej20sjfwe/wp-content/uploads/2021/04/2021-FracTracker-logo-horizontal.pngFracTracker Alliance2014-03-28 10:03:252020-07-21 10:42:24Finding PA Department of Environmental Protection Data
By Mary Ellen Cassidy, Community Outreach Coordinator, FracTracker Alliance
A Water Use Series
Many of us do our best to stay current with the latest research related to water impacts from unconventional drilling activities, especially those related to hydraulic fracturing. However, after attending presentations and reading recent publications, I realized that I knew too little about questions like:
How much water is used by hydraulic fracturing activities, in general?
How much of that can eventually be used for drinking water again?
How much is removed from the hydrologic cycle permanently?
To help answer these kinds of questions, FracTracker will be running a series of articles that look at the issue of drilling-related water consumption, the potential community impacts, and recommendations to protect community water resources.
Ceres Report
We have posted several articles on water use and scarcity in the past here, here, here and here. This article in the series will share information primarily from Monika Freyman’s recent Ceres report, Hydraulic Fracturing & Water Stress: Water Demand by the Numbers, February 2014. If you hunger for maps, graphs and stats, you will feast on this report. The study looks at oil and gas wells that were hydraulically fractured between January 2011 and May 2013 based on records from FracFocus.
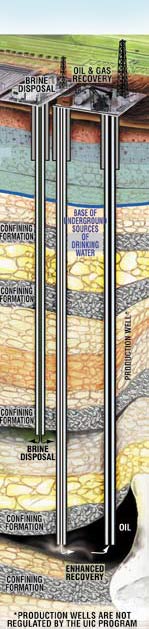
Class 2 UI Wells
Water scarcity from unconventional drilling is a serious concern. According to Ceres analysis, horizontal gas production is far more water intensive than vertical drilling. Also, the liquids that return to the surface from unconventional drilling are often disposed of through deep well injection, which takes the water out of the water cycle permanently. By contrast, water uses are also high for other industries, such as agriculture and electrical generation. However, most of the water used in agriculture and for cooling in power plants eventually returns to the hydrological cycle. It makes its way back into local rivers and water sources.
In the timeframe of this study, Ceres reports that:
97 billion gallons of water were used, nearly half of it in Texas, followed by Pennsylvania, Oklahoma, Arkansas, Colorado and North Dakota, equivalent to the annual water need of 55 cities with populations of ~ 5000 each.
Over 30 counties used at least one billion gallons of water.
Nearly half of the wells hydraulically fractured since 2011 were in regions with high or extremely high water stress, and over 55% were in areas experiencing drought.
Over 36% of the 39,294 hydraulically fractured wells in the study overlay regions experiencing groundwater depletion.
The largest volume of hydraulic fracturing water, 25 billion gallons, was handled by service provider, Halliburton.
Water withdrawals required for hydraulic fracturing activities have several worrisome impacts. For high stress and drought-impacted regions, these withdrawals now compete with demands for drinking water supplies, as well as other industrial and agricultural needs in many communities. Often this demand falls upon already depleted and fragile aquifers and groundwater. Groundwater withdrawals can cause land subsidence and also reduce surface water supplies. (USGS considers ground and surface waters essentially a single source due to their interconnections). In some areas, rain and snowfall can recharge groundwater supplies in decades, but in other areas this could take centuries or longer. In other areas, aquifers are confined and considered nonrenewable. (We will look at these and additional impact in more detail in our next installments.)
Challenges of documenting water consumption and scarcity
Tracking water volumes and locations turns out to be a particularly difficult process. A combination of factors confuse the numbers, like conflicting data sets or no data, state records with varying criteria, definitions and categorization for waste, unclear or no records for water volumes used in refracturing wells or for well and pipeline maintenance.
Along with these impediments, “chain of custody” also presents its own obstacles for attempts at water bookkeeping. Unconventional drilling operations, from water sourcing to disposal, are often shared by many companies on many levels. There are the operators making exploration and production decisions who are ultimately liable for environmental impacts of production. There are the service providers, like Halliburton mentioned above, who oversee field operations and supply chains. (Currently, service providers are not required to report to FracFocus.) Then, these providers subcontract to specialists such as sand mining operations. For a full cradle-to-grave assessment of water consumption, you would face a tangle of custody try tracking water consumption through that.
To further complicate the tracking of this industry’s water, FracFocus itself has several limitations. It was launched in April 2011 as a voluntary chemical disclosure registry for companies developing unconventional oil and gas wells. Two years later, eleven states direct or allow well operators and service companies to report their chemical use to this online registry. Although it is primarily intended for chemical disclosure, many studies, like several of those cited in this article, use its database to also track water volumes, simply because it is one of the few centralized sources of drilling water information. A 2013 Harvard Law School study found serious limitations with FracFocus, citing incomplete and inaccurate disclosures, along with a truly cumbersome search format. The study states, “the registry does not allow searching across forms – readers are limited to opening one PDF at a time. This prevents site managers, states, and the public from catching many mistakes or failures to report. More broadly, the limited search function sharply limits the utility of having a centralized data cache.”
To further complicate water accounting, state regulations on water withdrawal permits vary widely. The 2011 study by Resources for the Future uses data from the Energy Information Agency to map permit categories. Out of 30 states surveyed, 25 required some form of permit, but only half of these require permits for all withdrawals. Regulations also differ in states based on whether the withdrawal is from surface or groundwater. (Groundwater is generally less regulated and thus at increased risk of depletion or contamination.) Some states like Kentucky exempt the oil and gas industry from requiring withdrawal permits for both surface and groundwater sources.
Can we treat and recycle oil and gas wastewater to provide potable water?
Will recycling unconventional drilling wastewater be the solution to fresh water withdrawal impacts? Currently, it is not the goal of the industry to recycle the wastewater to potable standards, but rather to treat it for future hydraulic fracturing purposes. If the fluid immediately flowing back from the fractured well (flowback) or rising back to the surface over time (produced water) meets a certain quantity and quality criteria, it can be recycled and reused in future operations. Recycled wastewater can also be used for certain industrial and agricultural purposes if treated properly and authorized by regulators. However, if the wastewater is too contaminated (with salts, metals, radioactive materials, etc.), the amount of energy required to treat it, even for future fracturing purposes, can be too costly both in finances and in additional resources consumed.
It is difficult to find any peer reviewed case studies on using recycled wastewater for public drinking purposes, but perhaps an effective technology that is not cost prohibitive for impacted communities is in the works. In an article in the Dallas Business Journal, Brent Halldorson, a Roanoke-based Water Management Company COO, was asked if the treated wastewater was safe to drink. He answered, “We don’t recommend drinking it. Pure distilled water is actually, if you drink it, it’s not good for you because it will actually absorb minerals out of your body.”
Can we use sources other than freshwater?
How about using municipal wastewater for hydraulic fracturing? The challenge here is that once the wastewater is used for hydraulic fracturing purposes, we’re back to square one. While return estimates vary widely, some of the injected fluids stay within the formation. The remaining water that returns to the surface then needs expensive treatment and most likely will be disposed in underground injection wells, thus taken out of the water cycle for community needs, whereas municipal wastewater would normally be treated and returned to rivers and streams.
Could brackish groundwater be the answer? The United States Geological Survey defines brackish groundwater as water that “has a greater dissolved-solids content than occurs in freshwater, but not as much as seawater (35,000 milligrams per liter*).” In some areas, this may be highly preferable to fresh water withdrawals. However, in high stress water regions, these brackish water reserves are now more likely to be used for drinking water after treatment. The National Research Council predicts these brackish sources could supplement or replace uses of freshwater. Also, remember the interconnectedness of ground to surface water, this is also true in some regions for aquifers. Therefore, pumping a brackish aquifer can put freshwater aquifers at risk in some geologies.
Contaminated coal mine water – maybe that’s the ticket? Why not treat and use water from coal mines? A study out of Duke University demonstrated in a lab setting that coal mine water may be useful in removing salts like barium and radioactive radium from wastewater produced by hydraulic fracturing. However, there are still a couple of impediments to its use. Mine water quality and constituents vary and may be too contaminated and acidic, rendering it still too expensive to treat for fracturing needs. Also, liability issues may bring financial risks to anyone handling the mine water. In Pennsylvania, it’s called the “perpetual treatment liability” and it’s been imposed multiple times by DEP under the Clean Streams Law. Drillers worry that this law sets them up somewhere down the road, so that courts could hold them liable for cleaning up a particular stream contaminated by acid mine water that they did not pollute.
More to come on hydraulic fracturing and water scarcity
Although this article touches upon some of the issues presented by unconventional drilling’s demands on water sources, most water impacts are understood and experienced most intensely on the local and regional level. The next installments will look at water use and loss in specific states, regions and watersheds and shine a light on areas already experiencing significant water demands from hydraulic fracturing. In addition, we will look at some of the recommendations and solutions focused on protecting our precious water resources.
https://www.fractracker.org/a5ej20sjfwe/wp-content/uploads/2013/10/P1010865-scaled.jpg11251500FracTracker Alliancehttps://www.fractracker.org/a5ej20sjfwe/wp-content/uploads/2021/04/2021-FracTracker-logo-horizontal.pngFracTracker Alliance2014-03-19 13:24:322020-07-21 10:42:23H 2 O Where Did It Go?
By Kyle Ferrar, CA Program Coordinator, FracTracker Alliance
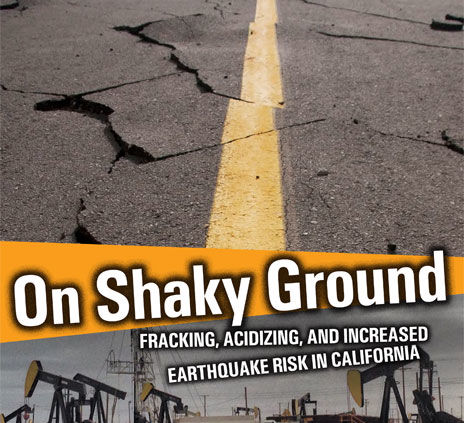
In collaboration with the environmental advocacy groups Earthworks, Center for Biological Diversity, and Clean Water Action, The FracTracker Alliance has completed a proximity analysis of the locations of California’s Class II oil and gas wastewater injection wells to “recently” active fault zones in California. The results of the analysis can be found in the On Shaky Ground report, available for download at www.ShakyGround.org.1
Production of oil and natural gas results in a large and growing waste stream. Using current projections for oil development, the report projects a potential 9 trillion gallons of wastewater over the lifetime of the Monterey shale. In California the majority of wastewater is injected deep underground for disposal in wells deemed Class II wastewater injection. The connection between seismic activity and underground injections of fluid has been well established, but with the current surge of shale resource development the occurrence of earthquakes in typically seismically inactive regions has increased, including a recent event in Ohio covered by the LA Times. While both hydraulic fracturing and wastewater injection wells have been linked to the induction of seismic activity, the impacts of underground injection wells used for disposal are better documented and linked to larger magnitude earthquakes.
Therefore, while hydraulic fracturing of oil and gas wells has also been documented to induce seismic activity, the focus of this report is underground injection of waste fluids.
Active CA Faults
A spatial overview of the wastewater injection activity in California and recently active faults can be viewed in Figure 1, below.
Figure 1. California’s Faults and Wastewater Injection Wells. With this and all maps on this page, click on the arrows in the upper right hand corner of the map to view it fullscreen and to see the legend and more details.
The focus of the On Shaky Ground report outlines the relationship between does a thorough job reviewing the literature that shows how the underground injection of fluids induces seismic activity. The proximity analysis of wastewater injection wells, conducted by The FracTracker Alliance, provides insight into the spatial distribution of the injection wells. In addition, the report M7.8 earthquake along the San Andreas fault could cause 1,800 fatalities and nearly $213 billion in economic damages.2 To complement the report and provide further information on the potential impacts of earthquakes in California, FracTracker created the maps in Figure 2 and Figure 3.
Shaking Assessments
Figure 2 presents shaking amplification and shaking hazards assessments. The dataset is generated from seismic evaluations. When there is an earthquake, the ground will amplify the seismic activity in certain ways. The amount of amplification is typically dependent on distance to the earthquake event and the material that comprises the Earth’s crust. Softer materials, such as areas of San Francisco built on landfills, will typically shake more than areas comprised of bedrock at the surface. The type of shaking, whether it is low frequency or high frequency will also present varying hazards for different types of structures. Low frequency shaking is more hazardous to larger buildings and infrastructure, whereas high frequency events can be more damaging to smaller structure such as single family houses. Various assessments have been conducted throughout the state, the majority by the California Geological Survey and the United States Geological Survey.
Figure 2. California Earthquake Shaking Amplification and Class II Injection Wells
Landslide Hazards
Below, Figure 3. Southern California Landslide and Hazard Zones expands upon the map included in the On Shaky Ground report; during an earthquake liquefaction of soil and landslides represent some of the greatest hazards. Liquefaction refers to the solid earth becoming “liquid-like”, whereas water-saturated, unconsolidated sediments are transformed into a substance that acts like a liquid, often in an earthquake. By undermining the foundations of infrastructure and buildings, liquefaction can cause serious damage. The highest hazard areas shown by the liquefaction hazard maps are concentrated in regions of man-made landfill, especially fill that was placed many decades ago in areas that were once submerged bay floor. Such areas along the Bay margins are found in San Francisco, Oakland and Alameda Island, as well as other places around San Francisco Bay. Other potentially hazardous areas include those along some of the larger streams, which produce the loose young soils that are particularly susceptible to liquefaction. Liquefaction risks have been estimated by USGS and CGS specifically for the East Bay, multiple fault-slip scenarios for Santa Clara and for all the Bay Area in separate assessments. There are not regional liquefaction risk estimate maps available outside of the bay area, although the CGS has identified regions of liquefaction and landslide hazards zones for the metropolitan areas surrounding the Bay Area and Los Angeles. These maps outline the areas where liquefaction and landslides have occurred in the past and can be expected given a standard set of conservative assumptions, therefore there exist certain zoning codes and building requirements for infrastructure.
Figure 3. California Liquefaction/Landslide Hazards and Class II Injection Wells
Press Contacts
For more information about this report, please reach out to one of the following media contacts:
Arbelaez, J., Wolf, S., Grinberg, A. 2014. On Shaky Ground. Earthworks, Center for Biological Diversity, Clean Water Action. Available at ShakyGround.org
Jones, L.M. et al. 2008. The Shakeout Scenario. USGS Open File Report 2008-1150. U.S. Department of the Interior, U.S. Geological Survey.
https://www.fractracker.org/a5ej20sjfwe/wp-content/uploads/2014/03/shakyground-cover.jpg600464Kyle Ferrar, MPHhttps://www.fractracker.org/a5ej20sjfwe/wp-content/uploads/2021/04/2021-FracTracker-logo-horizontal.pngKyle Ferrar, MPH2014-03-15 20:37:072020-07-21 10:42:23Class II Oil and Gas Wastewater Injection and Seismic Hazards in CA
By Ted Auch, PhD – OH Program Coordinator, FracTracker Alliance
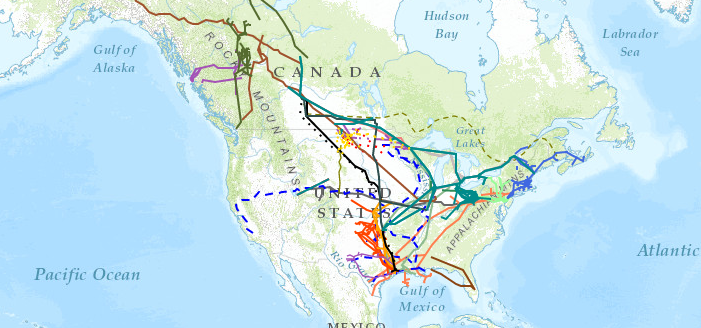
With all the focus on the existing TransCanada Keystone XL pipeline – as well as the primary expansion proposal recently rejected by Lancaster County, NB Judge Stephanie Stacy and more recently the Canadian National Energy Board’s approval of Enbridge’s Line 9 pipeline – we thought it would be good to generate a map that displays related proposals in the US and Canada.
North American Proposed Pipelines and Current Pipelines
To view the fullscreen version of this map along with a legend and more details, click on the arrows in the upper right hand corner of the map.
The map was last updated in October 2014.
Pipeline Incidents
The frequency and intensity of proposals and/or expansions of existing pipelines has increased in recent years to accompany the expansion of the shale gas boom in the Great Plains, Midwest, and the Athabasca Tar Sands in Alberta. This expansion of existing pipeline infrastructure and increased transport volume pressures has resulted in significant leakages in places like Marshall, MI along the Kalamazoo River and Mayflower, AR. Additionally, the demand for pipelines is rapidly outstripping supply – as can be seen from recent political pressure and headline-grabbing rail explosions in Lac-Mégantic, QC, Casselton, ND, Demopolis, AL, and Philadelphia.1 According to rail transport consultant Anthony Hatch, “Quebec shocked the industry…the consequences of any accident are rising.” This sentiment is ubiquitous in the US and north of the border, especially in Quebec where the sites, sounds, and casualties of Lac-Mégantic will not soon be forgotten.
Improving Safety Through Transparency
It is imperative that we begin to make pipeline data available to all manner of parties ex ante for planning purposes. The only source of pipeline data historically has been the EIA’s Pipeline Network. However, the last significant update to this data was 7/28/2011 – meaning much of the recent activity has been undocumented and/or mapped in any meaningful way. The EIA (and others) claims national security is a primary reason for the lack of data updates, but it could be argued that citizens’ right-to-know with respect to pending proposals outweighs such concerns – at least at the county or community level. There is no doubt that pipelines are magnets for attention, stretching from the nefarious to the curious. Our interest lies in filling a crucial and much requested data gap.
Metadata
Pipelines in the map above range from the larger Keystone and Bluegrass across PA, OH, and KY to smaller ones like the Rex Energy Seneca Extension in Southeast Ohio or the Addison Natural Gas Project in Vermont. In total the pipeline proposals presented herein are equivalent to 46% of EIA’s 34,133 pipeline segment inventory (Table 1).
Table 1. Pipeline segments (#), min/max length, total length, and mean length (miles).
Section
#
Min
Max
Mean
Sum
Bakken
34
18
560
140
4,774
MW East-West
68
5
1,056
300
20,398
Midwest to OK/TX
13
13
1,346
307
3,997
Great Lakes
5
32
1,515
707
3,535
TransCanada
3
612
2,626
1,341
4,021
Liquids Ventures
2
433
590
512
1,023
Alliance et al
3
439
584
527
1,580
Rocky Express
2
247
2,124
1,186
2,371
Overland Pass
6
66
1,685
639
3,839
TX Eastern
15
53
1,755
397
5,958
Keystone Laterals
4
32
917
505
2,020
Gulf Stream
2
541
621
581
1,162
Arbuckle ECHO
25
27
668
217
5,427
Sterling
9
42
793
313
2,817
West TX Gateway
13
1
759
142
1,852
SXL in PA and NY
15
48
461
191
2,864
New England
70
2
855
65
4,581
Spectra BC
9
11
699
302
2,714
Alliance et al
4
69
4,358
2,186
4,358
MarkWest
63
2
113
19
1,196
Mackenzie
46
3
2,551
190
8,745
Total
411
128
1,268
512
89,232†
† This is equivalent to 46% of the current hydrocarbon pipeline inventory in the US across the EIA’s inventory of 34,133 pipeline segments with a total length of 195,990 miles
The map depicts all of the following (Note: Updated quarterly or when notified of proposals by concerned citizens):
We generated this map by importing JPEGs into ArcMAP 10.2, we then “Fit To Display”. Once this was accomplished we anchored the image (i.e., georeferenced) in place using a minimum of 10 control points (Note: All Root Mean Square (RMS) error reports are available upon request) and as many as 30-40. When JPEGs were overly distorted we then converted or sought out Portable Network Graphic (PNG) imagery to facilitate more accurate anchoring of imagery.
We will be updating this map periodically, and it should be noted that all layers are a priori aggregations of regional pipelines across the 4 categories above.
Every six months, the Pennsylvania Department of Environmental Protection (PADEP) publishes production and waste data for all unconventional wells drilled in the Commonwealth. These data are self-reported by the industry to PADEP, and in the past, there have been numerous issues with the data not being reported in a timely fashion. Therefore, the early versions of these two datasets are often incomplete. For that reason, I now like to wait a few weeks before analyzing and mapping this data, so as to avoid false conclusions. That time has now come.
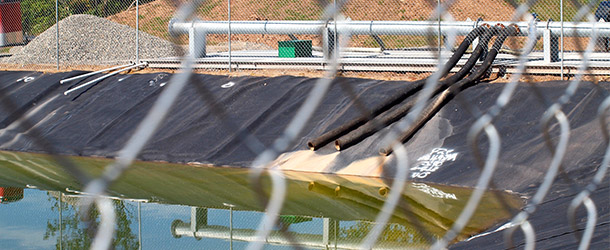
This map contains production and waste totals from unconventional wells in Pennsylvania from July to December, 2013. Based on data downloaded March 6, 2014. Also included are facilities that received the waste produced by these wells. To access the legend and other map controls, please click the expanding arrows icon at the top-right corner of the map.
Production
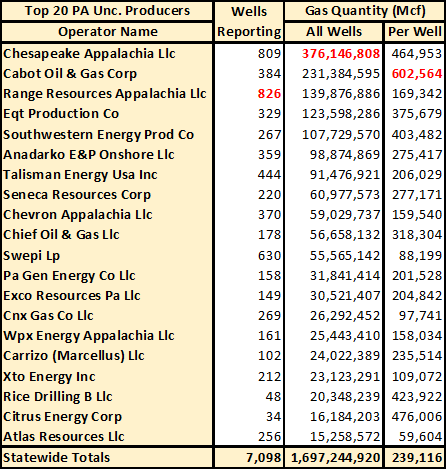
Table 1: Top 20 unconventional gas producers in PA, from July to December 2013. Highest values in each column are highlighted in red.
Production values can be summarized in many ways. In this post, we will summarize the data, first by operator, then by county. For operators, we will take a look at all operators on the production report, and see which operator has the highest total production, as well as production per well (Table 1).
It is important to note that not all of the wells on the report are actually in production, and not all of the ones that are produce for the entire cycle. However, there is some dramatic variance in the production that one might expect from an unconventional well in Pennsylvania that correlates strongly with which operator drilled the well in question. For example, the average Cabot well produces ten times the gas that the average Atlas well does. Even among the top two producers, the average Chesapeake well produces 2.75 times as much as the average Range Resources well.
The location of the well is the primary factor in regards to production values. 74 percent of Atlas’ wells are in Greene and Fayette counties, in southwestern Pennsylvania, while 99 percent of Cabot’s wells are in Susquehanna County. Similarly, 79 percent of Range Resources’ wells are in the its southwestern PA stronghold of Washington County, while 62 percent of Chesapeake’s wells are in Bradford county, in the northeast.
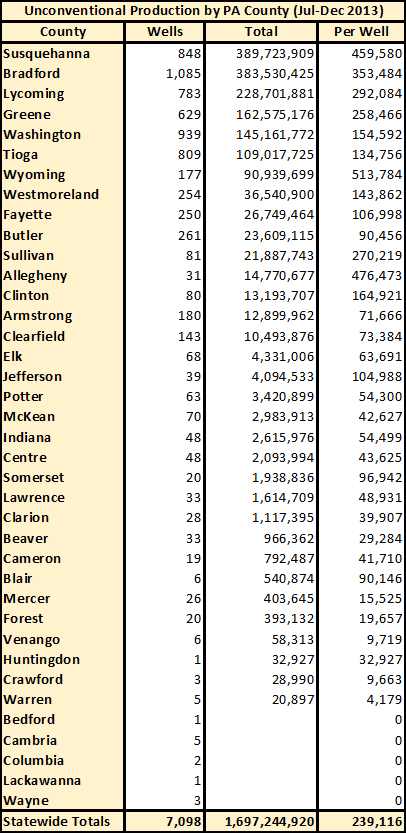
Table 2: PA unconventional gas production by county, from July to December 2013
Altogether, there are unconventional wells drilled in 38 Pennsylvania counties, 33 of which have wells that are producing (see Table 2). And yet, fully 1 trillion cubic feet (Tcf) of t he 1.7 Tcf produced by unconventional wells during the six month period in Pennsylvania came from the three northeastern counties of Susquehanna, Bradford, and Lycoming.
While production in Greene County does not compare to production in Susquehanna, this disparity still does not account for the really poor production of Atlas wells, as that operator averages less than one fourth of the typical well in the county. Nor can we blame the problem on inactive wells, as 84 of their 85 wells in Greene County are listed as being in production. There is an explanation, however. All of these Atlas wells were drilled from 2006 through early 2010, so none of them are in the peak of their production life cycles.
There is a different story in Allegheny County, which has a surprising high per well yield for a county in the southwestern part of the state. Here, all of the wells on the report were drilled between 2008 and 2013, and are therefore in the most productive part of the well’s life cycle. Only the most recent of these wells is listed as not being in production.
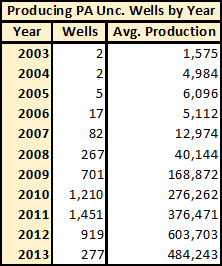
Table 3: Per well production during last half of 2013 for PA unconventional wells by spud year
Generally speaking, the further back a well was originally drilled, the less gas it will produce (see Table 3). At first glance, it might be surprising to note that the wells drilled in 2012 produced more gas than those drilled in 2013, however, as the data period is for the last half of 2013, there were a number of wells drilled that year that were not in production for the entire data cycle.
In addition to gas, there were 1,649,699 barrels of condensate and 182,636 barrels of oil produced by unconventional wells in Pennsylvania during the six month period. The vast majority of both of these resources were extracted from Washington County, in the southwestern part of the state. 540 wells reported condensate production, while 12 wells reported oil.
Waste
There are eight types of waste detailed in the Pennsylvania data, including:
Basic Sediment (Barrels) – Impurities that accompany the desired product
Drill Cuttings (Tons) – Broken bits of rock produced during the drilling process
Flowback Fracturing Sand (Tons) – Sand used as proppants during hydraulic fracturing that return to the surface
Fracing Fluid Waste (Barrels) – Fluid pumped into the well for hydraulic fracturing that returns to the surface. This includes chemicals that were added to the well.
Produced Fluid (Barrels) – Naturally occurring brines encountered during drilling that contain various contaminants, which are often toxic or radioactive
Servicing Fluid (Barrels) – Various other fluids used in the drilling process
Spent Lubricant (Barrels) – Oils used in engines as lubricants
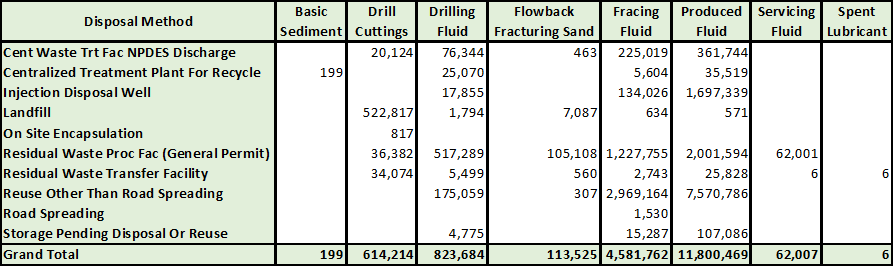
Table 4: Method of disposing of waste generated from unconventional wells in PA from July to December 2013
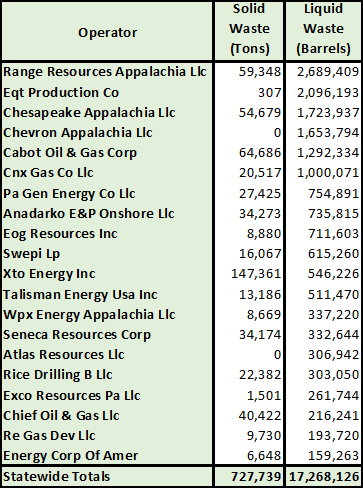
Table 5: Solid & liquid waste disposal for top 20 producers of PA unconventional liquid waste during last half of 2013
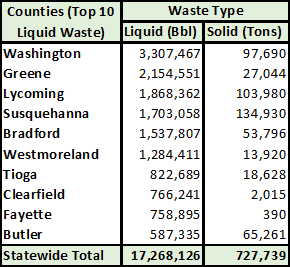
Table 6: Solid & liquid waste totals for the 10 counties that produced the most liquid waste over the 6 month period
There are numerous methods for disposing of drilling waste in Pennsylvania (see Table 4). Some of the categories include recycling for future use, others are merely designated as stored temporarily, and others are disposed or treated at a designated facility. One of the bright points of the state’s waste data is that it includes the destination of that waste on a per well basis, which has allowed us to add receiving facilities to the map at the top of the page.
As eight data columns per table is a bit unwieldy, we have aggregated the types by whether they are solid (reported in tons) or liquid (reported in 42 gallon barrels). Because solid waste is produced as a result of the drilling and fracturing phases, it isn’t surprising that the old Atlas wells produced no new solid waste (see Table 5). Chevron Appalachia is more surprising, however, as the company spudded 46 wells in 2013, 12 of which were started during the last half of the year. However, Chevron’s liquid waste totals were significant, so it is possible that some of their solid waste was reported, but miscategorized.
As with production, location matters when it comes to the generation of waste from these wells. But while the largest gas producing counties were led by three counties in the northeast, liquid waste production is most prolific in the southwest (see Table 6).
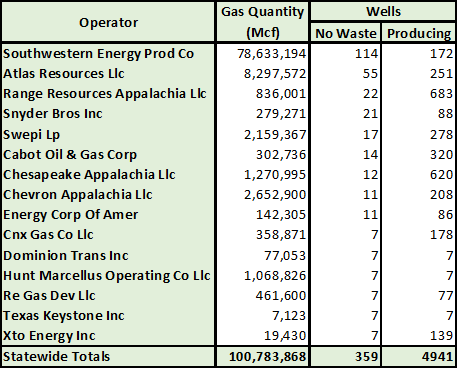
Table 7: PA unconventional operators with the most wells that produced gas, oil, and/or condensate, but no amount of waste.
Finally, we will take a look at the 359 wells that are indicated as in production, yet were not represented on the waste report as of March 6th. These remarkable wells are run by 38 different operators, but some companies are luckier with the waste-free wells than their rivals. As there was a six-way tie for 10th place among these operators, as sorted by the number or wells that produce gas, condensate, or oil but not waste, we can take a look at the top 15 operators in this category (see Table 7). Of note, gas quantity only includes production from these wells. Column on the right shows total number of wells that are indicated as producing, for that same operator, regardless of waste production.
114 of Southwestern Energy’s 172 producing wells were not represented on the waste report as of March 6th, representing just under two thirds of the total. In terms of the number of waste-free wells, Atlas was second, with 55. As for the highest percentage, Dominon, Hunt, and Texas Keystone all managed to avoid producing any waste at all for each of their seven respective producing wells, according to this self-reported data.
https://www.fractracker.org/a5ej20sjfwe/wp-content/uploads/2013/10/Impoundment.jpg250610Matt Kelso, BAhttps://www.fractracker.org/a5ej20sjfwe/wp-content/uploads/2021/04/2021-FracTracker-logo-horizontal.pngMatt Kelso, BA2014-03-13 14:33:502020-07-21 10:42:22PA Production and Waste Data Updated
The Society for American Archaeology (SAA) has estimated there to be over 195,000 cultural, historic, and archaeological sites in just nine of the most active shale formations located in the U.S. to date (see SAA report). The FracTracker Alliance has also mapped data from the National Registry of Historic Places (see below), which includes approximately 70,000 listed properties—fewer than the number of archaeological sites in the State of New Mexico alone. There is, therefore, much to be gained by all stakeholders in generating a model that will help companies manage risk effectively and protect these sites with consistent, thoughtful approaches.
Digitized items on the National Register of Historic Places (NRHP), and shale plays and basins, where unconventional drilling operations most often occur. Please note that not all of the items on the NRHP have been digitized. To access legend, layer descriptions, and other map controls, please click the expanding arrows icon in the top-right corner of the map.
Last year, a group of representatives from the energy industry and the historic preservation community founded the Gas and Preservation Partnership (GAPP), a collaboration between the energy industry and the historic preservation community to advance energy exploration while protecting historic and cultural sites. These innovators believe strongly that collaboration – rather than contention – is key to managing these resources while also encouraging efficient exploration and development of energy reserves. GAPP’s primary goal is to work together to develop model voluntary practices that will balance business and preservation interests.
GAPP is holding its first summit on March 21, 2014, in Pittsburgh, Pennsylvania to kick off its unique effort to the larger community: “Bridging the GAPP: Honoring our History – Fueling our Future.” GAPP’s board members, who represent multiple aspects of the shale gas and cultural resources fields, welcome participation from all those interested in finding roads to solutions. Learn more
For other opportunities to get involved or general questions, check out GAPP’s website or Facebook page or send an email to GAPP’s counsel, Marion Werkheiser, at Cultural Heritage Partners.
https://www.fractracker.org/a5ej20sjfwe/wp-content/uploads/2014/03/cultural-historic-and-archaeological-sites-e1454013495530.png297611Guest Authorhttps://www.fractracker.org/a5ej20sjfwe/wp-content/uploads/2021/04/2021-FracTracker-logo-horizontal.pngGuest Author2014-03-06 11:00:002020-07-21 10:41:56Preserving Archaeological Sites with GAPP
By Kyle Ferrar, CA Program Coordinator, FracTracker Alliance
California Regulations.
As confusing as you may think the regulatory structure is in your state (if you are not fortunate enough to be a Californian), just know that California’s regulatory structure is more complicated. Nothing in California’s recent history has clarified this point like the current debate over “fracking” regulations (hydraulic fracturing, as well as acidizing and other stimulation techniques). Since the passage of California State Bill 4 (SB-4), there have been significant concerns for self-rule and self-determination for individual communities. Further complicating the issue are the fracking activities being conducted from the offshore oil rig platforms located in federal waters. In addition to federal regulation, the California Department of Conservation’s Division of Oil, Gas, and Geothermal Resources is the premier regulatory authority for oil and gas drilling and production in the state. The State Water Resources Control Board and the Regional Water Quality Control Board hold jurisdiction over the states surface and groundwater resources, while the California Air Districts regulate air quality along with the California Air Resources Board. It is no surprise that a report published by the Wheeler Institute from the University of California, Berkeley found that this regulatory structure where several state and federal agencies share responsibility is not conducive to ensuring hydraulic fracturing is conducted safely.[1]
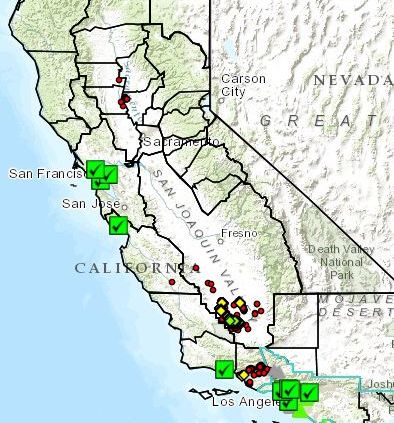
A Ban in Los Angeles, CA
The most recent local regulatory activity comes from the Los Angeles City Council. On Friday February 28, 2014, the City Council voted on and passed a resolution to draft language for a citywide ban of all stimulation techniques. The resolution calls for city zoning code to be amended in order to prohibit hydraulic fracturing activities in L.A. until the practices are proven to be safe. A final vote will then be cast to approve the final language. If it passes, Los Angeles will be the largest city in the United States to ban hydraulic fracturing. The FracTracker “Local Actions and Regulations Map” has been updated to include the Los Angeles resolution/ordinance, as well as the resolution supporting a statewide ban by the San Francisco Board of Supervisors, the moratorium in Santa Cruz County, and a resolution by the University of California, Berkeley Student Government. See all California’s local actions and regulations in the figure below. Click on the green checked boxes for a description of each action.
Click on the arrows in the upper right hand corner of the map for the legend and to view the map fullscreen.
State Bill 4 Preemption
Since the passage of California’s new regulatory bill SB-4, there has been a lot of confusion and debate whether the new state regulations preempt local jurisdictions from passing their own laws and regulations, and specifically moratoriums and bans. The county of Santa Cruz has a moratorium on fracking, but it was passed prior to the enactment of SB-4. Additionally Santa Cruz County is not a hotbed of drilling activity like Los Angeles or Kern. The team of lawyers representing the county of Ventura, where wells are actively being stimulated, came to a very different conclusion than the Los Angeles City Council. After reviewing SB-4, Ventura County came to the conclusion that lower jurisdictions were blocked from enacting local moratoriums. Draft minutes from the December 17, 2013 meeting quote, “The legal analysis provided by County Counsel indicates that the County is largely preempted from actively regulating well stimulation treatment activities at both new and existing wells. However, the County is required under CEQA to assess and address the potential environmental impacts from such activities requiring a discretionary County approval of new well sites.”[2]
On the other hand, independent analyses of the language in California SB-4 show that the legal-ese does not contain any provision that supersedes related local regulations. Rather, the bill preserves the right of local governments to impose additional environmental regulations.[3] The regulations do not expressively comment on the ability of local regulations to pass a moratorium or permanent ban. Additionally, DOGGR has supported a court decision that the SB-4 language expressly prohibits the state regulatory agency from enforcing the California Environmental Quality Act (according to the Division of Oil, Gas and Geothermal Resources).[4] As for local measures, a recent article by Edgcomb and Wilke (2013) provides multiple examples of precedence in California and other states for local environmental bans and regulations in conjunction with less restrictive state law.[3] Of course, any attempt to pass a ban on fossil fuel extraction or development activities where resource development is actively occurring will most likely be met with litigation and a lawsuit from industry groups such as the Western States Petroleum Association. Industry representatives charge that the ordinance is an unconstitutional “taking” of previously leased mineral rights by private property owners.[5,6] Pay close attention to this fight in Los Angeles, as there will be repercussions relevant to all local governments in the state of California, particularly those considering bans or moratoriums.
[1] Kiparsky, Michael and Hein, Jayni Foley. 2013. Regulation of Hydraulic Fracturing in California, a Wastewater and Water Quality Perspective. Wheeler Institute for Water Law and Policy. Center for Law Energy and the Environment, University of California Berkeley School of Law.
[2] Ventura County Board of Supervisors. December 17, 2013. Meeting Minutes and Video. Accessed March 2, 2014. [http://www.ventura.org/bos-archives/agendas-documents-and-broadcasts]
[2] Edgcomb, John D Esq. and Wilke, Mary E Esq. January 10, 2014. Can Local Governments Ban Fracking After New California Fracking Legislation? Accessed March 3, 2014. [http://californiafrackinglaw.com/can-local-governments-ban-fracking-after-new-california-fracking-legislation/]
[3] Hein, Jayni Foley. November 18, 2013. State Releases New Fracking Regulations amid SB 4 Criticism, Controversy. Accessed February 27, 2014. [http://blogs.berkeley.edu/2013/11/18/state-releases-new-fracking-regulations-amid-sb-4-criticism-controversy/]
[4] Fine, Howard. February 28, 2014. L.A. Council Orders Fracking Moratorium Ordinance. Los Angeles Business Journal. [http://labusinessjournal.com/news/2014/feb/28/l-council-orders-fracking-moratorium-ordinance/]
[5] Collier, Robert. March 3, 2014. L.A. fracking moratorium – the difficult road ahead. Climate Speak. Accessed March 4, 2014. [http://www.climatespeak.com/2014/03/la-fracking-moratorium.html]
[6] Higgins, Bill. Schwartz, Andrew. Kautz, Barbara. 2006. Regulatory Takings and Land Use Regulation: A Primer for Public Agency Staff. Institute for Local Government. Available at [http://www.ca-ilg.org/sites/main/files/file-attachments/resources__Takings_1.pdf]
https://www.fractracker.org/a5ej20sjfwe/wp-content/uploads/2014/03/CA-Local-govt-actions-map-thumb.jpg505394Kyle Ferrar, MPHhttps://www.fractracker.org/a5ej20sjfwe/wp-content/uploads/2021/04/2021-FracTracker-logo-horizontal.pngKyle Ferrar, MPH2014-03-04 17:25:552020-07-21 10:41:55What Does Los Angeles Mean for Local Bans and Moratoria in California?
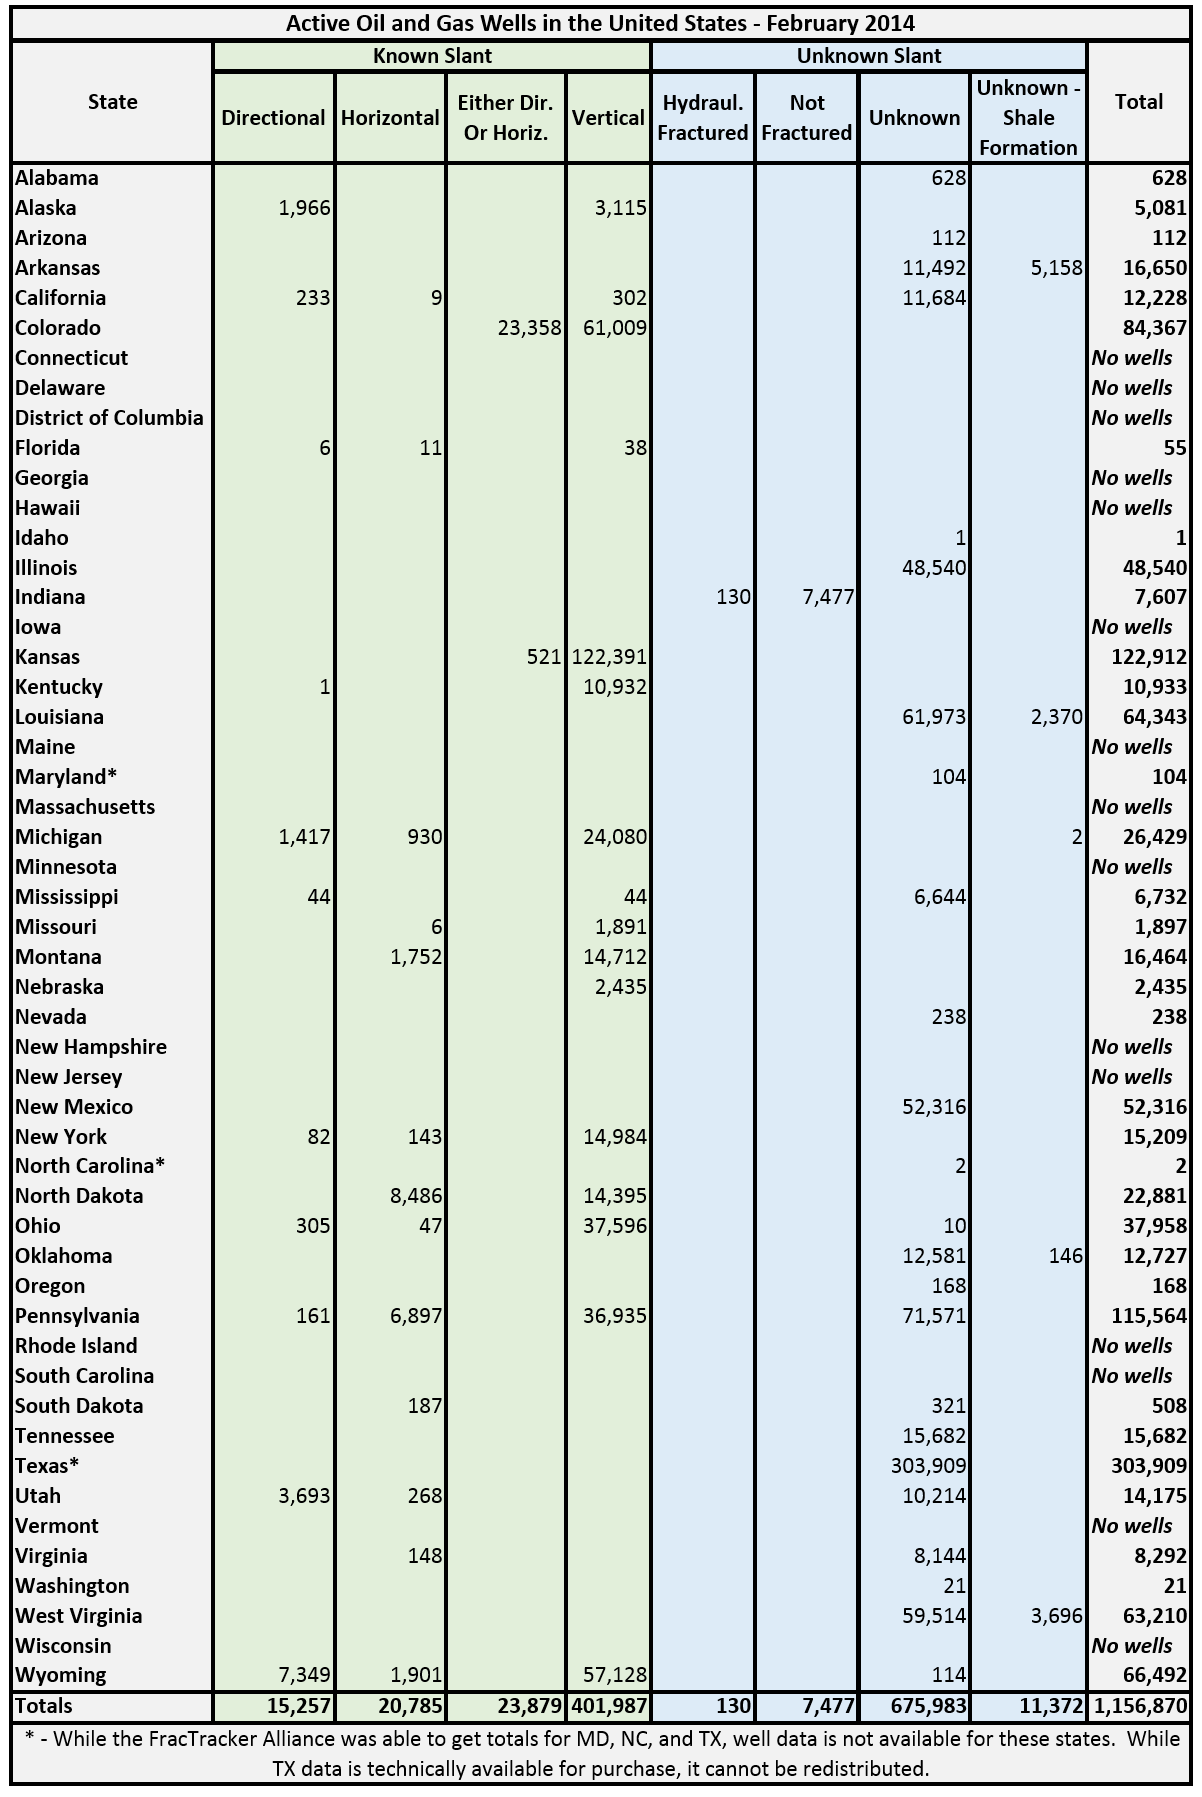
Many people ask us how many wells have been hydraulically fractured in the United States. It is an excellent question, but not one that is easily answered; most states don’t release data on well stimulation activities. Also, since the data are released by state regulatory agencies, it is necessary to obtain data from each state that has oil and gas data to even begin the conversation. We’ve finally had a chance to complete that task, and have been able to aggregate the following totals:
Oil and gas summary data of drilled wells in the United States.
While data on hydraulically fractured wells is rarely made available, the slant of the wells are often made accessible. The well types are as follows:
Directional: Directional wells are those where the top and the bottom of the holes do not line up vertically. In some cases, the deviation is fairly slight. These are also known as deviated or slant wells.
Horizontal: Horizontal wells are directional wells, where the well bore makes something of an “L” shape. States may have their own definition for horizontal wells. In Alaska, these wells are defined as those deviating at least 80° from vertical. Currently, operators are able to drill horizontally for several miles.
Directional or Horizontal: These wells are known to be directional, but whether they are classified as horizontal or not could not be determined from the available data. In many cases, the directionality was determined by the presence of directional sidetrack codes in the well’s API number.
Vertical: Wells in which the top hole and bottom hole locations are in alignment. States may have differing tolerances for what constitutes a vertical well, as opposed to directional.
Hydraulically Fractured: As each state releases data differently, it wasn’t always possible to get consistent data. These wells are known to be hydraulically fractured, but the slant of the well is unknown.
Not Fractured: These wells have not been hydraulically fractured, and the slant of the well is unknown.
Unknown: Nothing is known about the slant, stimulation, or target formation of the well in question.
Unknown (Shale Formation): Nothing is known about the slant or stimulation of the wells in question; however, it is known that the target formation is a major shale play. Therefore, it is probable that the well has been hydraulically fractured, with a strong possibility of being drilled horizontally.
Wells that have been hydraulically fractured might appear in any of the eight categories, with the obvious exception of “Not Fractured.” Categories that are very likely to be fractured include, “Horizontal”, “Hydraulically Fractured”, and “Unknown (Shale Formation),” the total of which is about 32,000 wells. However, that number doesn’t include any wells from Texas or Colorado, where we know thousands wells have been drilled into major shale formations, but the data had to be placed into categories that were more vague.
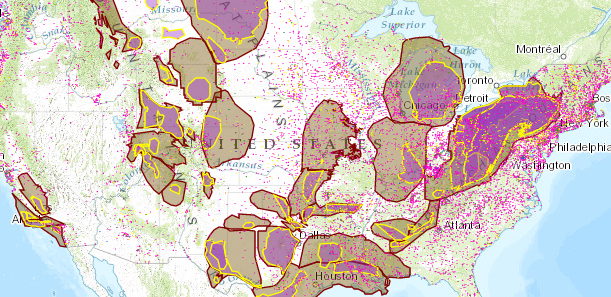
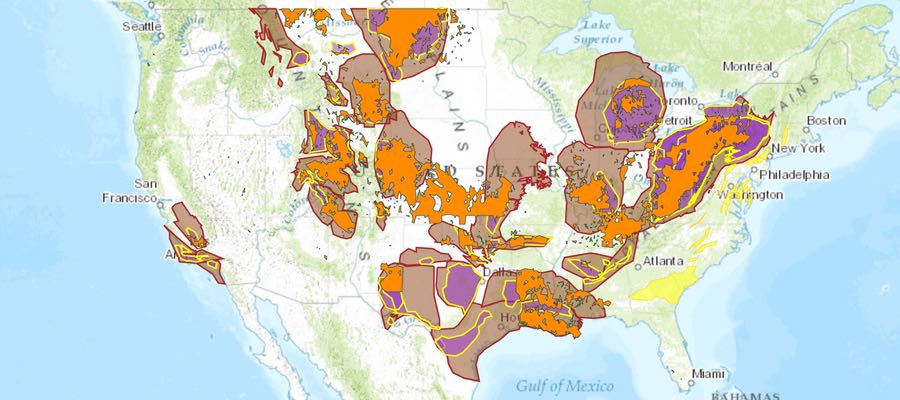
Oil and gas wells in the United States, as of February 2014. Location data were not available for Maryland (n=104), North Carolina (n=2), and Texas (n=303,909). To access the legend and other map tools, click the expanding arrows icon in the top-right corner.
The standard that we attempted to reach for all of the well totals was for wells that have been drilled but have not yet been plugged, which is a broad spectrum of the well’s life-cycle. In some cases, decisions had to be made in terms of which wells to include, due to imperfect metadata.
No location data were available for Maryland, North Carolina, or Texas. The first two have very few wells, and officials in Maryland said that they expect to have the data available within about a month. Texas location data is available for purchase, however such data cannot be redistributed, so it was not included on the map.
It should not be assumed that all of the wells that are shown in the map above the shale plays and shale basin layers are actually drilled into shale. In many cases, however, shale is considered a source rock, where hydrocarbons are developed, before the oil and gas products migrate upward into shallower, more conventional formations.
The raw data oil and gas data is available for download on our site in shapefile format.
https://www.fractracker.org/a5ej20sjfwe/wp-content/uploads/2014/03/US-ShaleViewer-Feature.jpg400900Matt Kelso, BAhttps://www.fractracker.org/a5ej20sjfwe/wp-content/uploads/2021/04/2021-FracTracker-logo-horizontal.pngMatt Kelso, BA2014-03-04 12:37:152020-07-21 10:41:55Over 1.1 Million Active Oil and Gas Wells in the US
 Will recycling unconventional drilling wastewater be the solution to fresh water withdrawal impacts? Currently, it is not the goal of the industry to recycle the wastewater to potable standards, but rather to treat it for future hydraulic fracturing purposes. If the fluid immediately flowing back from the fractured well (flowback) or rising back to the surface over time (produced water) meets a certain quantity and quality criteria, it can be recycled and reused in future operations. Recycled wastewater can also be used for certain industrial and agricultural purposes if treated properly and authorized by regulators. However, if the wastewater is too contaminated (with salts, metals, radioactive materials, etc.), the amount of energy required to treat it, even for future fracturing purposes, can be too costly both in finances and in additional resources consumed.