Updated PA Data and Trends
By Matt Kelso, Manager of Data and Technology
The FracTracker Alliance periodically takes a deeper look into the unconventional oil and gas data in Pennsylvania, in order to provide updates for some frequently requested statistics on the industry. Here we provide updated PA data and trends as of December 4, 2014. Since unconventional drilling began in the Commonwealth permits have been issued to drill 15,573 unconventional wells, according to data from the Pennsylvania DEP. Many – 8,696 (56%) – of those permits have actually been drilled. In terms of violations, there have been 5,983 entries on the statewide Compliance Report for unconventional wells throughout the state, which are attributed to 1,790 distinct wells.
Pennsylvania Shale Viewer Map
Please click here for the full screen version, with additional map tools and controls.
Additional Stats
The number of permits, wells, and violations vary significantly from month to month, but each category is well off of its peak. The largest number of unconventional permits issued in a single month was 402, which was in December 2010, more than twice as many as were issued last month. In that year, there were six months with 300 or more permits issued, whereas there has only been one such month to date in 2014.
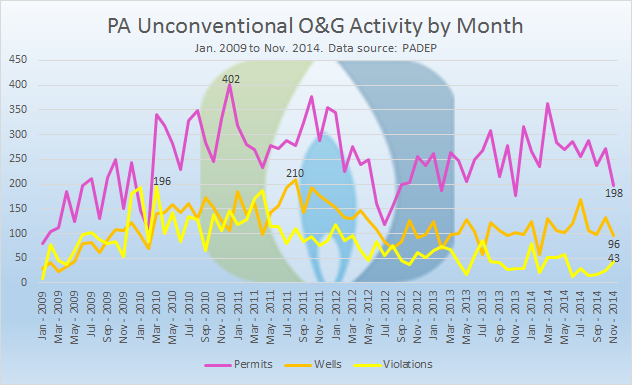
PA unconventional O&G activity per month from Jan. 2009 to Nov. 2014. Source: PADEP
The 210 wells spudded (drilled) in August 2011 represents the high water mark, and is more than two times the amount of wells drilled last month. In the 28 months between March 2010 and June 2012, the industry failed to spud 100 wells only once, reaching 98 in April 2011. In the first 11 months of 2014, that plateau was missed three times, with a low of 58 spuds in February.
There was a significant spike in violations appearing on the compliance report from December 2009 through August 2011. More than 100 violations were issued in 17 out of 21 months, including 196 in March 2010. The number of violations issued has slowed down considerably since then, with November 2014 being the 34th straight month with fewer than 100 violations. Only 14 violations were issued in June 2014.
Violations per Well (VpW)
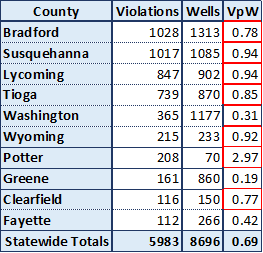
Unconventional violations per well by county in PA, showing the 10 counties with the largest number of violations. Counties with an above average Violations per Well (VpW) score are highlighted in red.
We often ask whether drilling is more problematic in some areas than others. Since the number of wells varies depending upon the location, we must approach this question by looking at the number of violations issued per well drilled (VpW). However, there is an important caveat to consider. Put simply, what is a violation? The Pennsylvania DEP publishes a Compliance Report for unconventional wells, which has 5,983 incidents listed from 2000 through December 4, 2014. However, it used to be common for the DEP to lump several incidents into the same Violation ID number, although this is not the case for more recent infractions. When the DEP counts violations issued, they look at the total number of unique Violation ID numbers that have been issued, not the total number of incidents on the report. Here, we include the more inclusive list of items on the compliance report.
Of the 10 counties with the largest number of violations issued, only 3 counties have a violations per well mark below the statewide average. Notably, each of those three counties are located in Southwestern Pennsylvania. It is unclear from these numbers what is going on in Potter County, but clearly there is a significant problem in that location – with almost three violations issued per well drilled, Potter County has a VpW score 4.3 times the statewide average.
Operator Trends
Before we look at the operators with the most violations, there is an additional caveat to consider: It is relatively common for wells to change hands over their operational lifetimes. This characteristic could be due to one company buying another out, or simply transferring some of their assets. Still, wells changing from one operator to another is a normal aspect of the oil and gas industry. Such a fact matters for this analysis because while violations issued always stick with the responsible party in the DEP data, the name of the operator changes on the Spud Report to the current operator.
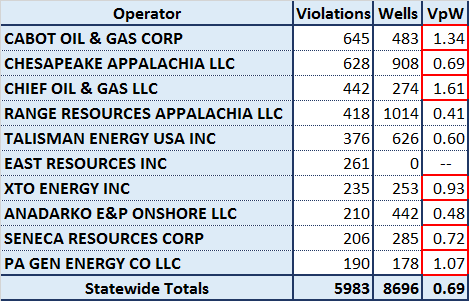
Unconventional violations per well by operator in PA, showing the 10 operators with the largest number of violations. Operators with an above average Violations per Well (VpW) score are highlighted in red.
Because of how these datasets are maintained, we see that East Resources has 261 violations for zero wells, which is of course an impossibly large ratio. That is because East sold off its stake in the Marcellus to Royal Dutch Shell, which does business as SWEPI in Pennsylvania. SWEPI, by the way, is 13th on the list of violations in its own right, with 154 violations for 675 wells, resulting in a 0.23 VpW. If the legacy violations for the old East wells were included, the result would be a 0.61 ViW score, which is almost three times as high, but still below the statewide average. FracTracker doesn’t do the analysis that way, both because it is unfair to the new operator to charge them with violations that they had nothing to do with, as well as being nearly impossible to keep track of the various transactions that result in wells changing hands over the years.
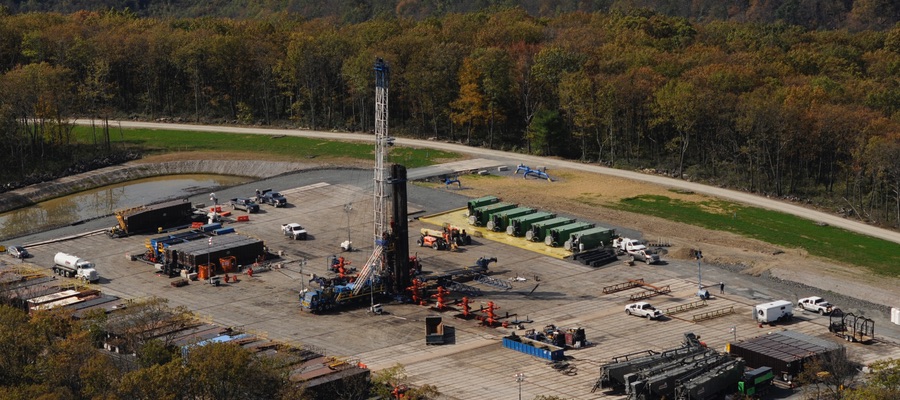
Cover image by Pete Stern, 2013.