Wastewater Pits Still Allowed in California
By Kyle Ferrar, Western Program Coordinator
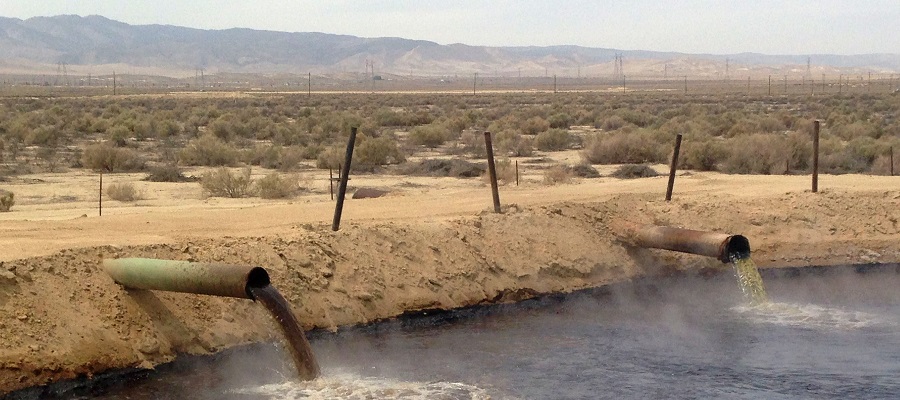
Above-ground, unlined, open-air sumps/ponds
It is hard to believe, but disposing of hazardous oil and gas wastewaters in unlined, open-air pits – also known as sumps or ponds – is still a common practice in California. It is also permitted in other states such as Texas and West Virginia. Because these ponds are unlined and not enclosed, they contribute to degraded air quality, are a hazard for terrestrial animals and birds, and threaten groundwater quality. A 2014 report by Clean Water Action, entitled In the Pits provides a thorough summary of the issue in California. Since the report was released, new data has been made available by the Central Valley Regional Water Quality Review Board identifying additional locations of wastewater pits.
With the increase of oil and gas development in unconventional reservoirs, such as the Monterey Shale Play in California, the size of the resultant waste stream of drill cuttings, produced brines, and wastewater has skyrocketed. Operators now drill larger, deeper wells, requiring larger volumes of liquid required for enhanced oil recovery methods, such as steam injection, and stimulations such as hydraulic fracturing and acidizing. While California is the 4th largest oil-producing state, it is 2nd only to Texas in wastewater production. This boom of unconventional development, which may still in its infancy in California, has resulted in an annual waste stream of over 130 billion gallons across the state, 80 billion (62%) from Kern County alone.1
Results of the state mandated California Council on Science and Technology Report found that more than half of the California oil industries waste water is “disposed” in pits.2 As outlined by Clean Water Action, the massive waste-stream resulting from drilling, stimulation, and production is one of the most significant and threatening aspects of oil and gas operations in terms of potential impacts to public health and environmental resources.
Wastewater Facility Details
Last February, the LA Times reported on the pits, identifying a total of 933 in California.3 The most recent data from the Regional Water Quality Control Board of the Central Valley shows:
- A total of 1,088 pits at 381 different facilities
- 719 pits are listed as “Active.” 369 are “Idle.”
- 444/939 (47.3%) ponds do not list a permit.
- 462 pits are operated by Valley Water Management Corporation.
In Table 1, below, the counts of Active and Idle facilities and pits are broken down further to show the numbers of sites that are operating with or without permits. The same has been done for the operator with the most pits in Table 2, because Valley Wastewater operates nearly 9 times as many pits as the second largest operator, E & B Natural Resources Management Corporation. These two operators, along with California Resources Elk Hills LLC, all operate the same number of facilities (28). The other top 20 operators in Kern County are listed in Table 3, below.
| Table 1. Wastewater Pit and Facility Counts by Category | ||
| Counts | Active | Idle |
| Facilities | 180 | 201 |
| Unpermitted Facilities | 102 | 179 |
| Facility Permitted prior to 1985 | 37 | 11 |
| Individual Pits | 719 | 369 |
| Unpermitted Individual Pits | 187 | 257 |
| Pit Permitted prior to 1985 | 252 | 63 |
| Table 2. Valley Water Wastewater Pit and Facility Counts by Category | ||
| Counts | Active | Inactive |
| Facilities | 21 | 7 |
| Unpermitted Facilities | 2 | 2 |
| Facility Permitted prior to 1985 | 9 | 1 |
| Individual Pits | 356 | 78 |
| Unpermitted Individual Pits | 5 | 9 |
| Pit Permitted prior to 1985 | 166 | 35 |
| Table 3. Top 20 Operators by Facility Count, with Pond Counts. | |||
| Rank | Operator | Pond Count | Facility Count |
| 1 | Valley Water Management Company | 462 | 28 |
| 2 | E & B Natural Resources Management Corporation | 53 | 28 |
| 3 | California Resources Elk Hills, LLC | 31 | 28 |
| 4 | Aera Energy LLC | 67 | 25 |
| 5 | California Resources Corporation | 31 | 23 |
| 6 | Chevron U.S.A. Inc. | 40 | 14 |
| 7 | Pyramid Oil Company | 21 | 12 |
| 8 | Macpherson Oil Company | 14 | 9 |
| 9 | Schafer, Jim & Peggy | 8 | 8 |
| 10 | Crimson Resource Management | 20 | 6 |
| 11 | Bellaire Oil Company | 11 | 6 |
| 12 | Howard Caywood | 11 | 6 |
| 13 | LINN Energy | 10 | 6 |
| 14 | Seneca Resources Corporation | 9 | 6 |
| 15 | Holmes Western Oil Corporation | 6 | 6 |
| 16 | Hathaway, LLC | 22 | 5 |
| 17 | Central Resources, Inc. | 15 | 5 |
| 18 | Griffin Resources, LLC | 13 | 5 |
| 19 | KB Oil & Gas | 8 | 5 |
| 20 | Petro Resources, Inc. | 6 | 5 |
Maps of the Pit Locations and Details
The following maps use the Water Authority data to show the locations details of the wastewater pits. The first map shows the number of pits housed at each facility. Larger markers represent more pits. Zoom in closer using the [+] to see the activity status of the facilities. Click the link below the map to open a new webpage. View the names of the facility operators by turning on the layer in the “Layers” menu at the top of the page. The second and third maps show the activity and permit status of each facility. The fourth map allows you to view both activity status and permit status simultaneously by toggling the layers on and off (Open the map in its own webpage, then use the layers menu at the top of the screen to change views).
Map 1. Facility Pit Counts with the top 10 operators identified as well as facility status
Map 1. To view the legend and map full screen, click here.
Map 2. Facility Activity Status
Map 2. To view the legend and map full screen, click here.
Map 3. Facility Permit Status
Map 3. To view the legend and map full screen, click here.
Map 4. Facilityhttps://maps.fractracker.org/lembed/?appid=7385605f018e437691731c94bb589f0a” width=”800″ height=”500″>
Map 4. To view the legend and map full screen, click here.
References
- USGS. 2014. Oil, Gas, and Groundwater Quality in California – a discussion of issues relevant to monitoring the effects of well stimulation at regional scales.. California Water Science Center. Accessed 10/1/15.
- CCST. 2015. Well Stimulation in California. California Council on Science and Technology. Accessed 9/1/15.
- Cart, Julie. 2/26/15. Hundreds of illicit oil wastewater pits found in Kern County . Los Angeles Times. Accessed 9/1/15.