More Oil Field Wastewater Pits Found in California!
Who’s in charge here?
By Kyle Ferrar, Western Program Coordinator
FracTracker Alliance recently worked with Clean Water Action to map an update to last year’s report* on the use of unlined, above ground oil and gas waste disposal pits, also known as sumps.
The new report identifies additional oil field wastewater pits and details how California regulators continue to allow these facilities to degrade groundwater, surface waters, and air quality. Other oil and gas production states do not permit or allow these type of operations due to the many documented cases of water contamination. A report published in 2011 identified unlined pits and other surface spills as the largest threat to groundwater quality. The sites are ultimately sacrifice zones, where the contamination from produced water and drilling mud solid wastes leaves a lasting fingerprint.
Central Coast & New Central Valley Pit Data
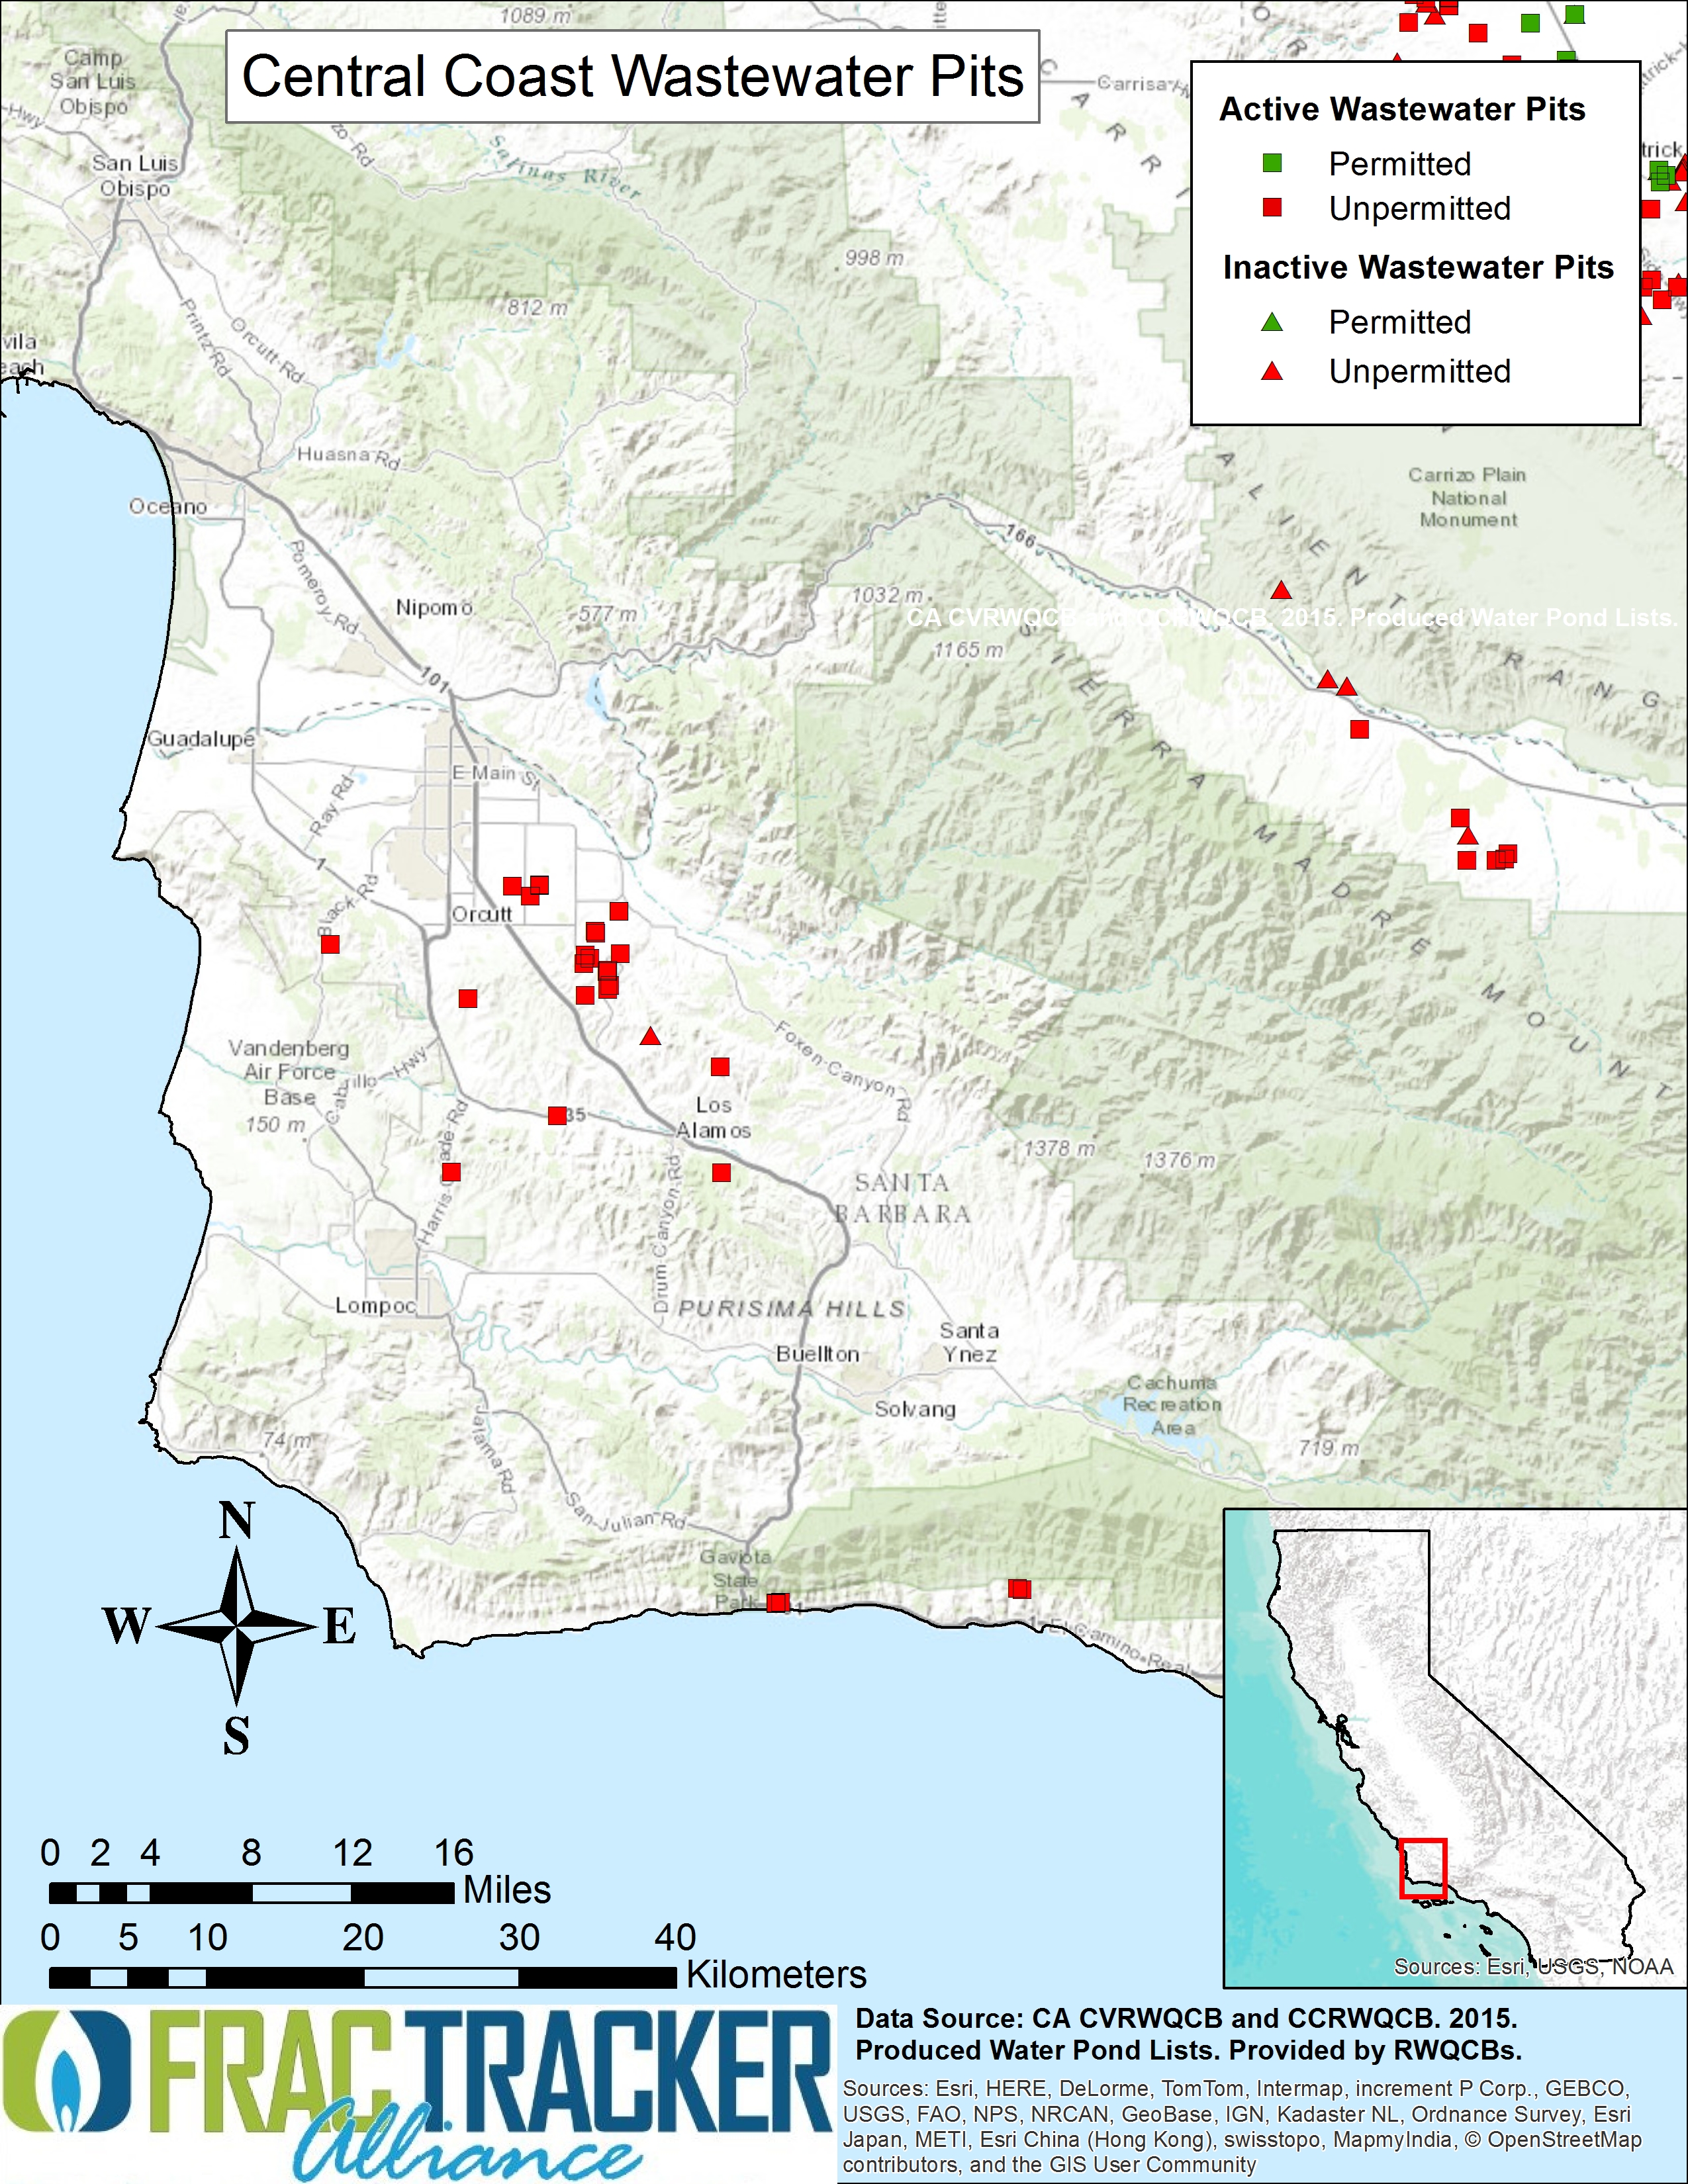
Figure 1. Central Coast wastewater pits
New data has been released by the Central Coast Regional Water Quality Control Board, identifying the locations of 44 active wastewater facilities and 5 inactive facilities in the California counties of Monterey, Santa Barbara, and San Luis Obispo. The number of pits at each facility is not disclosed, but satellite imagery shows multiple pits at some facilities. The locations of the majority of central coast pits are shown in the map in Figure 1, to the right.
In the web map below (Figure 2), the most updated data shows the number of pits at “active” facilities (those currently operating), shown in red and green, and inactive pits, shown in yellow and orange. The number of pits at each facility in the central valley are shown by the size of the graduated circles. Pit count data for the central coast facilities was not reported, therefore all facilities are shown with a small marker.
Figure 2. Interactive map of California oil field wastewater pits
View Map Fullscreen | How Our Maps Work | Download Map Data (Zip File)
Exploring the new central coast data shows that the operators with the most facilities include Greka Oil & Gas Inc. (14), E & B Natural Resources (10), ERG Operating Company, LLC (6), and Chevron (5). As shown in the table below, the majority of central coast pits are located in Santa Barbara County.
Table 1. Summaries by County
| Site Counts by Activity and County | ||||
| Facility Counts | Pit Counts | |||
| County | Active | Inactive | Active | Inactive |
| Santa Barbara | 35 | 2 | Unknown | Unknown |
| Monterey | 9 | 0 | Unknown | 0 |
| San Luis Obispo | 0 | 3 | 0 | Unknown |
| Kern | 161 | 191 | 673 | 347 |
| Fresno | 8 | 5 | 31 | 14 |
| Tulare | 6 | 1 | 28 | 1 |
| Kings | 5 | 0 | 14 | 0 |
| San Benito | 0 | 4 | 0 | 5 |
| Grand Total | 224 | 206 | 746 | 367 |
Wastewater Pit Regulations
Way back in 1988, the U.S. EPA recognized that the federal regulations governing disposal practices of wastewater are inadequate to protect public health, but has yet to take action (NRDC 2015). There is little chance the U.S. EPA will enact regulations focused on pits. In certain cases, if wastewaters spill or are discharged to surface waters the operations will fall under the jurisdiction of the Clean Water Act and will require a National Pollutant Discharge Elimination System (NPDES) permit. Since the objective of the pit is to contain the wastewater to keep it away from surface waters, pits and the wastewater facilities in California that manage them do not require federal oversight. For now the responsibility to protect health and environment has been left to the states.
Most states have responded and have strict regulations for wastewater management. For the few states that allow unlined pits, the main use is storage of wastewater rather than as an dedicated method of disposal. The majority of high production states have banned or ended the use of unlined pits, including Texas, North Dakota, Pennsylvania, Ohio, and New Mexico, Texas (Heberger & Donnelly 2015). An effective liner will prevent percolation of wastewaters into groundwater. The goal of California oil field wastewater pits is quite the opposite.
For California, percolation is the goal and a viable disposal option.
Therefore other regulations that require monitoring of liquid levels in the pits are moot. In fact there is no evidence of regulation requiring spill reporting in California whatsoever (Kuwayama et al. 2015).
Numerous other extraction states throughout the country have phased out the use of open pits entirely, including those with liners due to the common occurrence of liner failures. The list includes those new players in the shale boom using hydraulic fracturing techniques such as North Dakota, Ohio, Pennsylvania, Wyoming, and Colorado. Rather than using the pits as storage, these states’ regulatory agencies favor instead the protections of closed systems of liquid storage. Wastewaters are stored in large tanks, often the same tanks used to store the fresh water used in the hydraulic fracturing process.
Because hydraulic fracturing in California uses much less water, it should be much easier to manage the flowback fluids and other wastewaters. According to the CCST report, 60% of the produced water from hydraulic fracturing operations was disposed to these unlined pits. Regardless of extraction technique, oil extraction in California produces 15 times the amount of wastewater. In total, an estimated 40% of all produced water was discharged to unlined “percolation” pits. As the 3rd largest oil producing state in the country, this equates to a massive waste stream of about 130 billion gallons/year (Grinberg 2014).
Regulatory Action
The facilities’ permits identify waste discharge requirements (WDRs) that allow for the discharge of oil field wastewater to the “ground surface, into natural drainage channels, or into unlined surface impoundments.” Using the Race Track Hill and Fee 34 Facilities as an example, the WDRS place criteria limits on total dissolved solids (TDS), chlorides, and boron. If you disregard all the other toxic constituents not monitored, the allowable concentration limits set for these three wastewater constituents would be reasonable for a discharge permit on the east coast, where a receiving body of water could provide the volume necessary for dilution. When the wastewater is applied directly to the ground or into a pit, the evaporative loss of water results in elevated concentrations of these contaminants.
Even with these very lax regulations, a number of facilities are in violation of the few restrictions required in their permits. Cease and desist orders have been several operators, most notably to Valley Water Management’s Race Track Hill and Fee 34 Facilities. According to the Regional Water Board documents, the Fee 34 disregarded salinity limitations and other regulations. As a result the Regional Water Board found soil and groundwater contamination that “threatens or creates a condition of pollution in surface and groundwater, and may result in the degradation of water quality.” Reports show that 6 domestic supply and 12 agricultural supply wells are located within 1 mile of the Fee 34 facility. At the Race Track Hill Facility the wastewater is continuously sprayed over several acre fields in a small watershed of the Cottonwood Creek. During a rain, the salt and boron loadings that have accumulated in the soil over the past 60 years of spraying can create increased salt and boron loading in the Kern River and groundwater. This would be a violation of the Clean Water Act (CVRWQCB 2015).
As shown in Table 2, below, the majority of facilities are currently operating without a permit whatsoever (61.2%). Of the 72 facilities that bothered to get permits, 32 (44.4%) received the permit prior to 1975, before the Tulare Basin Plan was implemented to preserve water quality. Of the 183 active facilities in the Central Valley, only 15 facilities have received Cease and Desist (11% of permitted) or Cleanup and Abatement Orders (6% of unpermitted). Only 3 of the 41 active Central Coast facilities operate with a permit (7.3%).
These types of WDR permits that allow pollutants to concentrate in the soil and the groundwater and degrade air quality. Chemicals that pose a public health risk are not being monitored. But at this point, these facilities are not only sites of legacy contamination, but growing threats to groundwater security. Operators say that closing the pits will mean certain doom for oil extraction in California, and recent letters from operators make pleas to DOGGR, that their very livelihood depends on using the pits as dumping grounds. The pits are the cheapest and least regulated mode of disposal.
Table 2. Facility Status Summaries
| Facility Status | |||||
| Activity | Permitted | Permitted; Cease & Desist Order | Unpermitted | Unpermitted; Cleanup & Abatement Order | Grand Total |
| Active | 75 | 9 | 137 | 6 | 227 |
| Inactive | 20 | 2 | 184 | 3 | 209 |
| Grand Total | 92 | 11 | 321 | 9 | 433 |
New Mexico Case Study
Much like the groundwater impacts documented by California’s Central Valley Regional Water Quality Control Board, other states have been forced to deal with this issue. The difference is that other states have actually shut down the polluting facilities. In California, cease and desist orders have been met with criticism and pleas by operators, stating that the very livelihood of the oil and gas industry in California depends on wastewater disposal in pits. The same was said in other states such as New Mexico when these crude and antiquated practices were ended. Figure 3 below shows the locations of wastewater pits in New Mexico and the areas where groundwater was contaminated as a result of the pits.
The New Mexico oil and gas industry predicted in August 2008 that fewer drillers would sink wells in New Mexico, at least in part because of the new pit rule. Pro-industry (oil and gas) state representatives were concerned that new drilling techniques coupled with the pit rules could lead to an industry exodus from New Mexico, hoping that the Governor “would step in to help protect an important state revenue source.” But the state’s average rig count from June — when the pit rule took effect — through December 2008 was 7% higher than it was over the same period in the previous year. Development of oil and gas reserves is independent of such regulation. Read the FracTracker coverage of groundwater contamination in New Mexico, here!
Figure 3. Legacy map of cases where pits contaminated groundwater in New Mexico
View Map Fullscreen | How Our Maps Work
References & Resources
* In case you missed it, the 2014 report on wastewater pits can be found here (Grinberg, A. 2014). FracTracker’s previous coverage of the issue can be found here.
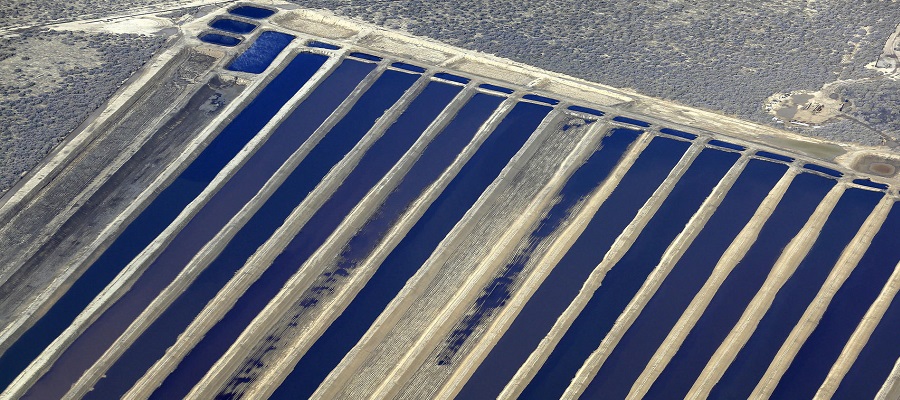
** Feature image of Central Valley oil field wastewater pits courtesy of Brian van der Brug | LA Times
- Grindberg, A. 2016. UPDATE ON OIL AND GAS WASTEWATER DISPOSAL IN CALIFORNIA: California Still Allowing Illegal Oil Industry Wastewater Dumping Clean Water Action. Accessed 2/15/16.
- Grinberg, A. 2014. In the Pits, Oil and Gas Wastewater Disposal into Open Unlined Pits and the Threat to California’s Water and Air. Clean Water Action. Accessed 12/5/14.
- NRDC. 2015. Groups File Notice of Intent to Sue EPA Over Dangerous Drilling and Fracking Waste. NRDC. Accessed 10/1/15.
- Heberger, M. Donnelly, K. 2015. Oil, Food, and Water: Challenges and Opportunities for California Agriculture. Pacific Institute. Accessed 2/1/16.
- Kuwayama et al. 2015. Pits versus Tanks: Risks and Mitigation Options for On-site Storage of Wastewater from Shale Gas and Tight Oil Development. Resources for the Future. Accessed 2/1/16.
- CVRWQCB. 2015. Cease and Desist Order R5-2015-0093. CVRWQCB. Accessed 2/1/16.
It ‘s really great to know.Thank you for sharing.
You mention: “But the state’s average rig count from June — when the pit rule took effect — through December 2008 was 7% higher than it was over the same period in the previous year. Development of oil and gas reserves is independent of such regulation.”
…but six months seems like far too short of a period to determine impact of the new regulation. Does your other coverage on the topic analyze data for the 1-2 year period following the June 2008 ruling? Thanks.
Hi Kevin,
You are absolutely right, 6 months is not a long time. In 2009 drill rigs and production did decrease in New Mexico, but this was a nationwide phenomenon. Since then New Mexico has continued to follow national trends of extraction activity. The U.S. is currently at the lowest levels of oil/gas production since the slump in 2009.
Thanks,
Kyle