The majority of FracTracker’s posts are generally considered articles. These may include analysis around data, embedded maps, summaries of partner collaborations, highlights of a publication or project, guest posts, etc.

Urban Drilling in Los Angeles

Impact of a 2,500′ Oil and Gas Well Setback in California

Why does California need setbacks?

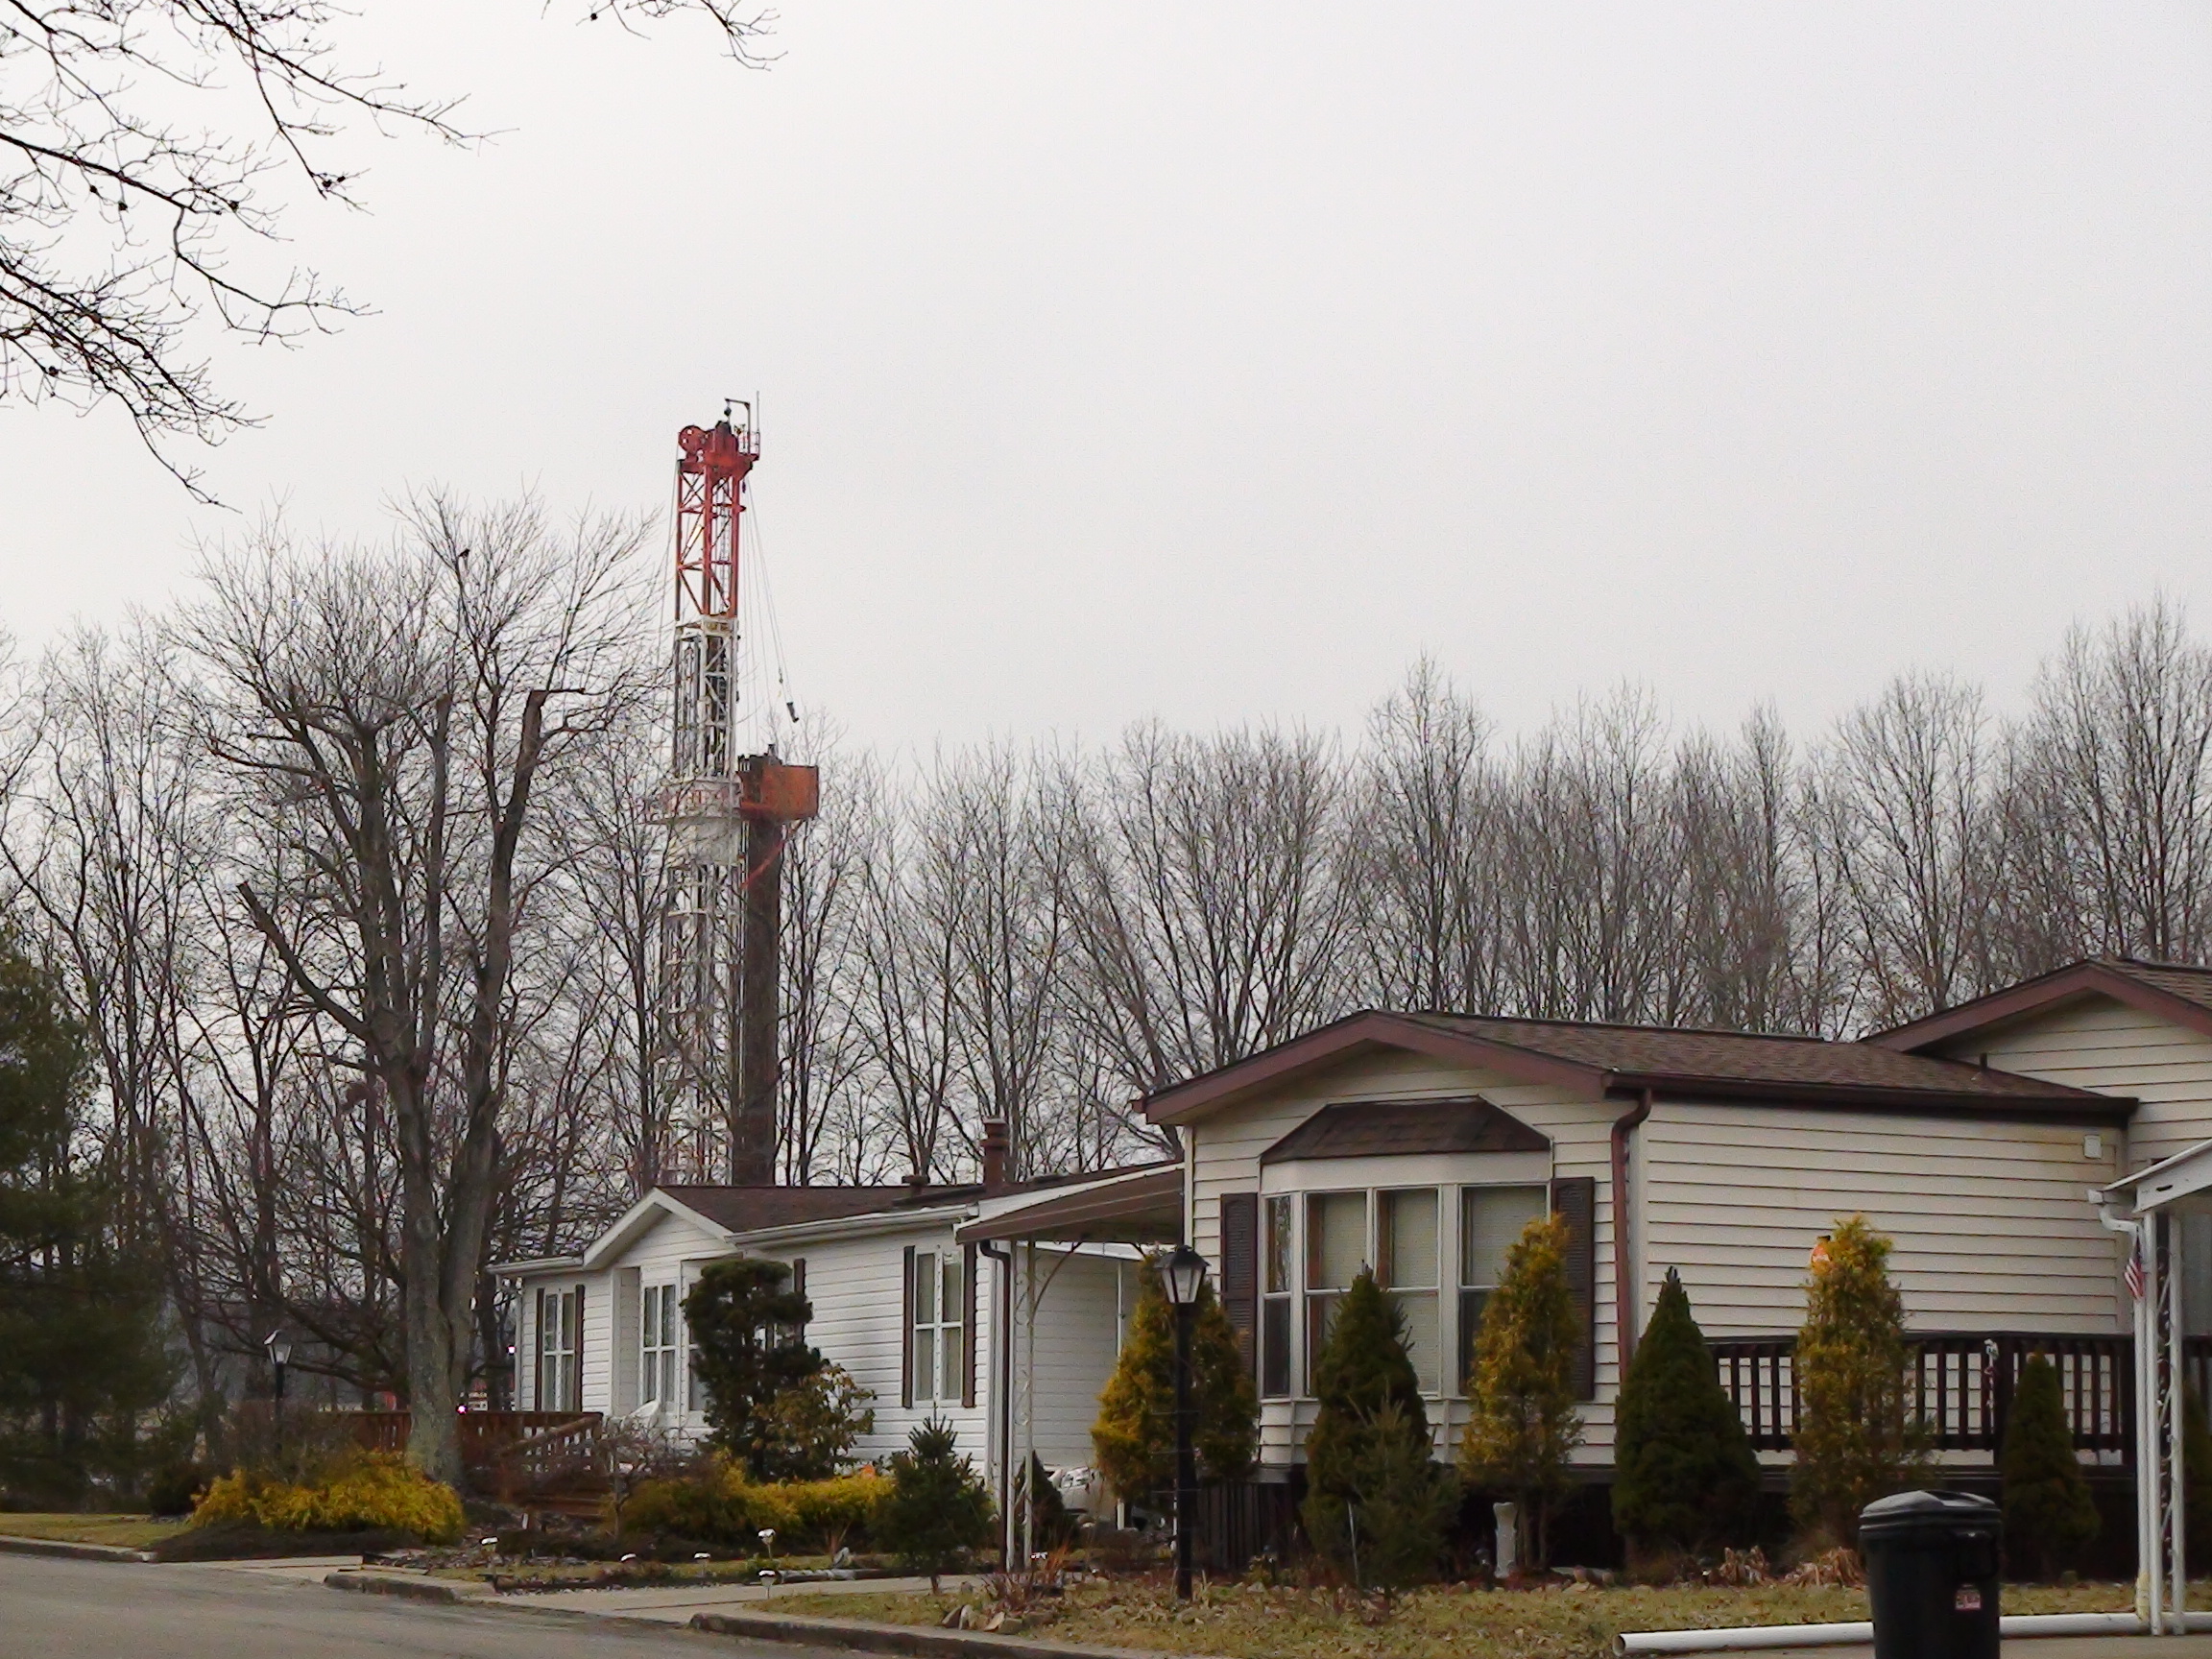
A new bill proposed by California State Assembly Member Al Muratsuchi (D), AB345, seeks to establish a minimum setback distance of 2,500′ between oil and gas wells and sensitive sites including occupied dwellings, schools, healthcare facilities, and playgrounds. A setback distance for oil and gas development is necessary from a public health standpoint, as the literature unequivocally shows that oil and gas wells and the associated infrastructure pose a significant risk to the communities that live near them.

FracTracker Alliance conducted a spatial analysis to understand the impact a 2,500’ well setback would have on oil and gas expansion in California. In a previous report, The Sky’s Limit California (Oil Change Internal, 2018), Fractracker data showed that 8,493 active or newly permitted oil and gas wells were located within a 2,500’ buffer of sensitive sites. At the time it was estimated that 850,000 Californians lived within the setback distance of at least one of these oil and gas wells.

This does not bode well for Californians, as a recently published FracTracker literature review found that health impacts resulting from living near oil and gas development include cancer, infant mortality, depression, pneumonia, asthma, skin-related hospitalizations, and other general health symptoms. Studies also showed that health impacts increased with the density of oil and gas development, suggesting that health impacts are dose dependent. Living closer to more oil and gas sites means you are exposed to more health-threatening contamination.

An established setback is therefore necessary to alleviate some of these health burdens carried by the most vulnerable Environmental Justice (EJ) communities. Health assessments by the Los Angeles County Department of Health and studies on ambient air quality near oil fields by Occidental College Researchers support the assumption that 2,500′ is the necessary distance to help alleviate the harsh conditions of degraded air quality. Living at a distance beyond 2,500′ from an oil and gas site does not mean you are not impacted by air and water contamination. Rather the concentrations of contaminants will be less harmful. In fact studies showed that health impacts increased with proximity to oil and gas, with associated impacts potentially experienced by communities living at distances up to 9.3 miles (Currie et al. 2017) and 10 miles (Whitworth et al. 2017).

Assembly Bill 345

This analysis assesses the potential impact of State Assembly member Al Muratsuchi’s Assembly Bill 345 on California’s oil and gas extraction and production. Specifically, AB345 establishes a minimum 2,500’ setback requirement for future oil and gas development. It does not however directly address existing oil and gas permits.

The bill includes the following stipulations and definitions:

  • All new oil and gas development, that is not on federal land, are required to be located at least 2,500′ from residences, schools, childcare facilities, playgrounds, hospitals, or health clinics.
  • In this case the redrilling of a previously plugged and abandoned oil or gas well or other rework operation is to be considered new oil and gas development.
  • “Oil and gas development” means exploration for and drilling production and processing of oil, gas or other gaseous and liquid hydrocarbons; the flowlines; and the treatment of waste associated with that exploration, drilling, production, and processing.
  • “Oil and gas development” also includes hydraulic fracturing and other stimulation activities.
  • “Rework operations” means operations performed in the well bore of an oil or gas well after the well is completed and equipped for production, done for the purpose of securing, restoring, or improving hydrocarbon production in the subsurface interval that is the open to production in the well bore.
  • The bill does not include routine repairs or well maintenance work.

Map

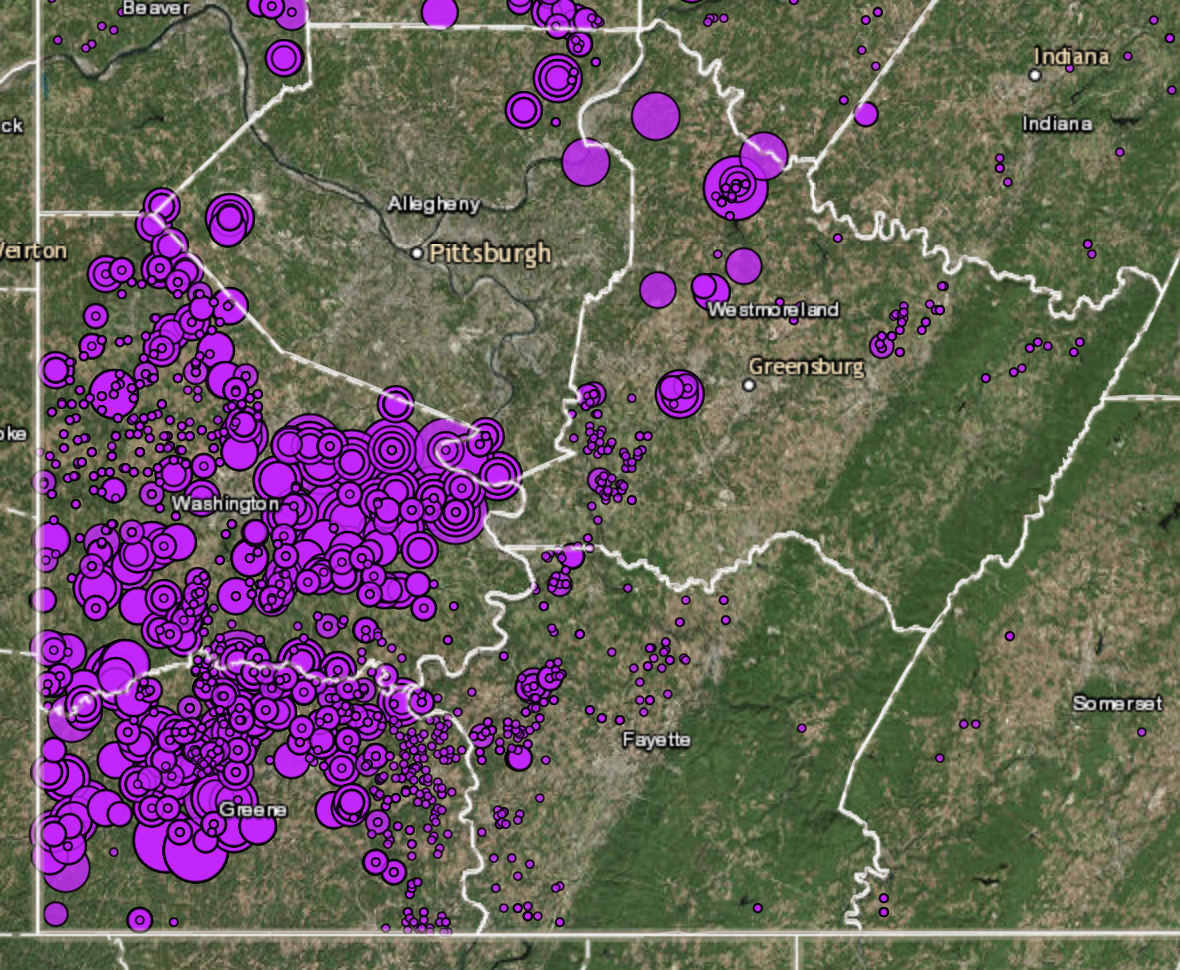
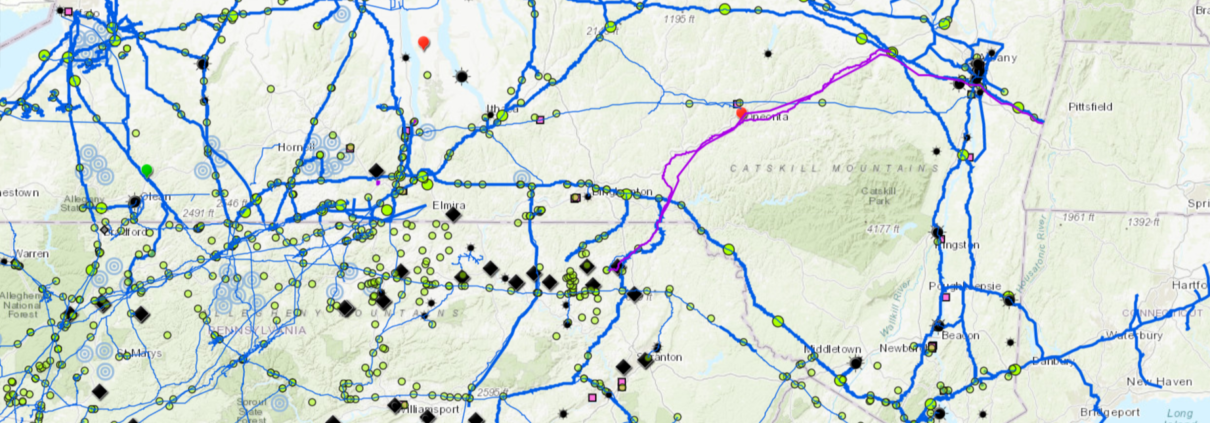
Figure 1. Map of Wells within a 2,500′ Setback Distance from Sensitive Receptor Sites. The map below shows the oil and gas wells and permits that fall within the 2,500′ setback distance from sensitive receptor sites.  Summaries of these well counts and discussions of these well types are included below as well.

Map of Wells within a 2,500′ Setback Distance from Sensitive Receptor Sites

View map fullscreen | How FracTracker maps work


Environmental Justice

The California Environmental Justice Alliance (CEJA) has just released their 2018 Environmental Justice Agency Assessment, which used FracTracker’s data and mapping to assess environmental equity in the state regulation of oil permitting and drilling. The report issued the Division of Oil, Gas, and Geothermal Resources (DOGGR) a failing grade of ‘F’. According to the report, “DOGGR is aware that the proposed locations of many drilling activities are in or near EJ communities, but approves permits irrespective of known health and safety risks associated with neighborhood drilling.”

FracTracker’s analysis of low income communities in Kern County shows the following:

  • There are 16,690 active oil and gas production wells located in census blocks with median household incomes of less than 80% of Kern’s area median income (AMI).
  • Therefore about 25% (16,690 out of 67,327 total) of Kern’s oil and gas wells are located within low-income communities.
  • Of these 16,690 wells, 5,364 of them are located within the 2,500′ setback distance from sensitive receptor sites such as schools and hospitals (32%) vs 13.1% for the rest of the state.

For more information on the breakdown of Kern County wells, see our informational table, here.

DOGGR wells

Using freshly published Division of Oil, Gas, and Geothermal Resources (DOGGR) data (6/3/19), we find that there are 9,835 active wells that fall within the 2,500’ setback distance, representing 13.1% of the total 74,775 active wells in the state.

There are 6,558 idle wells that fall within the 2,500’ setback distance, of nearly 30,000 total idle wells in the state. Putting these idle wells back online would be blocked if the wells require reworks to restart or ramp up production. For the most part operators do not intend for most idle wells to come back online. Rather operators are just avoiding the costs of plugging and properly abandoning the wells. To learn more about this issue, see our recent coverage of idle wells here.

Of the 3,783 permitted wells not yet in production, or “new wells,” 298 (7.8%) are located within the 2,500’ buffer zone.

Getting a count of plugged wells within the setback distance is more difficult because there is not a complete dataset, but there are over 30,000 wells in areas with active production that would be blocked from being redrilled. In total there are 122,209 plugged wells listed in the DOGGR database.

Permits

We also looked at permit applications that were approved in 2018, including permits for drilling new wells, well reworks, deepening wells and well sidetracks. This may be the most insightful of all the analyses.

Within the 2018 permit data, we find that 4,369 permits were approved. Of those 518 permits (about 12%) were granted within the proposed 2,500’ setback. Of the permits 25% were for new drilling, 73% were for reworks, and 2% were for deepening existing wells. By county, 42% were in Kern, 24% were in Los Angeles, 14% in Ventura, 6% in Santa Barbara, 3% in Fresno, and 2% or less in Glenn, Monterey, Sutter, San Joaquin, Colusa, Solano, Orange and Tehama, in descending order.

SCAQMD Notices

In LA, Rule 1148.2 requires operators to notify the South Coast Air Quality Management District (SCAQMD) of activities at well sites, including stimulations and reworks. These data points are reiterative of the “permits” discussed above, but the dataset is specific to the SCAQMD and includes additional activities. Of the 1,361 reports made to the air district since the beginning of 2018 through April 1, 2019; 634 (47%) were for wells that would be impacted by the setback distance; 412 incidences were for something other than “well maintenance” of which 348 were for gravel packing, 4 for matrix acidizing, and 65 were for well drilling. We are not sure where gravel packing falls, in reference to AB345.

A major consideration is that this rule may force many active wells into an idle status. If the onus of plugging wells falls on the state, these additional idle wells could be a major liability for the public. Fortunately AB1328 recently defined new idle well rules. The rules entice operators to plug and abandon idle wells. If rule 1328 is effective at reducing the stock of idle wells, these two bills could complement each other. (For more information on idle wells, read FracTracker’s recent analysis, here: https://www.fractracker.org/2019/04/idle-wells-are-a-major-risk/)

State Bill 4 Well Stimulation Reporting

We also analyzed data reported to DOGGR under the well stimulation requirements of CA State Bill 4 (SB4), the 2013 bill that set a framework for regulating hydraulic fracturing in California. Part of the bill required an independent scientific study to be conducted on oil and gas well stimulation, including acid well stimulation and hydraulic fracturing. Since 2016 operators have been required to secure special permits to stimulate wells, which includes hydraulic fracturing and several other techniques. To learn more about this state regulation read FracTracker’s coverage of SB4. From January 1, 2016 to April 1, 2019, there have been 576 well stimulation treatment permits granted under the SB4 regulations. Only 1 hydraulic fracturing event, permitted in Goleta, would have been impacted by a 2,500’ setback in 2018.

Support for AB345

After being approved by the CA Assembly Natural Resources Committee in a 7-6 vote, the bill did not make it up for a vote in the Senate Appropriations Committee during the 2019 legislative session.  The bill was described by the committee as “promising policies that need more time for discussion.” AB345 is now a two-year bill in the state Senate and will be reconsidered by the committee in January of 2020. The Chairperson of the Appropriations Committee, Lorena Gonzalez, indicated her general support for the policy and committed to working with the author to find a way to move the bill forward at the end of the session.

By Kyle Ferrar, Western Program Coordinator, FracTracker Alliance 

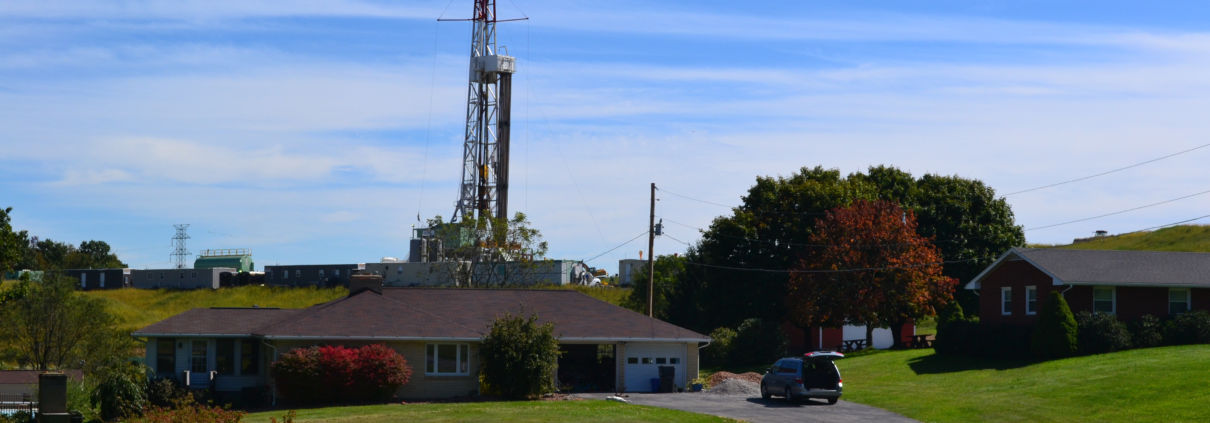
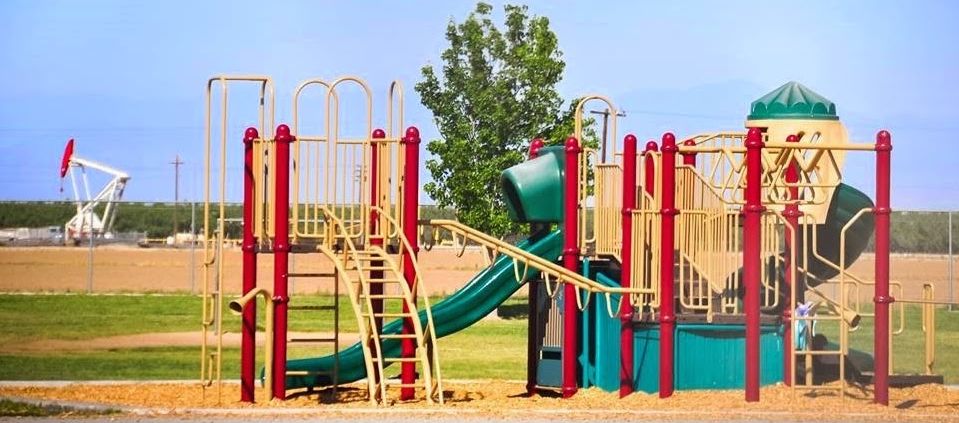
Feature image by David McNew, Getty Images

Pennsylvanians Demand a Response to Rare Cancer Cases, Other Health Impacts

New research on fracking health impacts, combined with unusually high rates of pediatric cancer, sound alarm bells in Pennsylvania

FracTracker isn’t the only one digging deeper into the health impacts of fracking in the past few months. Last week, the Better Path Coalition organized a meeting at the Capitol Building in Harrisburg, Pennsylvania, to share new research with government officials, the press, and the public. These groundbreaking reports highlight the increasing body of evidence showing fracking’s adverse health and climate impacts.

Following the presentations on emerging research, Ned Ketyer, M.D., F.A.A.P, discussed the highly concerning proliferation of rare pediatric cancer cases in southwestern Pennsylvania.

Dr. Ketyer drew data from a report released last month by the Pittsburgh Post Gazette, which uncovered an unusually high number of childhood cancer diagnoses in southwestern Pennsylvania over the last decade. In just four counties (Washington, Greene, Fayette and Westmoreland), there were 27 people diagnosed with Ewing sarcoma, a rare bone cancer, between 2008 and 2018. Six of the 27 people diagnosed were from the Canon-McMillan School District in Washington County, where there are currently 10 students district-wide with other types of cancers.

The expected number of Ewing sarcoma diagnoses over this time period and for the population count of southwestern Pennsylvania would be 0.75 cases per year, or roughly eight cases over the course of a decade. The higher number of rare childhood cancers was the subject of a recent community meeting held by the Southwest Pennsylvania Environmental Health Project (EHP), where residents called on the state to further investigate the issue and take immediate action to eliminate any potential environmental causes. For more of EHP’s resources on this topic, click here.

Cancer in the Marcellus

The Pennsylvania Department of Health investigated three of these cases in Washington County and found that they did not meet the criteria definition of a cancer cluster. Still, the unusually high number of rare cancers over a small geography is cause for alarm and reason to suspect an environmental cause.

This four-county area has a legacy of environmental health hazards associated with coal mining activities and is home to a 40-year old uranium disposal site that sits in close proximity to the Canon-McMillan High School. But with the increase in cancer diagnoses over the past decade, many are looking towards fracking in the Marcellus Shale, the more recent environmental hazard to develop in the region, as a contributing cause.

Southwestern Pennsylvania is a hot spot for fracking activity. In these four counties, there are 3,169 active, producing unconventional gas wells. There are also the infrastructure and activity associated with unconventional development: compressor stations, processing stations (including Pennsylvania’s largest cryogenic plant), disposal sites for radioactive waste, and heavy truck traffic.

The environmental and health risks of these facilities were the focus of the presentations and discussions with Pennsylvania leaders last week.

A map of unconventional gas production in southwest Pennsylvania. Click on the image to open the map.

View map fullscreen | How FracTracker maps work

Call for action

At the culmination of the Harrisburg meeting, participants delivered a letter to Governor Wolf’s office, calling for an investigation into the causes of these childhood cancer cases. Signed by over 900 environmental organizations and individuals, the letter also asks for a suspension of new shale gas permitting until the Department of Health can determine that there is no link between drilling and the cancer outcomes.

Governor Wolf’s response to Karen Feridun, the organizer of this campaign, was a disappointing dismissal of this public health crisis. Stating that the environmental regulations his office has implemented “protect Pennsylvanians from negative environmental and health impacts,” Governor Wolf went on to say that his office “will continue to monitor and study cancer incidents in this area, especially as more data becomes available,” but did not agree to suspend new permitting.

Wolf’s decision to continue with status quo permitting while waiting for more data to become available is unacceptable, and will lead to more Pennsylvanians suffering from the industry’s health impacts.

The Governor’s response is even more disheartening as it follows his recent support for a full ban on fracking activity in the Delaware River Basin (including eastern Pennsylvania). The Governor’s support for the ban is an acknowledgement of the industry’s risks, and leaves us frustrated that the southwestern part of the state is not receiving equal protection.

When is enough evidence enough?

The continued permitting of unconventional wells disregards the scientific evidence of drilling’s harms discussed in Harrisburg.

Sandra Steingraber, Ph.D, of Concerned Health Professionals of New York, discussed the results of the sixth edition of “The Compendium of Scientific, Medical, and Media Findings Demonstrating Risks and Harms of Fracking.” The Compendium outlines the health risks of fracking infrastructure from almost 1,500 peer-reviewed studies and governmental reports. Notably, the report outlines the inherent dangers of fracking and finds that regulations are incapable of protecting public health from the industry.

Erica Jackson discussed FracTracker Alliance’s recently published Categorical Review of Health Reports. This literature review analyzed 142 publications and reports on the health impacts of fracking, and found that 89% contained evidence of an adverse health outcome or health risk associated with proximity to unconventional oil and gas development.

Brian Schwartz, M.D., M.S., the Director of Geisinger Health Institute at the Johns Hopkins Bloomberg School of Public Health, presented epidemiological studies linking unconventional development to increased radon concentrations on homes and health impacts including adverse birth outcomes, mental health disorders, and asthma exacerbations.

Lorne Stockman, Senior Research Analyst with Oil Change International, discussed  “Burning the Gas ‘Bridge Fuel’ Myth,” a new report that further solidifies the irrationality of continued oil and gas development based on its climate impacts. The report shows that greenhouse gas emissions from fracking exceed climate goals, and how perpetuating the myth of natural gas as a “bridge” to renewables locks in emissions for decades.

A welcome ray of hope, this report also proves that renewables are an economically viable replacement to coal and gas, costing less than fossil fuels to build and operate in most markets. Furthermore, renewables combined with increasingly competitive battery storage ensures grid reliability.

“Burden of proof always belongs to the industry”

Among the inundation of data, statistics, and studies, Dr. Steingraber offered a sobering reminder of the purpose behind the meeting:

“Public health is about real people. When we collect data on public health problems, behind every data point, behind every black dot floating on a white mathematical space on a graph captured in a study, there are human lives behind those data points. And when those points each represent the life of a child or a teenager, what the dots represent is terror, unimaginable suffering, followed by death, or terror, unimaginable suffering, followed by a life of trauma, pathology reports, bone scans, medical bills, side effects, and uncertainty that all together are known as cancer survival.”

An adolescent cancer survivor herself, Dr. Steingraber clearly articulated the ethical responsibility our elected officials have to hold industry accountable for its impacts:

“Burden of proof always belongs to the industry, and benefit of the doubt always belongs to the child. It’s wrong to treat children like lab rats and experiment on them until the body count becomes so high that it reaches all the levels of statistical significance that tells you that we have a real problem here.”

The evidence is in – we know enough to justify an end to fracking based on its health and climate impacts. It’s time for Pennsylvania’s industry and leaders to stop experimenting with residents’ health and take immediate action to prevent more suffering.

By Erica Jackson, Community Outreach and Communications Specialist, FracTracker Alliance

Production and Location Trends in PA: A Moving Target

The FracTracker Alliance tends to look mostly at the impacts of drilling, from violations affecting surface and ground water to forest fragmentation to neighbors breathing diesel exhaust near disposal wells.  We also try to give residents tools to help predict where future activity will occur, but as this article details, such predictive tools can do little more than trail moving targets. To that end, we have taken a look into areas where gas production is high for unconventional wells in the state, which are likely sites of future development.

The Pennsylvania Department of Environmental Protection’s (DEP) Production Report is self-reported by the various operators active in the state. Unconventional wells generate a large quantity of natural gas, measured in thousands of cubic feet (Mcf), as well as limited amounts of oil and condensate, both of which are measured in 42 gallon barrels. In this analysis, we are only considering the gas production.

Click here for full screen map. 

In the map above, you can click on any well to learn more about the production values, along with a variety of other information including the well’s formation and age.  The age was calculated by counting days from the spud date to the end of the report cycle, March 31, 2019.


Top Average Gas Production by County – April 2018 to March 2019

CountyProducing Wells Avg. Production (Mcf) Production Rank Avg. Age of Producing WellsAge Rank
Wyoming 2511,269,15615 Yr / 10 Mo / 4 Days12
Sullivan1281,087,86825 Yr / 2 Mo/ 24 Days8
Allegheny1171,075,01834 yr/ 2 Mo / 7 Days2
Susquehanna1,4291,066,73445 Yr / 6 Mo / 22 Days10
Greene1,131796,75555 yr / 10 Mo / 28 Days13
Figure 1 – This table shows the top five counties in Pennsylvania for per-well unconventional gas production. The final column shows the county ranking for the average age of wells, from youngest to oldest

We can also see this data summarized by county, where average production and age values are available on a county by county basis (see Figure 1). Hydrocarbon wells are known to decrease production steeply over time, a phenomenon known as the decline curve, so it is not surprising to see a relatively young inventory of wells represented in the list of top five counties with per-well gas production. Age is not the only factor in production values, however, as certain geographies simply contain more accessible gas resources than others.


Figure 2 – 12 month gas production and age of well. Production is usually much higher during the earliest phases of the well’s production life.  This does not include wells that have been plugged or taken out of production.  Click on image for full-sized view.

In Figure 2, we look at the production of all unconventional wells in the state, expecting to see the highest production in younger wells. This mostly appears to be the case, but as mentioned above, there are also hot and cold spots with respect to production. A notable variable in this consideration is producing formation.

Since 93% (8,730 out of 9,404) of unconventional wells reporting gas production are in the Marcellus Shale Formation, the traditional hot spots in the northeastern and southwestern portions of the state heavily skew the overall totals in terms of both production and number of wells.  Other formations of note include the Onodaga Limestone (137 wells, 1.5% of total), Burket Member (117 wells, 1.2%), Genesee Formation (104 wells, 1.1%), and the Utica Shale (99 wells, 1.1%) (Figure 3).

Figure 3 – Unconventional gas production over 12 months, showing formation. Click on image for full-sized view.

Drillers have been exploring some of these formations for decades. In fact, the oldest producing well that is currently classified as unconventional was 13,435 days old as of March 31, which works out to 36 years, 9 months, and 12 days.

However, this is fairly rare – only 384 (4%) of the 9,404 producing wells were more than 10 years old. 5,981 wells (64%) are between 5 and 10 years old, with the remaining 3,039 wells (32%) younger than 5 years old.

This does not take into account wells of any age that have been plugged or otherwise taken out of production.

Age of Pennsylvania’s active wells

< 5 years old
5-10 years old
> 10 years old


Utica Shale

The Utica Shale is worth a special mention here for a couple of reasons.  First, we must acknowledge its prominence in neighboring Ohio, which has 2,160 permitted Utica wells to go with just 40 permitted Marcellus wells, the prevalence of the two plays seems to invert just as one passes over the state line. And yet, the most productive Utica wells are near the border with New York, not Ohio.

In fact, each of the top 11 producing Utica wells during the 12 month period were located in Tioga County.  It’s worth noting that these are all between one and two years old, which would have given the wells time to be drilled, fracked, and brought into production, while still being in the prime of their production life. Compared to the Marcellus, sample size quickly becomes an issue when analyzing the Utica in Pennsylvania (Figure 4).

Figure 4 – Producing Utica wells in Pennsylvania. Note that the cluster of heavily producing wells in Tioga and Potter Counties near the New York border are mostly young wells where higher production would be expected.  Click on image for full sized view.

Second, portions of the Utica are known for their wet gas content, meaning that the gas has significant quantities of natural gas liquids (NGLs) including ethane, propane, and butane, which are gaseous at ambient temperatures but typically condensed into liquid form by oil and gas companies.  These are used for specialized fuels and petrochemical feedstocks, and are therefore more valuable than the methane in natural gas.

The production report does not capture the amount of NGLs in the gas, but a map from the Energy Information Administration shows the entire play, noting that the composition is dryer on the eastern portions of the play. In fact, a wet gas composition along the Ohio border might help to explain continued interest in what are otherwise well below average gas production results for Pennsylvania.

A Moving Target

It is difficult to predict where the industry will focus its attention in the coming months and years, but taking a look at production and formation data can give us a few clues.  Obviously, operators who found a particularly productive pocket of hydrocarbons are likely to keep drilling more holes in the ground in those areas until production is no longer profitable. Therefore, impacts to water, air, and nearby residents can be expected to continue in heavily drilled areas largely because the production level makes it attractive for drillers.

On the other hand, we should not assume that areas that are currently not productive are off the table for future consideration, either. Different formations are productive in different geographies, so a sweet spot for the Marcellus might be a dud in the Utica, or vice versa.

Finally, when comparing production, we must always take the age of the well into consideration, as all oil and gas wells can be expected to start off with a short period of very high production, followed by years of ever-diminishing returns throughout the expected 10 to 11 year lifecycle of the well. Because of this, what seems like a hotspot now may look below average in a similar analysis in three to four years, particularly in formations with relatively light drilling activity. This means that the top list of production by well could change over time, so be sure to check back in with FracTracker to see how events unfold.

By Matt Kelso, Manager of Data and Technology, FracTracker Alliance


Who Pays? Health and Economic Impacts of Fracking in Pennsylvania

Since the advent of unconventional shale gas drilling, some effects have been immediate, some have emerged over time, and some are just becoming apparent. Two reports recently published by the Delaware Riverkeeper Network advance our understanding of the breadth of the impacts of fracking in Pennsylvania. The first report, written by FracTracker, reviews research on the ways fracking impacts the health of Pennsylvanians. The second report by ECONorthwest calculates the economic costs of the industry.

“Fracking is heavily impacting Pennsylvania in multiple ways but the burden is not being fairly and openly calculated. These reports reveal the health effects and economic costs of fracking and the astounding burdens people and communities are carrying,” said Maya van Rossum, the Delaware Riverkeeper.

Learn what the latest science and analysis tells us about the costs of fracking, who is paying now, and what the future price is forecasted to be.

Access the full reports here:


Health Impact Report

“Categorical Review of Health Reports on Unconventional Oil and Gas Development; Impacts in Pennsylvania,”  FracTracker Alliance, 2019 Issue Paper

Economic Impact Report

“The Economic Costs of Fracking in Pennsylvania,” ECONorthwest, 2019 Issue Paper


From the Experts

“The FracTracker Alliance conducted a review of the literature studying the impact of unconventional oil and gas on health. Findings of this review show a dramatic increase in the breadth and volume of literature published since 2016, with 89% of the literature reporting that drilling proximity has human health effects. Pennsylvanian communities were the most studied sample populations with 49% of reviewed journal articles focused on Marcellus Shale development. These studies showed health impacts including cancer, infant mortality, depression, pneumonia, asthma, skin-related hospitalizations, and other general health symptoms were correlated with living near unconventional oil and gas development for Pennsylvania and other frontline communities.”

Kyle Ferrar, FracTracker Alliance Western Program Coordinator


Rig and house. Westwood Lake Park. Photo by J Williams, 2013.

“Fracking wells have an extensive presence across Pennsylvania’s landscape – 20 percent of residents live within 2 miles of a well. This is close enough to cause adverse health outcomes. Collectively we found annual costs of current fracking activity over $1 billion, with cumulative costs given continued fracking activity over the next 20 years of over $50 billion in net present value for the effects that we can monetize. The regional economic benefits also seem to be less than stated, as the long-term benefits for local economies are quite low, and can disrupt more sustainable and beneficial economic trajectories that might not be available after a community has embraced fracking.”

Mark Buckley, Senior Economist at the natural resource practice at
ECONorthwest


These reports on the health effects and economic impacts of unconventional oil and natural gas development yield disheartening results. There are risks of extremely serious health issues for families in impacted areas, and the long term economic returns for communities are negative.

Arming ourselves with knowledge is an important first step towards the renewable energy transformation that is so clearly needed. The stakes are too high to allow the oil and natural gas industries to dictate the physical, social, and economic health of Pennsylvanians.

The Hidden Costs of a Plastic Planet

Plastic has been getting a lot of negative press lately.

It’s killing marine life, forming vortexes in the ocean, and being burned instead of recycled. But until recently, most of the attention has focused on plastic pollution – the waste that turns up after a product has served its purpose.

Now that’s changed- the Center for International Environmental Law (CIEL) has recently released “Hidden Costs of a Plastic Planet;” two reports that show us the consequences of plastic across its entire lifecycle. The first, Plastic & Health, explores human health impacts, while the second Plastic & Climate, tackles greenhouse gas emissions.

For the first time, we know the full scope of plastic’s impact – and it’s not looking good.

FracTracker is proud to partner with CIEL and several other organizations, including Earthworks, 5 Gyres, TEJAS, UPSTREAM, GAIA, Exeter University, and Environmental Integrity Project to release these reports.

Access the full reports and executives summaries here:


You know, now what?

These reports make it clear: the impacts of plastic are serious, and they’re everywhere. We have the evidence to justify an immediate global move away from our disposable, single-use lifestyle. Tackling this toxic crisis will require action across all levels of society- corporations must consider the full life cycle of their products, policy makers must enact plastic reduction measures, and of course, industry needs to rectify its toxic impacts. Eager to encourage these entities to take action, the FracTracker team is committed to doing our own part to solve this plastics problem, and we hope that it inspires individuals, companies, community leaders, and politicians to join in.

Here’s what we’re doing to help the world #BreakFreeFromPlastic:

1. Continue working towards a world free from oil and gas.

Since over 99% of plastic is made from oil and gas, keeping fossil fuels in the ground is the only way to eliminate all of plastic’s toxic impacts. Plastic & Climate found that extracting and transporting oil and gas for plastic production releases over 100 million metric tons of carbon dioxide equivalents per year. There are many opportunities for these releases to occur, including from methane leakage and flaring, the drilling process, deforestation of forests for pipelines and well pads, and emissions from truck traffic.

Pipeline construction causes deforestation, releasing carbon stored in trees and preventing further carbon sequestration

The FracTracker team will continue to study, map, and analyze the risks of this industry to encourage both a switch to renewable energy and a movement away from plastic production.

2. Expose the risks of the fracking-driven plastics boom in the Gulf Coast & Ohio River Valley

Unconventional technology has opened up access to large reserves of natural gas liquids, such as ethane, and plastic manufacturing is one way to increase demand for this glut. In fact, the oil and gas industry is hoping to increase demand for plastic worldwide by 40%! Two regions with access to natural gas liquids that are rapidly expanding plastics manufacturing capacity are the Gulf Coast and the Ohio River Valley.

Eager to justify this build-out, politicians and industries tout the ways plastic is part of a sustainable future. They say that without investing in plastic, we’re not taking full advantage of our resources, and that by using natural gas to make plastic instead of burning it, we’re keeping greenhouse gasses from entering the atmosphere. Speaking on manufacturing plastic from natural gas with public radio station WHYY, Pennsylvania’s Governor Wolf stated:

“I want to move to a point where what we’re using the gas for is for products that go into that sustainable energy future: lightweight products…so that we’re not burning this, we’re actually creating products that would make that energy future that we all want, that would address the issues of climate change in an effective way.”

The Shell Ethane Cracker in Pennsylvania is projected to produce 1.6 million tons of plastic per year, which Governor Wolf states is part of a “sustainable energy future.” Photo by Ted Auch, aerial assistance by LightHawk.

But the data say otherwise.

Plastic does not address the issues of climate change. In fact, using natural gas for plastic perpetuates climate change. Climate & Plastics found that this year, “the production and incineration of plastic will add more than 850 million metric tons of greenhouse gases to the atmosphere—equal to the emissions from 136 one-thousand-megawatt coal power plants.” If plastic production grows as currently predicted, by 2030, emissions could reach 1.34 gigatons per year, or 291 new coal plants.

The rate of plastic production is directly at odds with global carbon emissions targets.

While plastic can be used for lightweight parts of electric vehicles or reusable materials, the plastic being produced by the current build out is primarily polyethylene plastic, most commonly used for packaging and single use products- plastic bags, bottles, jugs, containers, and plastic films and linings; products that countries and cities are phasing out.

3. Encourage plastic alternatives

While renewable energy is becoming increasingly available, so too are plastic alternatives. Across the world, communities are rethinking the products we use everyday. Thanks to historic legislation, zero waste stores,  and towns, and plastic-free bloggers, it’s never been a better time to cut back on plastic – and the FracTracker team is doing our part.

Rebecca, our Administrative and Human Resources Specialist, has cut her plastic use by switching to toothpaste tablets and bars of soap. Karen, our Eastern Program Coordinator, makes her own reusable beeswax food wraps. And Erica Jackson and Isabelle Weber in the Pittsburgh office keep reusable utensils in their backpacks. The whole team is cutting back on single-use plastic products, and are always on the look-out for non oil and gas-based products.

We also realize that with companies like Coca Cola selling 3,000 plastic bottles every second, and Nestlé  producing 1.7 million tons of plastic packaging a year, corporations play a key role in this movement.

Through the Story of Stuff’s #Messageinabottle project and Greenpeace’s #Isthisyours campaign, we’re also encouraging corporations to reimagine how the package and transport products.

Now YOU know, what will you do to help your company, community, or yourself #BreakFreeFromPlastic?

The Falcon Public Monitoring Project

Part of the Falcon Public EIA Project

In March of 2019, two and a half years after Shell Pipeline Co. announced plans for the Falcon Ethane Pipeline System, the imported pipes arrived at the Port of Philadelphia. As tree clearing and construction begins, we share frustration with residents that the project is underway while many of our concerns remain unaddressed.

Between 2010 and 2018, over 280 pipeline incidents were reported in Ohio, West Virginia, and Pennsylvania (the three states the Falcon crosses). Of those incidents, 70 were fires and/or explosions. As regulatory agencies and operators fail to protect the public, communities are taking the reins.

Residents of southwest PA gather along the Falcon route

Environmental organizations are training the public to spot construction violations and appealing inadequate pipeline permits. Impacted residents are running for office, testifying in court, and even spending time in prison to protect their communities.

These grassroots efforts are contributing to a shift in public perception about the safety and need of pipelines. In some cases, including with the Northeast Energy Direct Pipeline and the Constitution Pipeline, organizing efforts are helping stop projects before they begin.

We invite all residents along the Falcon route to get involved in ongoing efforts to monitor construction. Below, you’ll find a guide to reporting violations as well as high-risk areas along the Falcon route that require close monitoring.

Be a citizen watchdog

Taking photos of pipeline development and recording your observations is a great way to monitor impacts. One tool to use while monitoring is the FracTracker mobile app (search “FracTracker” in the App Store or Google Play to download for free). The app allows the public to submit geolocated photos and descriptions of development, such as pipelines and wells, and concerns, such as spills and noise pollution. These reports help FracTracker crowdsource data and alert us to concerns that need follow up action. The app also contains a map of wells, pipelines, and compressor stations, including the Falcon pipeline route for reference in the field.

Click on the images below to view app reports of Falcon construction.

Documenting violations

During the construction phase, incidents often occur when companies cause erosion of the ground and release sediment, equipment, or discharge into waterways. Mountain Watershed Association and Clean Air Council have provided the following information on the process of looking for and documenting violations.

Step 1) Document baseline conditions. Documenting the pre-construction status of an area is crucial for understanding how it’s been impacted down the road. Document baseline conditions by taking photos, videos, and notes at different sites, and include the location and date on these materials (the Fractracker app does this for you automatically). Observing sites at different times and in different weather (such as during or after a storm) will give you the best data.

Step 2) Know what to look for. Below are images and descriptions of common construction violations.

Filtration Failure

Drilling fluid spill

For more violations, checkout Pipeline CSI’s list of Top Ten Observable Non-Compliance Issues.

3) File a Report. File an official complaint to your state environmental regulatory agency.

Your concerns can be sent to regulatory agencies using the following contact information:

4) Contact support organizations. There are several organizations ready to take action once violations have been confirmed. For confirmed violations in Beaver County, PA, contact Alex Bomstein, at the Clean Air Council (215-567-4004 x118) and for confirmed violations in Allegheny or Washington Counties, PA, contact Melissa Marshall at the Mountain Watershed Association (724-455-4200 x7#). For violations in Ohio or West Virginia, reach out to FracTracker (412-802-0273).

Reports made on the FracTracker App are shared with any app user and the FracTracker team, who look through the reports and contact users for any required follow up. App reports can also be submitted to regulatory agencies electronically. Simply visit the web version of the app, click on your report, and copy the URL (web address) of your report. Then “paste” it into the body of an email or online complaint form. The receiver will see the exact location, date, and any notes or photos you included in the report.

Where should you be monitoring?

Monitoring efforts must be limited to publicly accessible land. In general, areas that are most at-risk for environmental impact include stream and wetland crossings, steep slopes (particularly those near water crossings), flood-prone zones, and areas where storm water runoff will reach waterways. View a map of the Falcon’s water crossings here, and continue reading for more vulnerable locations to monitor.

The information below identifies high-risk areas along the pipeline route where monitoring efforts are extra necessary due to their impacts on drinking water, wetlands, undermined areas, and vulnerable species.

Drinking Water

We found 240 private water wells within 1/4 mile of the Falcon.

While all of these wells should be assessed for their level of risk with pipeline construction, the subset of wells nearest to horizontal directional drilling (HDD) sites deserve particular attention. HDD is a way of constructing a pipeline that doesn’t involve digging a trench. Instead, a directional drilling machine is used to drill horizontally underground and the pipe is pulled through.

While an HDD is designed to avoid surface impacts, if rushed or poorly executed, it can damage surface water, groundwater, and private property. The Mariner East 2 pipeline construction left several families without water after construction crews punctured an aquifer at an HDD site.

Shell’s data highlights 24 wells that are within 1,000 feet of a proposed HDD site.

We’ve isolated the groundwater wells and HDDs in a standalone map for closer inspection below. The 24 most at-risk wells are circled in blue.

View Map Fullscreen | How FracTracker Maps Work

Testing your groundwater quality before construction begins is crucial for determining impacts later on. Two upcoming workshops in Washington County, PA and another in Beaver County, PA will discuss how to protect your water and property.

The Falcon’s HDD locations offer disturbing similarities to what caused the Mariner East pipeline spills. Many of Sunoco’s failures were due to inadequately conducted (or absent) geophysical surveys that failed to identify shallow groundwater tables, which then led to drilling mud entering streams and groundwater.

Figure 1 below shows Greene Township, Beaver County, just south of Hookstown, where the “water table depth” is shown. The groundwater at this HDD site averages 20ft on its western side and only 8ft deep on the eastern side.

Figure 1. Water table depth in Greene Township

Water Reservoirs

The Falcon also crosses the headwaters of two drinking water reservoirs: the Tappan Reservoir in Harrison County, OH (Figure 2) and the Ambridge Reservoir in Beaver County, PA (Figure 3).  The Falcon will also cross the raw water line leading out of the Ambridge Reservoir.

The Ambridge Reservoir supplies water to five townships in Beaver County (Ambridge, Baden, Economy, Harmony, and New Sewickley) and four townships in Allegheny County (Leet, Leetsdale, Bell Acres & Edgeworth). The Tappan Reservoir is the primary drinking water source for residents in Scio.

Figure 2. Tappan Reservoir and the Falcon route in Harrison County, Ohio

Figure 3. Ambridge Reservoir and the Falcon route in Beaver County, Pennsylvania

Wetlands

Wetlands that drain into Raccoon Creek in Beaver County, PA will be particularly vulnerable in 2 locations. The first is in Potter Township, off of Raccoon Creek Rd just south of Frankfort Rd, where the Falcon will run along a wooded ridge populated by half a dozen perennial and intermittent streams that lead directly to a wetland, seen in Figure 4. Complicating erosion control further, Shell’s survey data shows that this ridge is susceptible to landslides. This area is also characterized by the USGS as having a “high hazard” area for soil erosion.

Figure 4. Wetlands and streams in Potter Township, PA

The other wetland area of concern along Raccoon Creek is found in Independence Township at the Beaver County Conservation District (Figure 5). Here, the Falcon will go under the Creek using HDD (highlighted in bright green). Nevertheless, the workspace needed to execute the crossing is within the designated wetland itself. An additional 15 acres of wetland lie only 300ft east of the crossing but are not accounted for in Shell’s data. This unidentified wetland is called Independence Marsh, considered the crown jewel of the Independence Conservancy’s watershed stewardship program.

Figure 5. Wetlands and Raccoon Creek in Independence Township, PA

Subsurface concerns

Shell’s analysis shows that 16.8 miles of the Falcon pipeline travel through land that historically has or currently contains coal mines. Our analysis using the same dataset suggests the figure is closer to 20 miles. Construction through undermined areas poses a risk for ground and surface water contamination and subsidence. 

Of these 20 miles of undermined pipeline, 5.6 miles run through active coal mines and are located in Cadiz Township, OH (Harrison Mining Co. Nelms Mine, seen in Figure 6); Ross Township, OH (Rosebud Mining Co. Deep Mine 10); and in Greene Township, PA (Rosebud Mining Co. Beaver Valley Mine). 

Figure 6. Coal mines and are located in Cadiz Township, OH

For a complete map of mined areas, click here.

More than 25 of the Falcon’s 97 pipeline miles will be laid within karst landscapes, including 9 HDD sites. Karst is characterized by soluble rocks such as limestone prone to sinkholes and underground caves. A cluster of these are located in Allegheny and Washington counties, PA, with extensive historical surface mining operations.

The combination of karst and coal mines along Potato Garden Run, in Figure 7, make this portion of the pipeline route particularly risky. At this HDD site, the Falcon will cross a coal waste site identified in the permits as “Imperial Land Coal Slurry” along with a large wetland.

Figure 7. Coal mines in Imperial, Pennsylvania

Vulnerable species

Southern Redbelly Dace

The Southern Redbelly Dace, a threatened species, is especially vulnerable to physical and chemical (turbidity, temperature) changes to their environment. PA Fish and Boat Commission explicitly notes in their correspondence with Shell that “we are concerned about potential impacts to the fish, eggs and the hatching fry from any in-stream work.” Of note is that these sites of concern are located in designated “High Quality/Cold Water Fishes” streams of the Service Creek watershed (Figure 8). PFBC stated that that no in-stream work in these locations should be done between May 1 and July 31.

Figure 8. “High Quality/Cold Water Fishes” streams identified as habitat for the Southern Redbelly Dace

Northern Harriers & Short-Eared Owls

Portions of the Falcon’s workspace are located near 6 areas with known occurrences of Short-eared Owls (PA endangered species) and Northern Harriers (PA threatened species). Pennsylvania Game Commission requested a study of these areas to identify breeding and nesting locations, which were executed from April-July 2016 within a 1,000-foot buffer of the pipeline’s workspace (limited to land cover areas consisting of meadows and pasture). One Short-eared Owl observation and 67 Northern Harrier observations were recorded during the study. PGC’s determined that, “based on the unusually high number of observations at these locations” work should not be done in these areas during harrier breeding season, April 15 through August 31.

Figure 9. Surveyed areas for Short-eared Owls (PA endangered species) and Northern Harriers (PA threatened species)

Bald Eagles

A known Bald Eagle nest is located in Beaver County. Two potential “alternate nests” are located where the Falcon crosses the Ohio River. National Bald Eagle Management Guidelines bar habitat disturbances that may interfere with the ability of eagles to breed, nest, roost, and forage. The 1 active nest in close proximity to the Falcon, called the Montgomery Dam Nest, is located just west of the pipeline’s terminus at Shell’s ethane cracker facility.

U.S. Fish and Wildlife Service requested that Shell only implement setback buffers for the one active nest at Montgomery Dam (Figure 10). These include no tree clearing within 330 feet, no visible disturbances with 660 feet, and no excessive noise with 1,000 feet of an active nest. Furthermore, Shell must avoid all activities within 660ft of the nest from January 1st to July 31st that may disturb the eagles, including but not limited to “construction, excavation, use of heavy equipment, use of loud equipment or machinery, vegetation clearing, earth disturbance, planting, and landscaping.

Figure 10. Bald Eagle nest in Potter Township, Pennsylvania

Bats

The Falcon is located within the range of federally protected Indiana Bats and Northern Long-eared Bats in Pennsylvania and West Virginia. In pre-construction surveys, 17 Northern Long-eared Bats were found at 13 of the survey sites, but no Indiana Bats were captured.

A total of 9 Northern Long-eared Bat roost trees were located, with the nearest roost tree located 318 feet from the pipeline’s workspace. Figure 11 below shows a cluster of roost trees in Raccoon Township, PA. For a map of all the roost trees, click here. The U.S. Fish and Wildlife Service stated that “Due to the presence of several Northern Long-eared Bat roost trees within the vicinity of the project footprint (although outside of the 150-foot buffer), we recommend the following voluntary conservation measure: No tree removal between June 1 and July 31.”

The Pennsylvania Game Commission noted in early correspondences that Silver-haired Bats may be in the region (a PA species of special concern). PGC did not require a further study for the species, but did request a more restrictive conservation of no tree clearing between April 1 and October 31.

Figure 11. Northern long-eared bat roost trees in Raccoon Township, Pennsylvania

For more information on the wildlife impacts of the Falcon Pipeline, click here.

***

To continue reading about this pipeline, visit the Falcon Public EIA Project. 

By documenting the impacts of the Falcon Pipeline, you’re contributing to a growing body of work that shows the risks of fossil fuel pipelines. Not only does this evidence protect drinking water and vulnerable species, it serves as evidence against an inherently dangerous project that will contribute to climate change and the global plastics crisis.

We hope you’re inspired to take action and add your voice to a growing team in the region committed to safer and healthier environments. Thank YOU for your dedication to the cause!

By Erica Jackson, Community Outreach and Communications Specialist, FracTracker Alliance.

Portions of this article were adapted from previous posts in the Falcon Public EIA Project, written by Kirk Jalbert.

Release: The 2019 You Are Here map launches, showing New York’s hurdles to climate leadership

For Immediate Release

Contact: Lee Ziesche, lee@saneenergyproject.org, 954-415-6282

Interactive Map Shows Expansion of Fracked Gas Infrastructure in New York State

And showcases powerful community resistance to it

New York, NY – A little over a year after 55 New Yorkers were arrested outside of Governor Cuomo’s door calling on him to be a true climate leader and halt the expansion of fracked gas infrastructure in New York State, grassroots advocates Sane Energy Project re-launched the You Are Here (YAH) map, an interactive map that shows an expanding system of fracked infrastructure approved by the Governor.

“When Governor Cuomo announced New York’s climate goals in early 2019, it’s clear there is no room for more extractive energy, like fossil fuels.” said Kim Fraczek, Director of Sane Energy Project, “Yet, I look at the You Are Here Map, and I see a web of fracked gas pipelines and power plants trapping communities, poisoning our water, and contributing to climate change.”

Sane Energy originally launched the YAH map in 2014 on the eve of the historic People’s Climate March, and since then, has been working with communities that resist fracked gas infrastructure to update the map and tell their stories.

“If you read the paper, you might think Governor Cuomo is a climate leader, but one look at the YAH Map and you know that isn’t true. Communities across the state are living with the risks of Governor Cuomo’s unprecedented buildout of fracked gas infrastructure,” said Courtney Williams, a mother of two young children living within 400 feet of the AIM fracked gas pipeline. “The Governor has done nothing to address the risks posed by the “Algonquin” Pipeline running under Indian Point Nuclear Power Plant. That is the center of a bullseye that puts 20 million people in danger.”

Fracked gas infrastructure poses many of the same health risks as fracking and the YAH map exposes a major hypocrisy when it comes to Governor Cuomo’s environmental credentials. The Governor has promised a Green New Deal for New York, but climate science has found the expansion of fracking and fracked gas infrastructure is increasing greenhouse gas emissions in the United States.

“The YAH map has been an invaluable organizing tool. The mothers I work with see the map and instantly understand how they are connected across geography and they feel less alone. This solidarity among mothers is how we build our power ,” said Lisa Marshall who began organizing with Mothers Out Front to oppose the expansion of the Dominion fracked gas pipeline in the Southern Tier and a compressor station built near her home in Horseheads, New York. “One look at the map and it’s obvious that Governor Cuomo hasn’t done enough to preserve a livable climate for our children.”

“Community resistance beat fracking and the Constitution Pipeline in our area,” said Kate O’Donnell  of Concerned Citizens of Oneonta and Compressor Free Franklin. “Yet smaller, lesser known infrastructure like bomb trucks and a proposed gas decompressor station and 25 % increase in gas supply still threaten our communities.”

The YAH map was built in partnership with FracTracker, a non-profit that shares maps, images, data, and analysis related to the oil and gas industry hoping that a better informed public will be able to make better informed decisions regarding the world’s energy future.

“It has been a privilege to collaborate with Sane Energy Project to bring our different expertise to visualizing the extent of the destruction from the fossil fuel industry. We look forward to moving these detrimental projects to the WINS layer, as communities organize together to take control of their energy future. Only then, can we see a true expansion of renewable energy and sustainable communities,” said Karen Edelstein, Eastern Program Coordinator at Fractracker Alliance.

Throughout May and June Sane Energy Project and 350.org will be traveling across the state on the ‘Sit, Stand Sing’ tour to communities featured on the map to hold trainings on nonviolent direct action and building organizing skills that connect together the communities of resistance.

“Resistance to fracking infrastructure always starts with small, volunteer led community groups,” said Lee Ziesche, Sane Energy Community Engagement Coordinator. “When these fracked gas projects come to town they’re up against one of the most powerful industries in the world. The You Are Here Map and ‘Sit, Stand Sing’ tour will connect these fights and help build the power we need to stop the harm and make a just transition to community owned renewable energy.”

An Earth Day Tribute to Bill Hughes

In March 2019, Bill Hughes, environmental defender extraordinaire and former FracTracker colleague, passed away. His legacy lives through the multitude of lives he enriched – from students to activists to everyday people. Bill was an omnipresent force for good and always armed with facts and a pervasive smile. He is dearly missed. The article that follows is derived from an interview with him in 2018. Please keep Bill in your heart this Earth Day.

Raised in an industrial town a few miles east of Pittsburgh, William “Bill” Hughes married his wife, Marianne, in 1969. With dreams of a rural setting to raise a family, they bought 79 acres in West Virginia with an old farm house – the last and only home up a hollow in an almost abandoned valley. To Bill, it was a “little piece of almost heaven.”  Proud parents to a son and daughter, the Hughes enjoyed the peace and quiet of life in Wetzel County until the shale gas invasion.

Truck accidents, blocked roads, travel delays, road damage, infrastructure degradation, and demolished signs and guardrails became the norm. The noticeable impacts eroded the community’s quality of life and Bill was there to witness, document, and report the degradation, a picture at a time.

One of Bill’s many photos of of truck traffic & air impacts from the shale gas industry in West Virginia

Bill served on the county solid waste authority where he pushed-back on accepting the radioactive waste of the fracking industry. The Franciscan magazine St. Anthony Messenger featured Bill in a 2015 story where he spoke about the waste issue. “As far as I know, in the history of humans burying waste produced from human activity, we have never taken known radioactive materials like this and buried large amounts of it in a generic landfill designed for household trash disposal.”  Bill had a knack for appealing to common sense.

In early 2015, he testified at a hearing at the WV Public Service Commission regarding the landfill’s pending permit request for the special cell for drill cuttings. Delays irritated the owners of the landfill and, in February 2016, Bill became a defendant in a federal lawsuit filed against him. A summons was delivered to his home. Meanwhile, the Public Service Commission granted the permit. It was salt in the wounds but Bill reflected on it with his signature matter-of-factness. “One must consider that during the year 2013 alone at least $9 million exchanged hands at the landfill due to drill cuttings. The state received a third of that, the landfill about two-thirds. The county also got its share. My days were numbered.”

After an initial ruling in his favor, followed by appeal by the landfill, the Fourth Circuit issued a final dismissal order in March 2017. The unnerving ordeal was over but in the preceding seven years, about 850,000 tons of drilling waste found a home at the Wetzel County landfill.

Waste hazards and air pollution from drilling were a weight on Bill’s shoulders but he was most concerned about the social impacts of the extraction craze. “For ten years, gas companies have been fracturing the deep shale in Wetzel County but families have also been fractured,” Bill said. “The whole process…has contaminated the long-standing Appalachian culture and eroded our community history. The old normal is forever gone.” Bill called it collateral damage.

But doom and gloom weren’t part of his vocabulary. Bill put the “P” in perseverance. For nearly a decade, he educated thousands of people through a process he perfected – documenting and disseminating photography of the activities and effects of shale gas development. The photos became immediately useful in helping others understand what this industry was doing to America. Visible evidence was needed to counter false industry narratives suggesting hydraulic fracturing was harmonious and benign. Bill cranked out 8,000 photos suggesting otherwise.

Bill Hughes giving tours of gas fields in West Virginia. Photo by Joe Solomon. https://flic.kr/s/aHskkXZj3z

Bill Hughes giving a tour of gas fields in West Virginia. Photo by Joe Solomon.

Just taking pictures was not enough. Context was needed. Bill interpreted each picture – explaining the location, thing or activity, and significance of every image. Did it represent a threat to our water, air, or land? When did it happen? What happened before and after? Did it show a short or long-term problem?  Should state regulatory agencies see it to become better informed? Dissemination followed in many forms: tours of the gas fields; power point presentations to groups in five states; op-ed pieces written for news media; countless responses to questions and inquiries; even blogs and photo essays for various websites. Ceaseless Bill never stopped caring.

The work continues to impress and influence. Multiple examples reside on FracTracker.org – such as his forensic tour of visible air emissions or the instructive virtual oil and gas tour.

Perhaps his latter gestures were his most poignant. Surrounded by the despair of fracking, Bill sowed hope in the form of a 10,000 watt, ground mount, grid-tied, 36-panel home solar system installed in late June 2016. “During the twelve months of 2017, it produced over 12,000 kilowatt hours,” Bill said. It proved that solar can be immediately productive and cost effective. It was a viable alternative, off-the-shelf ready and capable of providing needed energy. The bold move needed a companion – in the form of an electric car. He purchased the only Chevy Bolt to be found in the state of West Virginia.

Maybe Bill Hughes should be an official emblem for Earth Day – a humble, faithful man of modest proportions, spreading the stewardship imperative from a little electric car. Hitch a ride, follow his lead, and, like Bill, always tell it like it is.

By Brook Lenker, Executive Director, FracTracker Alliance

https://www.kvpr.org/post/dormant-risky-new-state-law-aims-prevent-problems-idle-oil-and-gas-wells

Idle Wells are a Major Risk

Designating a well as “idle” is a temporary solution for operators, but comes at a great economic and environmental cost to Californians 

Idle wells are oil and gas wells which are not in use for production, injection, or other purposes, but also have not been permanently sealed. During a well’s productive phase, it is pumping and producing oil and/or natural gas which profit its operators, such as Exxon, Shell, or California Resources Corporation. When the formations of underground oil pools have been drained, production of oil and gas decreases. Certain techniques such as hydraulic fracturing may be used to stimulate additional production, but at some point operators decide a well is no longer economically sound to produce oil or gas. Operators are supposed to retire the wells by filling the well-bores with cement to permanently seal the well, a process called “plugging.”

A second, impermanent option is for operators to forego plugging the well to a later date and designate the well as idle. Instead of plugging a well, operators cap the well. Capping a well is much cheaper than plugging a well and wells can be capped and left “idle” for indefinite amounts of time.

Well plugging

Unplugged wells can leak explosive gases into neighborhoods and leach toxic fluids into drinking waters. Plugging a well helps protect groundwater and air quality, and prevents greenhouse gasses from escaping and expediting climate change. Therefore it’s important that idle wells are plugged.

While plugging a well does not entirely eliminate all risk of groundwater contamination or leaking greenhouse gases, (read more on FracTracker’s coverage of plugged wells) it does reduce these risks. The longer wells are left idle, the higher the risk of well casing failure. Over half of California’s idle wells have been idle for more than 10 years, and about 4,700 have been idle for over 25 years. A report by the U.S. EPA noted that California does not provide the necessary regulatory oversite of idle wells to protect California’s underground sources of drinking water.

Wells are left idle for two main reasons: either the cost of plugging is prohibitive, or there may be potential for future extraction when oil and gas prices will fetch a higher profit margin.  While idle wells are touted by industry as assets, they are in fact liabilities. Idle wells are often dumped to smaller or questionable operators.

Orphaned wells

Wells that have passed their production phase can also be “orphaned.” In some cases, it is possible that the owner and operator may be dead! Or, as often happens, the smaller operators go out of business with no money left over to plug their wells or resume pumping. When idle wells are orphaned from their operators, the state becomes responsible for the proper plugging and abandonment.

The cost to plug a well can be prohibitively high for small operators. If the operators (who profited from the well) don’t plug it, the costs are externalized to states, and therefore, the public. For example, the state of California plugged two wells in the Echo Park neighborhood of Los Angeles at a cost of over $1 million. The costs are much higher in urban areas than, say, the farmland and oilfields of the Central Valley.

Since 1977, California has permanently sealed about 1,400 orphan wells at a cost of $29.5 million, according to reports by the Division of Oil, Gas, and Geothermal Resources (DOGGR). That’s an average cost of about $21,000 per well, not accounting for inflation. From 2002-2018, DOGGR plugged about 600 wells at a cost of $18.6 million; an average cost of about $31,000.

Where are they?

Map of California’s Idle Wells


View map fullscreen | How FracTracker maps work

The map above shows the locations of idle wells in California.  There are 29,515 wells listed as idle and 122,467 plugged or buried wells as of the most recent DOGGR data, downloaded 3/20/19. There are a total of 245,116 oil and gas wells in the state, including active, idle, new (permitted) or plugged.

Of the over 29,000 wells are listed as idle, only 3,088 (10.4%) reported production in 2018. Operators recovered 338,201 barrels of oil and 178,871 cubic feet of gas from them in 2018. Operators injected 1,550,436,085 gallons of water/steam into idle injection wells in 2018, and 137,908,884 cubic feet of gas.

The tables below (Tables 1-3) provide the rankings for idle well counts by operator, oil field, and county (respectively).  Chevron, Aera, Shell, and California Resources Corporation have the most idle wells. The majority of the Chevron idle wells are located in the Midway Sunset Field. Well over half of all idle wells are located in Kern County.

Table 1. Idle Well Counts by Operator
Operator Name Idle Well Count
1 Chevron U.S.A. Inc. 6,292
2 Aera Energy LLC 5,811
3 California Resources Production Corporation 3,708
4 California Resources Elk Hills, LLC 2,016
5 Berry Petroleum Company, LLC 1,129
6 E & B Natural Resources Management Corporation 991
7 Sentinel Peak Resources California LLC 842
8 HVI Cat Canyon, Inc. 534
9 Seneca Resources Company, LLC 349
10 Crimson Resource Management Corp. 333


Table 2. Idle Well Counts by Oil Field
Oil Field Count by Field
1 Midway-Sunset 5,333
2 Unspecified 2,385
3 Kern River 2,217
4 Belridge, South 2,075
5 Coalinga 1,729
6 Elk Hills 958
7 Buena Vista 887
8 Lost Hills 731
9 Cymric 721
10 Cat Canyon 661


Table 3. Idle Well Counts by County
County Count by County
1 Kern 17,276
2 Los Angeles 3,217
3 Fresno 2,296
4 Ventura 2,022
5 Santa Barbara 1,336
6 Orange 752
7 Monterey 399
8 Kings 212
9 San Luis Obispo 202
10 Sutter 191


Risks

According to the Western States Petroleum Association (WSPA) the count of idle wells in California has increased from just over 20,000 idle wells in 2015 to nearly 30,000 wells in 2018! That’s an increase of nearly 50% in just 3 years!

Nobody knows how many orphaned wells are actually out there, beneath homes, in forests, or in the fields of farmers. The U.S. EPA estimates that there are more than 1 million of them across the country, most of them undocumented. In California, DOGGR officially reports that there are 885 orphaned wells in the state.

A U.S. EPA report on idle wells published in 2011 warned that existing monitoring requirements of idle wells in California was “not consistent with adequate protection” of underground sources of drinking water. Idle wells may have leaks and damage that go unnoticed for years, according to an assessment by the state Department of Conservation (DOC). The California Council on Science and Technology is actively researching this and many other issues associated with idle and orphaned wells. The published report will include policy recommendations considering the determined risks. The report will determine the following:

  • State liability for the plugging and abandoning of deserted and orphaned wells and decommissioning facilities attendant to such wells
  • Assessment of costs associated with plugging and abandoning deserted and orphaned wells and decommissioning facilities attendant to such wells
  • Exploration of mechanisms to ameliorate plugging, abandoning, and decommissioning burdens on the state, including examples from other regions and questions for policy makers to consider based on state policies

Current regulation

As of 2018, new CA legislation is in effect to incentivize operators to properly plug and abandon their stocks of idle wells. In California, idle wells are defined as wells that have not had a 6-month continuous period of production over a 2-year period (previously a 5-year period). The new regulations require operators to pay idle well fees.  The fees also contribute towards the plugging and proper abandonment of California’s existing stock of orphaned wells. The new fees are meant to act as bonds to cover the cost of plugging wells, but the fees are far too low:

  • $150 for each well that has been idle for 3 years or longer, but less than 8 years
  • $300 for each well that has been idle for 8 years or longer, but less than 15 years
  • $750 for each well that has been idle for 15 years or longer, but less than 20 years
  • $1,500 for each well that has been idle for 20 years or longer

Operators are also allowed to forego idle well fees if they institute long-term idle well management and elimination plans. These management plans require operators to plug a certain number of idle wells each year.

In February 2019, State Assembly member Chris Holden introduced an idle oil well emissions reporting bill. Assembly bill 1328 requires operators to monitor idle and abandoned wells for leaks. Operators are also required to report hydrocarbon emission leaks discovered during the well plugging process. The collected results will then be reported publicly by the CA Department of Conservation. According to Holden, “Assembly Bill 1328 will help solve a critical knowledge gap associated with aging oil and gas infrastructure in California.”

While the majority of idle wells are located in Kern County, many are also located in California’s South Coast region. Due to the long history and high density of wells in the Los Angeles, the city has additional regulations. City rules indicate that oil wells left idle for over one year must be shut down or reactivated within a month after the city fire chief tells them to do so.

Who is responsible?

All of California’s wells, from Kern County to three miles offshore, on private and public lands, are managed by DOGGR, a division of the state’s Department of Conservation. Responsibilities include establishing and enforcing the requirements and procedures for permitting wells, managing drilling and production, and at the end of a well’s lifecycle, plugging and “abandoning” it.

To help ensure operator liability for the entire lifetime of a well, bonds or well fees are required in most states. In 2018, California updated the bonding requirements for newly permitted oil and gas wells. These fees are in addition to the aforementioned idle well fees. Operators have the option of paying a blanket bond or a bond amount per well. In 2018, these fees raised $4.3 million.

Individual well fees:

  • Wells less than 10,000 feet deep: $10,000
  • Wells more than 10,000 feet deep: $25,000

Blanket fees:

  • Less than 50 wells: $200,000
  • 50 to 500 wells: $400,000
  • 500 to 10,000 wells: $2,000,000
  • Over 10,000 wells: $3,000,000

With an average cost of at least $31,000 to plug a well, California’s new bonding requirements are still insufficient. Neither the updated individual nor blanket fees provide even half the cost required to plug a typical well.

Conclusions

Strategies for the managed decline of the fossil fuel industry are necessary to make the proposal a reality. Requiring the industry operators to shut down, plug and properly abandon wells is a step in the right direction, but California’s new bonding and idle well fees are far too low to cover the cost of orphan wells or to encourage the plugging of idle wells. Additionally, it must be stated that even properly abandoned wells have a legacy of causing groundwater contamination and leaking greenhouse gases such as methane and other toxic VOCs into the atmosphere.

By Kyle Ferrar, Western Program Coordinator, FracTracker Alliance

Cover photo: Kerry Klein, Valley Public Radio

DOGGR

Literally Millions of Failing, Abandoned Wells

By Kyle Ferrar, Western Program Coordinator, FracTracker Alliance

In California’s Central Valley and along the South Coast, there are many communities littered with abandoned oil and gas wells, buried underground.

Many have had homes, buildings, or public parks built over top of them. Some of them were never plugged, and many of those that were plugged have since failed and are leaking oil, natural gas, and toxic formation waters (water from the geologic layer being tapped for oil and gas). Yet this issue has been largely ignored. Oil and gas wells continue to be permitted without consideration for failing and failed plugged wells. When leaking wells are found, often nothing is done to fix the issue.

As a result, greenhouse gases escape into the atmosphere and present an explosion risk for homes built over top of them. Groundwater, including sources of drinking water, is known to be impacted by abandoned wells in California, yet resources are not being used to track groundwater contamination.

Abandoned wells: plugged and orphaned

The term “abandoned” typically refers to wells that have been taken out of production. At the end of their lifetime, wells may be properly abandoned by operators such as Chevron and Shell or they may be orphaned.

When operators properly abandon wells, they plug them with cement to prevent oil, natural gas, and salty, toxic formation brine from escaping the geological formation that was tapped for production. Properly plugging a well helps prevent groundwater contamination and further air quality degradation from the well. The well-site at the surface may also be regraded to an ecological environment similar to its original state.

Wells that are improperly abandoned are either plugged incorrectly or are “orphaned” by their operators. When wells are orphaned, the financial liability for plugging the well and the environmental cleanup falls on the state, and therefore, the taxpayers.

You don’t see them?

In California’s Central Valley and South Coast abandoned wells are everywhere. Below churches, schools, homes, they even under the sidewalks in downtown Los Angeles!

FracTracker Alliance and Earthworks recently spent time in Los Angeles with an infrared camera that shows methane and volatile organic compound (VOC) emissions. We visited several active neighborhood drilling sites and filmed plumes of toxic and carcinogenic VOCs floating over the walls of well-pads and into the surrounding neighborhoods. We also visited sites where abandoned, plugged wells had failed.

In the video below, we are standing on Wilshire Blvd in LA’s Miracle Mile District. An undocumented abandoned well under the sidewalk leaks toxic and carcinogenic VOCs through the cracks in the pavement as mothers push their children in walkers through the plume. This is just one case of many that the state is not able to address.

California regulatory data shows that there are 122,466 plugged wells in the state, as shown below in the map below. Determining how many of them are orphaned or improperly plugged is difficult, but we can come up with an estimate based on the wells’ ages.

While there are no available data on the dates that wells were plugged, there are data on “spud dates,” the date when operators begin drilling into the ground. Of the 18,000 wells listing spud dates, about 70% were drilled prior to 1980. Wells drilled before 1980 have a higher risk of well casing failures and are more likely to be sources of groundwater contamination.

Additionally, wells plugged prior to 1953 are not considered effective, even by industry standards. Prior to 1950, wells either were orphaned or plugged and abandoned with very little cement. Plugging was focused on protecting the oil reservoirs from rain infiltration rather than to “confine oil, gas and water in the strata in which they are found and prevent them from escaping into other strata.” Of the wells with drilling dates in the regulatory data, 30% are listed as having been drilled prior to the use of cement in well plugging.

With a total of over 245,000 wells in the state database, and considering the lack of monitoring prior to 1950, it’s reasonable to assume there are over 80,000 improperly plugged and unplugged wells in California.

Map of California’s Plugged Wells

View map fullscreen | How FracTracker maps work

The regions with the highest counts of plugged wells are the Central Valley and the South Coast. The top 10 county ranks are listed below in Table 1. Kern County has more than half of the total plugged wells in the entire state.

Table 1. Ranks of Counties by Plugged Well Counts
  • Rank
  • 1
  • 2
  • 3
  • 4
  • 5
  • 6
  • 7
  • 8
  • 9
  • 10
  • County
  • Kern
  • Los Angeles
  • Orange
  • Fresno
  • Ventura
  • Santa Barbara
  • Monterey
  • San Luis Obispo
  • Solano
  • Yolo
  • Plugged Well Count
  • 65,733
  • 17,139
  • 7,259
  • 6,970
  • 4,302
  • 4,192
  • 2,266
  • 1,463
  • 1,456
  • 1,383

The issue is not unique to California. Nationally, an estimated 2.56 million oil and gas wells have been drilled and 1.93 million wells had been abandoned by 1975. Using interpolated data, the EPA estimates that as of 2016 there were 3.12 million abandoned wells in the U.S. and 69% of them were left unplugged.

In 2017, FracTracker Alliance organized an exercise to track down the locations of Pennsylvania’s abandoned wells that are not included in the PA Department of Environmental Protection’s digital records. Using paper maps and the FracTracker Mobile App, volunteers explored Pennsylvania woodlands in search of these hidden greenhouse gas emitters.

What are the risks?

Emissions

Studies by Kang et al. 2014, Kang et al 2016, Boothroyd et al 2016, and Townsend-Small et al. 2016 have all measured methane emissions from abandoned wells. Both properly plugged and improperly abandoned wells have been shown to leak methane and other VOCs to the atmosphere as well as into the surrounding groundwater, soil, and surface waters. Leaks were shown to begin just 10 years after operators plugged the wells.

Well density

The high density of aging and improperly plugged wells is a major risk factor for the current and future development of California’s oil and gas fields. When fields with old wells are reworked using new technology, such as hydraulic fracturing, CO2 flooding, or solvent flooding (including acidizing, water flooding, or steam flooding), the injection of additional fluid and gas increases pressure in a reservoir. Poorly plugged or aging wells often lack the integrity to avoid a blowout (the uncontrolled release of oil and/or gas from a well). There is a consistent risk that formation fluids will be forced to migrate up the plugged wellbores and bypass the existing plugs.

Groundwater

In a 2014 report, the U.S. Geological Service warned the California State Water Resources Control Board that the integrity of abandoned wells is a serious threat to groundwater sources, stating, “Even a small percentage of compromised well bores could correspond to a large number of transport pathways.”

The California Council on Science and Technology (CCST) has also suggested the need for additional research on existing aquifer contamination. In 2014, they called for widespread testing of groundwater near oil and gas fields, which has still not occurred.

Leaks

In addition to the contamination of underground sources of drinking water, abandoned well failures can even create a pathway for methane and fluids to escape to Earth’s surface. In many cases, such as in Pennsylvania, Texas, and California, where drilling began prior to the turn of the 20th century, many wells have been left unplugged. Of the abandoned wells that were plugged, the plugging process was much less adequate than it is today.

If plugged wells are allowed to leak, surface expressions can form. These leaks can travel to the Earth’s crust where oil, gas, and formation waters saturate the topsoil. A construction supervisor for Chevron named David Taylor was killed by such an event in the Midway-Sunset oil field near Bakersfield, CA. According to the LA Times, Chevron had been trying to control the pressure at the well-site. The company had stopped injections near the well, but neighboring operators continued high-pressure injections into the pool. As a result, migration pathways along old wells allowed formation fluids to saturate the Earth just under the well-site. Tragically, Taylor fell into a 10-foot diameter crater of 190° fluid and hydrogen sulfide.

California regulations

Following David Taylor’s death in 2011, California regulators vowed to make urgent reforms to the management of underground injection, and new rules finally went into effect on April 1, 2018. These regulations require more consistent monitoring of pressure and set maximum pressure standards. While this will help with the management of enhanced oil recovery operations, such as steam and water flooding and wastewater disposal, the issue of abandoned wells is not being addressed.

New requirements incentivizing operators to plug and abandon idle wells will help to reduce the number of orphan wells left to the state, but nothing has been done or is proposed to manage the risk of existing orphaned wells.

Conclusion

Why would the state of California allow new oil and gas drilling when the industry refuses to address the existing messes? Why are these messes the responsibility of private landholders and the state when operators declare bankruptcy?

New bonding rules in some states have incentivized larger operators to plug their own wells, but old low-producing or idle wells are often sold off to smaller operators or shell (not Shell) companies prior to plugging. This practice has been the main source of orphaned wells. And regardless of whether wells are plugged or not, research shows that even plugged wells release fugitive emissions that increase with the age of the plug.

If the fossil fuel industry were to plug the existing 1.666 million currently active wells, there would be nearly 5 million plugged wells that require regular inspections, maintenance, and for the majority, re-plugging, to prevent the flow of greenhouse gases. This is already unattainable, and drilling more wells adds to this climate disaster.

By Kyle Ferrar, Western Program Coordinator, FracTracker Alliance