FracTracker Alliance Executive Director Shannon Smith releases statement in opposition to Pennsylvania Governor Josh Shapiro’s agreement with natural gas company CNX.
We are pleased to announce that FracTracker Alliance has been selected for two EPA grants totaling $925,302 to support community air monitoring initiatives in the Ohio River Valley.
https://www.fractracker.org/a5ej20sjfwe/wp-content/uploads/2022/11/Washington-County-PA-2022-Google-Earth.jpg9331920FracTracker Alliancehttps://www.fractracker.org/a5ej20sjfwe/wp-content/uploads/2021/04/2021-FracTracker-logo-horizontal.pngFracTracker Alliance2022-11-04 12:55:532022-11-04 13:04:53FracTracker Receives Two Federal Grants to Support Community Air Monitoring Initiatives in the Ohio River Valley
https://www.fractracker.org/a5ej20sjfwe/wp-content/uploads/2021/12/173695136_1422048161521006_7197500259062906334_n.jpg6671500Erica Jacksonhttps://www.fractracker.org/a5ej20sjfwe/wp-content/uploads/2021/04/2021-FracTracker-logo-horizontal.pngErica Jackson2021-12-01 15:27:402021-12-01 15:27:40New Letter from Federal Regulators Regarding how the Falcon has Been Investigated
https://www.fractracker.org/a5ej20sjfwe/wp-content/uploads/2019/12/Allegheny-Lease-Map-front-page.jpg5732000Matt Kelso, BAhttps://www.fractracker.org/a5ej20sjfwe/wp-content/uploads/2021/04/2021-FracTracker-logo-horizontal.pngMatt Kelso, BA2019-12-02 14:05:562021-04-15 14:55:35Prizio Increases Transparency in Oil & Gas Data in Allegheny County
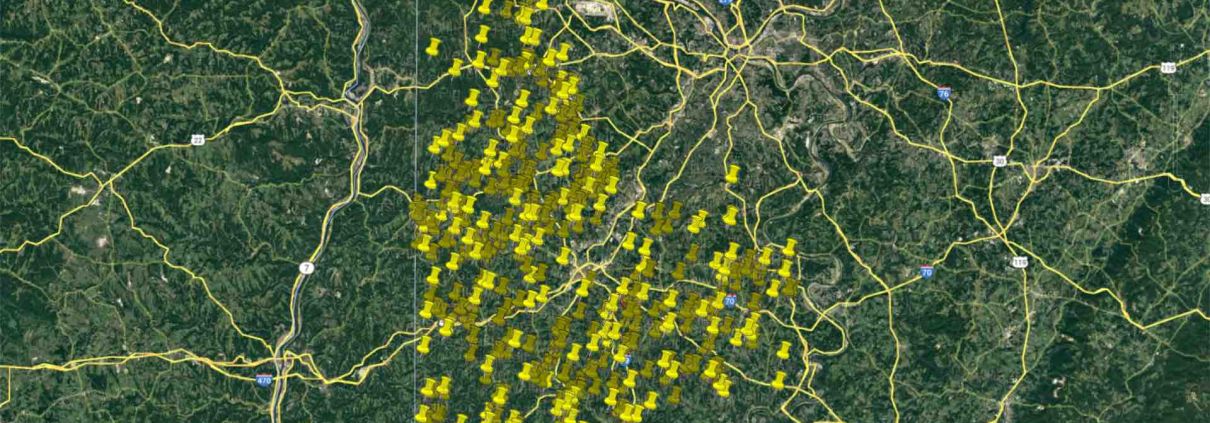
PITTSBURGH, PA – At last night’s County Council meeting, Councilwoman Anita Prizio unveiled a new bill to create an oil and gas lease registry for Allegheny County, which would help the area’s residents and municipalities better plan for oil and gas development within their communities.
The legislation, which has been referred to committee, would establish a publicly-available database of drilling leases across the county, organized by address, municipality, and company lease holder.
In 2016, FracTracker Alliance noted many issues with the county’s existing system during a lease mapping project and supports the move to make county lease data more transparent. For example, entries in the current database recorded after 2010 do not list street addresses or parcel IDs, which are necessary for proper mapping of local drilling activity.
“The proposed oil and gas lease registry would be a step in the right direction for improving the industry’s transparency and accountability in an area surrounded by extensive drilling,” remarked FracTracker’s Manager of Data and Technology and Allegheny County resident, Matt Kelso. “These agreements are already public data, but they’re burdensome to access and essentially impossible to analyze in any comprehensive fashion.”
Industrial-scaled oil and gas development has steadily increased in Allegheny County, with permits for 258 unconventional wells, more than half of which are now operational. Based on its earlier mapping work, FracTracker estimates that 63,014 acres – roughly 18% of the county – are already under some kind of mineral rights lease or pipeline rights-of-way agreement, a calculation that did not include parcels that were not identified due to missing data.
The lease registry, which would disclose permitting statuses and well type, would also play a large part in supporting local zoning efforts and helping public safety officials prepare for incidents that could put residents and infrastructure at risk.
# # #
About FracTracker Alliance
FracTracker Alliance is a national organization with regional offices across the United States in Pennsylvania, Washington DC, New York, Ohio, and California. Our mission is to study, map, and communicate the risks of oil and gas development to protect our planet and support the renewable energy transformation. We accomplish this by supporting advocacy groups at the local, regional, and national level – informing actions to positively shape our nation’s energy future. Check out FracTracker’s 2016 Allegheny Lease Mapping Project.
https://www.fractracker.org/a5ej20sjfwe/wp-content/uploads/2018/09/AlleghenyCounty-Map-Feature.jpg400900FracTracker Alliancehttps://www.fractracker.org/a5ej20sjfwe/wp-content/uploads/2021/04/2021-FracTracker-logo-horizontal.pngFracTracker Alliance2018-09-26 12:40:032021-04-15 14:57:37Supporting accessible oil and gas lease data in Allegheny County
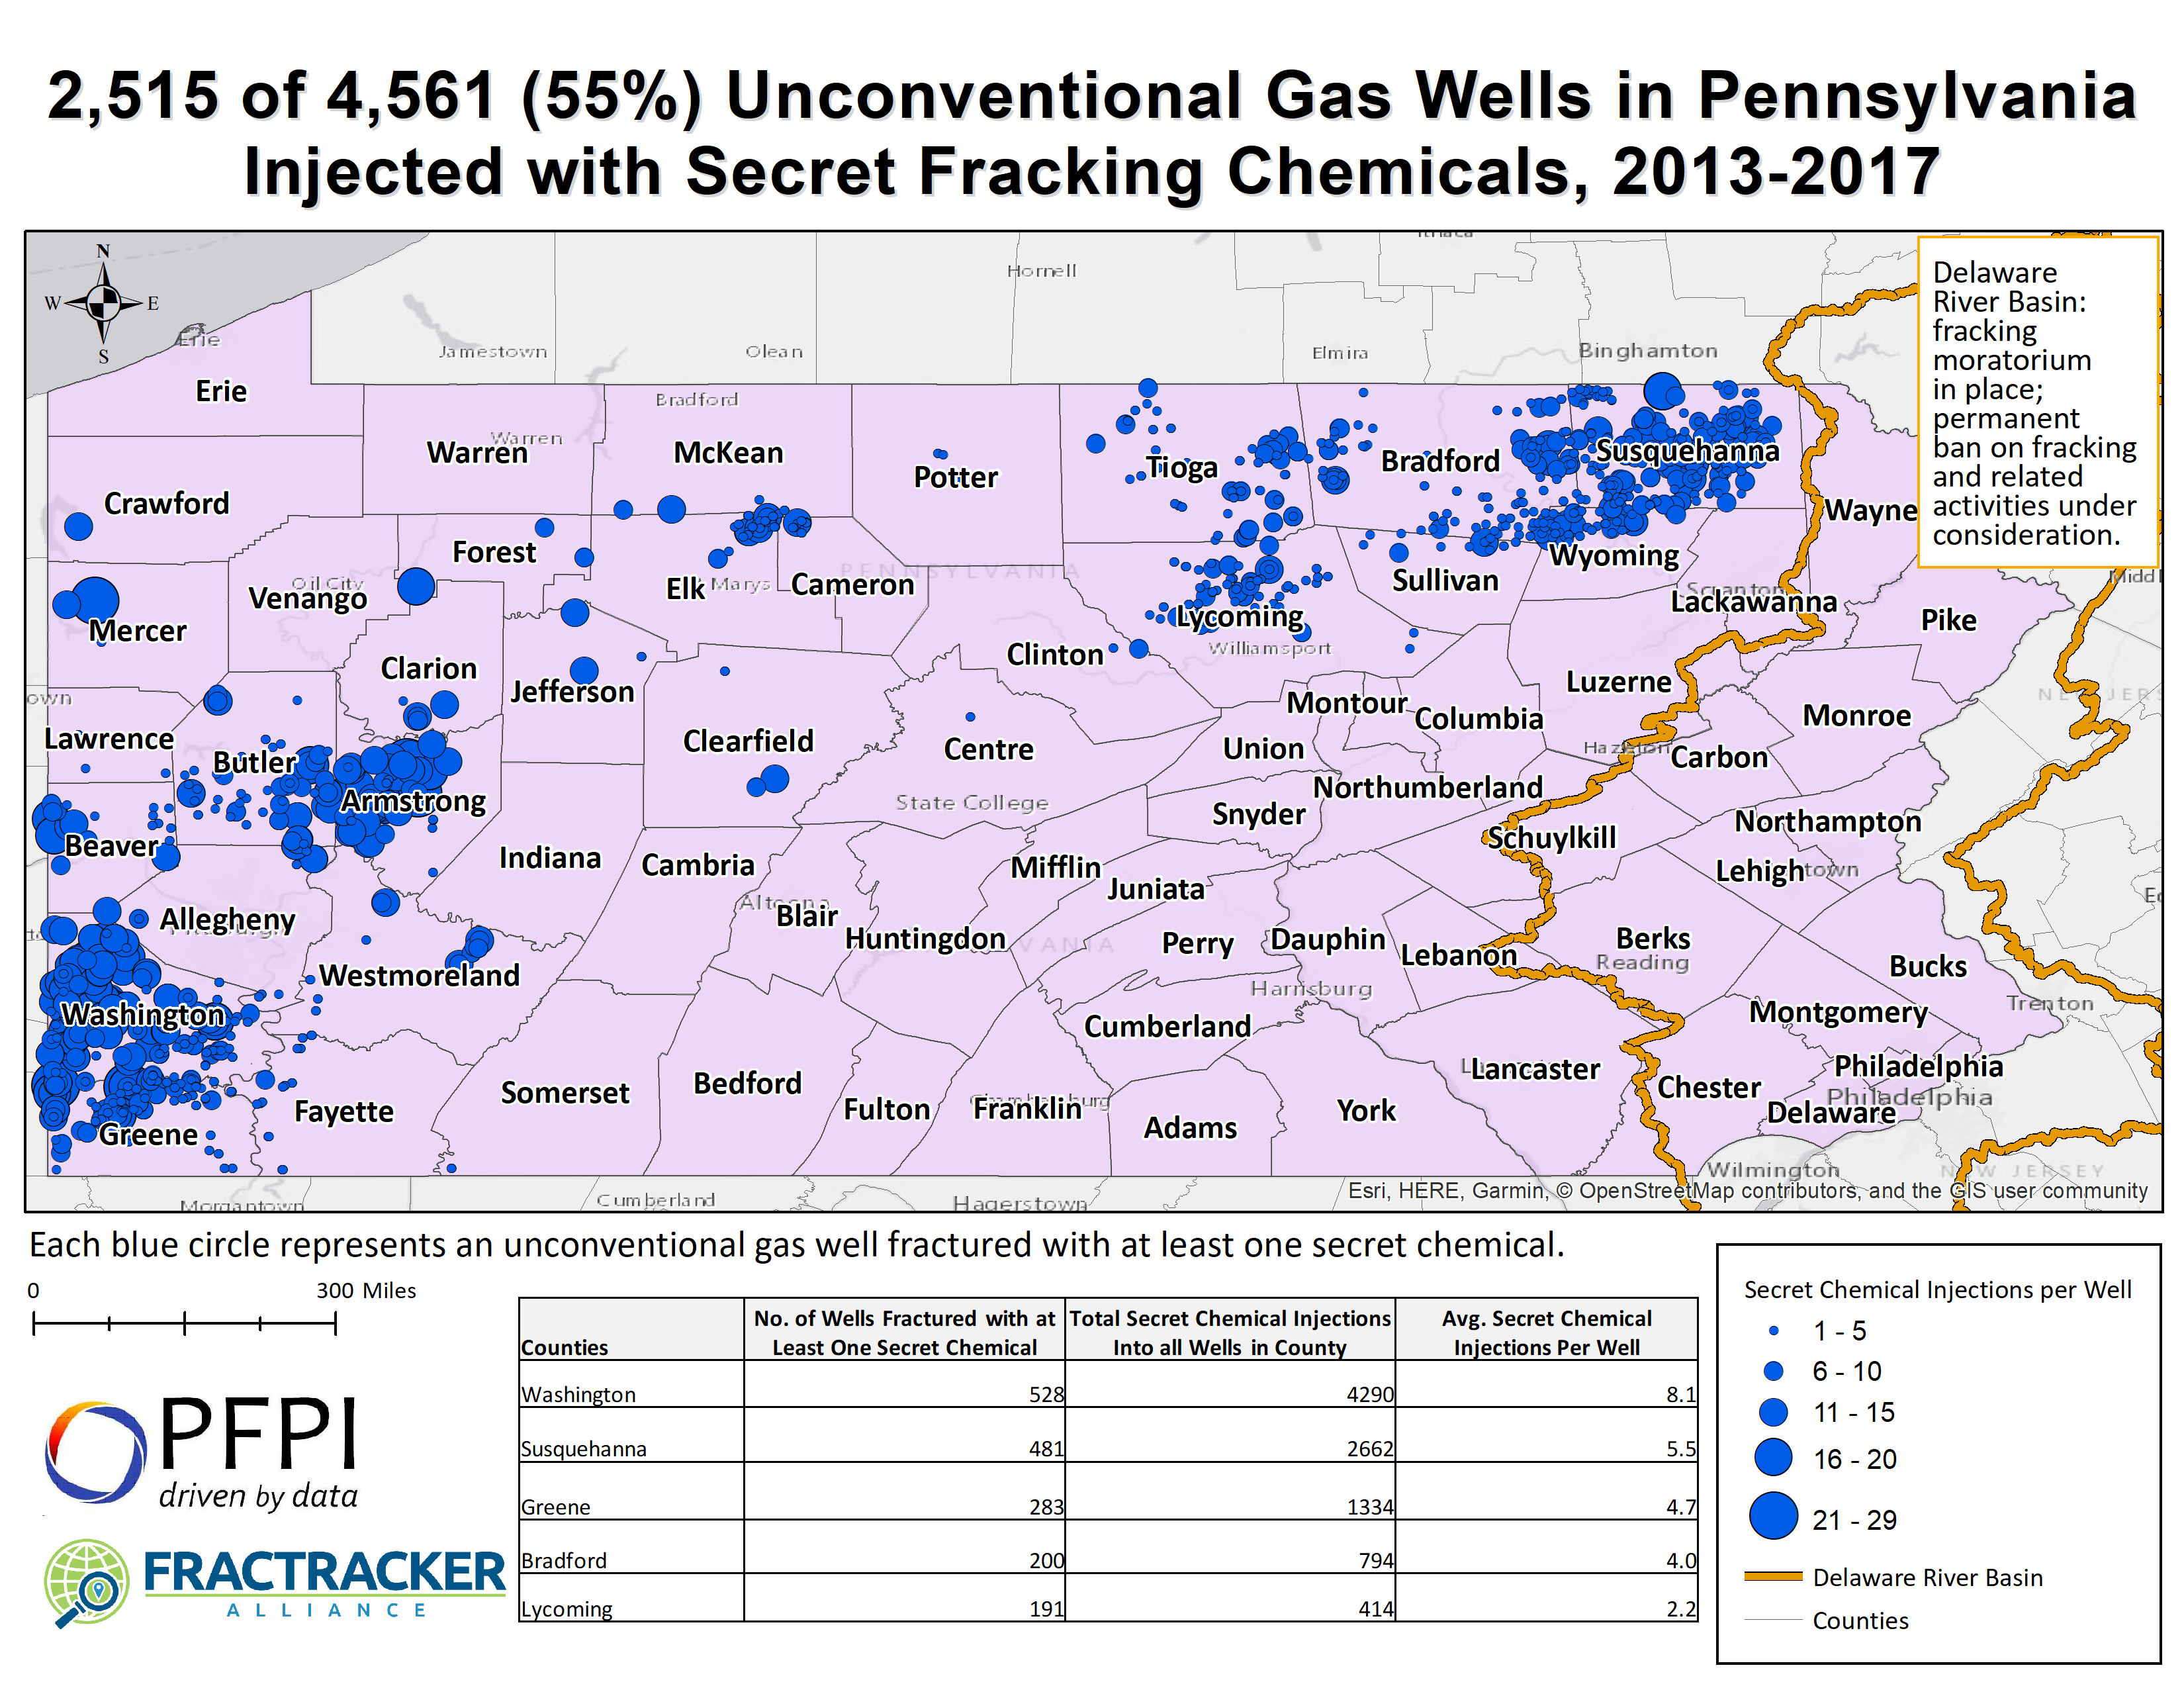
Keystone Secrets: Records Show Widespread Use of Secret Fracking Chemicals is a Looming Risk for Delaware River Basin, Pennsylvania Communities
A report released today by the Partnership for Policy Integrity (PFPI) found that between 2013 and 2017, drilling companies injected at least one hydraulic fracturing (“fracking”) chemical with an identity kept hidden from the public into more than 2,500 unconventional natural gas wells drilled in Pennsylvania. The report, KeyStone Secrets, found companies injected secret fracking chemicals 13,632 times into 2,515 wells in total (explore map below).
Fracking in unconventional formations has significantly increased oil and gas extraction, making Pennsylvania the nation’s second-largest natural gas producer. The process has also sparked concerns about pollution and health effects, especially related to unidentified fracking chemicals. In response, Pennsylvania and 28 other states have enacted rules that require some public disclosure of these chemicals. However, most if not all of these rules have exceptions that allow companies to withhold chemical identities as trade secrets.
This report by Massachusetts-based Partnership for Policy Integrity (PFPI), with analysis of fracking chemical disclosure data by FracTracker Alliance, illustrates that drilling companies have used these exceptions extensively.
Records obtained by PFPI from the US Environmental Protection Agency (EPA) show that non-disclosure of fracking chemical identities may leave people unknowingly exposed to harmful substances. Between 2003 and 2014, the EPA identified health concerns for 109 of 126 new chemicals proposed for use in oil and gas drilling and fracking. The manufacturers submitted information about the chemicals for review under a program that requires EPA to screen and regulate new chemicals for health and environmental impacts before they are used commercially.
Despite concerns by EPA scientists about the chemicals’ health effects, EPA approved most of the 109 chemicals for use, and 62 were later used in or likely used in oil and gas wells. Manufacturers took advantage of trade secret protections that are permitted by federal law to conceal 41 of the 62 chemicals’ identities. It is possible that some of these chemicals declared secret at the federal level are some of the same chemicals being used under trade secret protection in Pennsylvania.
Mapping of secret fracking chemical injection sites (above) show that use is heaviest in southwest Pennsylvania near Pittsburgh and in northeast Pennsylvania near the Delaware River Basin, tracking areas of intensive drilling.
The use of secret chemicals in Pennsylvania’s oil and gas wells is likely even higher than detailed in this report because of exemptions in Pennsylvania law, including:
No disclosure requirements for the chemicals used in drilling oil and gas wells – the portion of the oil and gas extraction process that precedes fracking;
No requirement that fracking chemicals for so-called “conventional” oil and gas wells be reported to an easily searchable electronic database; and
A reporting exemption for chemical manufacturers who are not required to disclose trade secret chemical identities even to emergency responders cleaning up a leak or spill.
In the coming months, the Delaware River Basin Commission is expected to consider a ban on fracking in the basin – fracking that would be most likely to occur in unconventional gas wells in Pennsylvania’s portion of the four-state area. There is currently a de facto moratorium on fracking in the basin that provides drinking water for New York City and Philadelphia – among other cities. The commission is also expected to consider whether to allow related activities inside the basin, including the treatment and discharge into waterways of fracking wastewater from outside the basin. Any fracking or discharges of wastewater would be likely to include some of the secret fracking chemicals discussed in this report.
People have a right to know the identities of chemicals used in oil and gas operations so that citizens, first responders, regulators, and scientists can determine the chemicals’ risks and act to protect health and the environment. Learn more about the proprietary fracking chemicals used in PA by reading the full report:
Report Author: Dusty Horwitt, Partnership for Policy Integrity
https://www.fractracker.org/a5ej20sjfwe/wp-content/uploads/2018/09/SecretChemicalsReport-Rig-Feature.jpg400900FracTracker Alliancehttps://www.fractracker.org/a5ej20sjfwe/wp-content/uploads/2021/04/2021-FracTracker-logo-horizontal.pngFracTracker Alliance2018-09-11 06:00:092021-04-15 14:57:38New report finds widespread use of proprietary fracking chemicals in PA
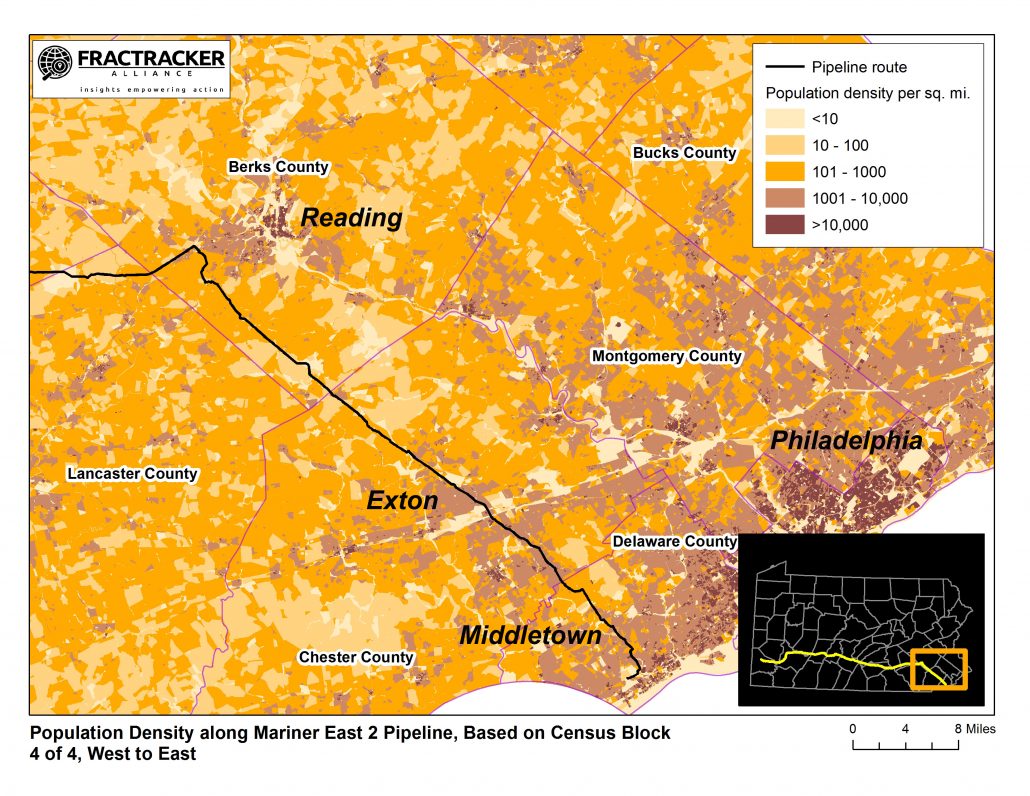
FracTracker Alliance recently created a set of maps showing population variation along the route of the Mariner East 2 Pipeline, which I refer to as the “Dragonpipe.” FracTracker’s maps dramatically reveal a route that runs through many centers of dense population, and seems to avoid relatively nearby areas with far lower population density. The maps are based on US Census 2010 block-level data.
The take-away lesson from these maps is this: Sunoco has put the Dragonpipe in a very bad location.
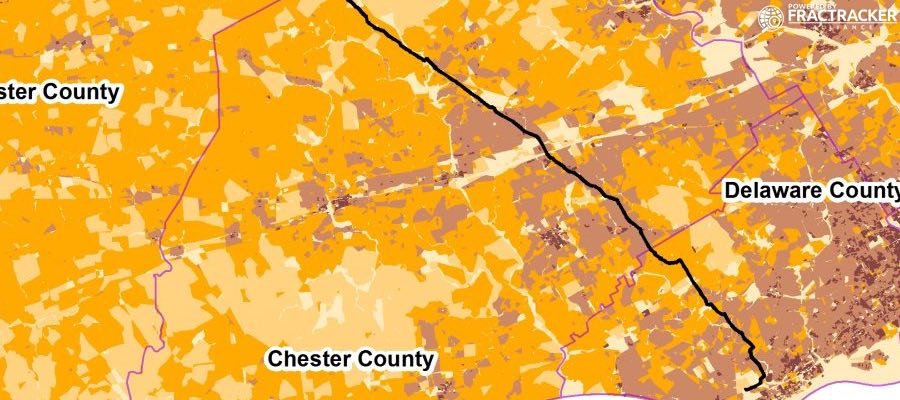
As an example, here is a map of the pipeline route as it passes through Berks, Chester, and Delaware counties in Pennsylvania:
Figure 1. Population density in southeastern Pennsylvania. Map courtesy of FracTracker Alliance. Location annotations added by G. Alexander.
The dark brown areas in the map above denote the most densely populated locations, displayed as the number of people per square mile. The lighter the color, the lower the population density. The black line is the pipeline route.
In the upper left-hand part of the map, note that the route passes through the suburbs of Reading, in Berks County. Further south in the same map, notice how it passes directly through population centers in Chester and Delaware counties.
Let’s examine this pattern more closely.
Why was this route chosen in the first place?
For Sunoco’s convenience
In many areas, from a standpoint of impacts on local communities, the pipeline route is actually the worst possible track that Sunoco could have chosen; it puts more people at risk than any other path, given the same starting- and endpoints. Why in the world did they choose this route?
The answer is this: for Sunoco’s corporate convenience. The Dragonpipe, for most of its length, runs side-by-side Mariner East 1 (ME1), an existing 80+ year-old pipeline designed to carry gasoline and heating oil to customers in the central and western parts of Pennsylvania. From this standpoint, the location of the old pipeline makes sense; it had to be sited near populated areas. That’s where the customers for gasoline and heating oil were located back in the 1930s.
However, the flip-side of Sunoco’s corporate convenience may also mean unnecessary risks to tens of thousands of Pennsylvania residents.
The old pipeline connected the centers of population in the 1930s, areas that are now much more populous when they were nearly ninety years ago. In the southeastern part of Pennsylvania, the character of the area has also changed dramatically. When the original pipeline was built, the landscape along ME1’s route through Delaware and Chester counties was predominantly farmland. Today, that area has changed to densely-settled suburbs, with homes, schools, businesses, hospitals, and shopping centers directly adjacent to the pipeline’s right-of-way.
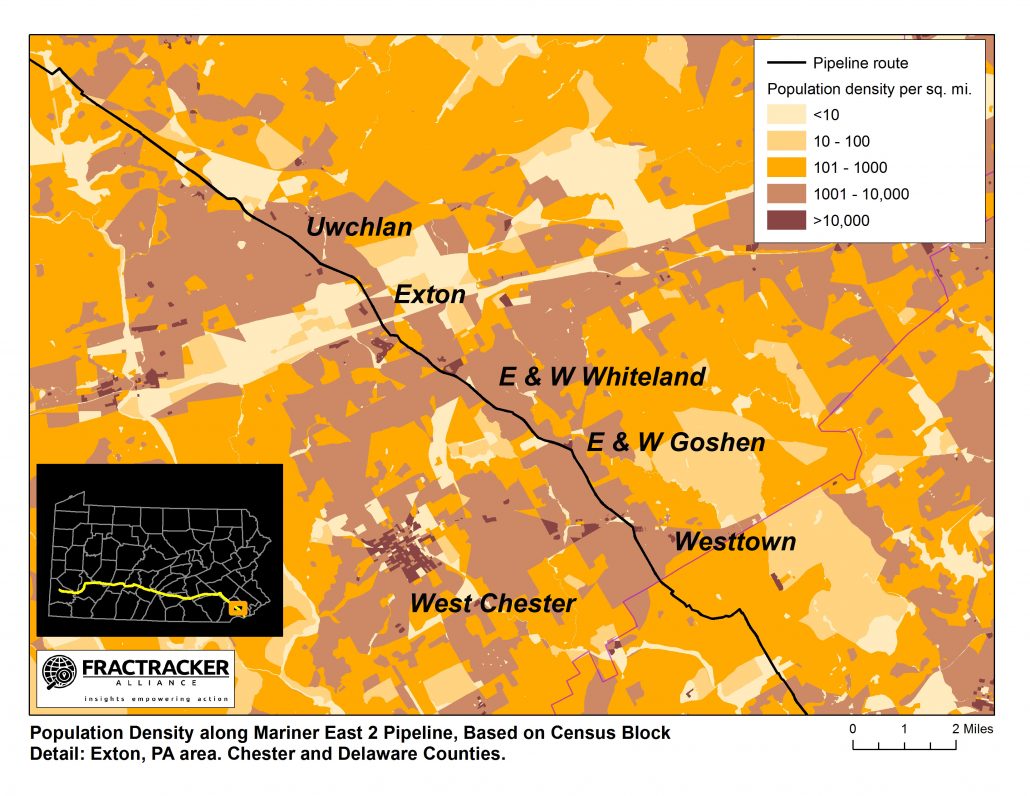
The Exton area provides a prime example of how this transition to suburbia has set the stage for potential disaster along the pipeline route. The following image shows a detailed view of the population density near Exton. As you can see, the pipeline route sticks to high-density areas (shown in dark brown) the entire way, even though lower-density options (shown in orange and yellow) exist nearby.
Figure 2. Population density in Exton area. Map courtesy of FracTracker Alliance. Location annotations added by G. Alexander.
Sunoco — like any corporation — has a moral obligation to conduct its business in a safe manner. This includes choosing a safe route for a pipeline that has inherent dangers and risks. However, Sunoco apparently did not choose to do so. Moreover, by law, Sunoco has an obligation to make human safety paramount. In the settlement Sunoco reached last August with Clean Air Council, Delaware Riverkeeper Network, and Mountain Watershed Association, Sunoco agreed to consider alternative routing for the pipeline in this area. Then, despite their promises, Sunoco simply bypassed that part of the agreement. Rather than explore alternatives to the proposed route, Sunoco dismissed the alternatives as “not practicable” because they did not involve the right-of-way that was already in use for Mariner East 1.
Sunoco seemed to have made their sole priority in considering a pipeline route whether the company has an existing pipeline there already. A better route would reduce by hundreds the number of people who could be killed or injured if there were a leak and explosion.
Pipelines leak
Pipelines can and do leak. Mariner East 1, in its short career as a pipeline carrying NGLs, has already leaked several times. It is just good luck that the leaks were stopped before any product ignited. (See most recent report of ME1 and ME2 issues.) The Atex pipeline, a pipeline of similar size and content that runs down to the Gulf Coast, ruptured and exploded near Follansbee, WV, in just its second year of operation. And there’s no reason to believe such an incident would never happen with the Dragonpipe.
Sunoco has an obligation to do what it can to minimize the injuries, death, and destruction caused by an event like the Follansbee explosion. The Follansbee incident occurred in a forested area. The explosion destroyed several acres of trees, but no-one was killed. The result would have been far different if had the explosion been in a densely populated area.
Just as the maps above show how the Philadelphia suburbs and those of Reading are threatened, other FracTracker maps show the threats to suburbs of Pittsburgh and Harrisburg, below. Click to expand.
A call for change
Indeed, across the state, the Dragonpipe route gets dangerously and notably close to population centers. Such a path may be a convenient and financially beneficial option for Sunoco, but it is an unacceptable risk for Pennsylvania’s citizens to bear.
About the Author: George Alexander publishes the Dragonpipe Diary (www.dragonpipediary.com), covering all aspects the Mariner East pipeline project, including technology, risks, legal issues, economics, and the people and groups involved. He recently retired from a career in journalism and marketing.
An earlier version of this essay was published in Mr. Alexander’s blog, Dragonpipe Diary, on June 29, 2018.
https://www.fractracker.org/a5ej20sjfwe/wp-content/uploads/2018/07/ME2-Dragonpipe-Map-Feature.jpg400900Guest Authorhttps://www.fractracker.org/a5ej20sjfwe/wp-content/uploads/2021/04/2021-FracTracker-logo-horizontal.pngGuest Author2018-07-20 13:32:312021-04-15 15:01:14Population density maps: Lessons on where NOT to put a pipeline
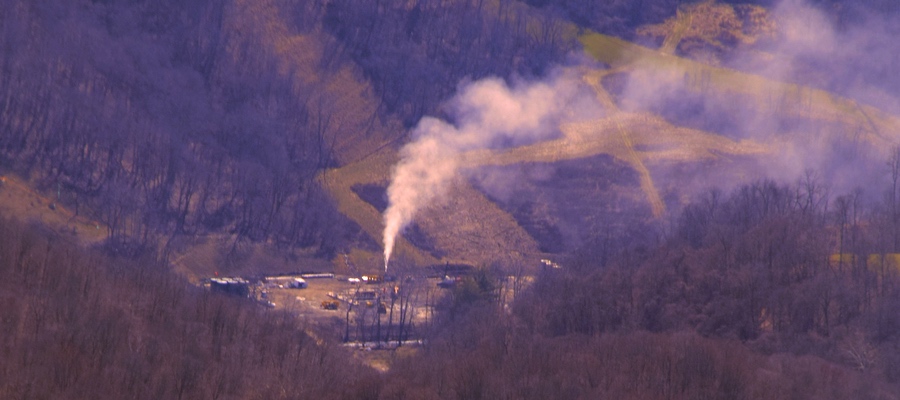
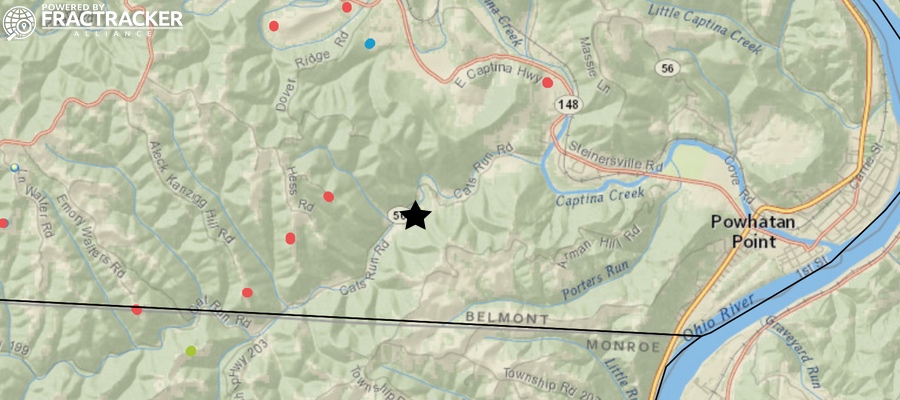
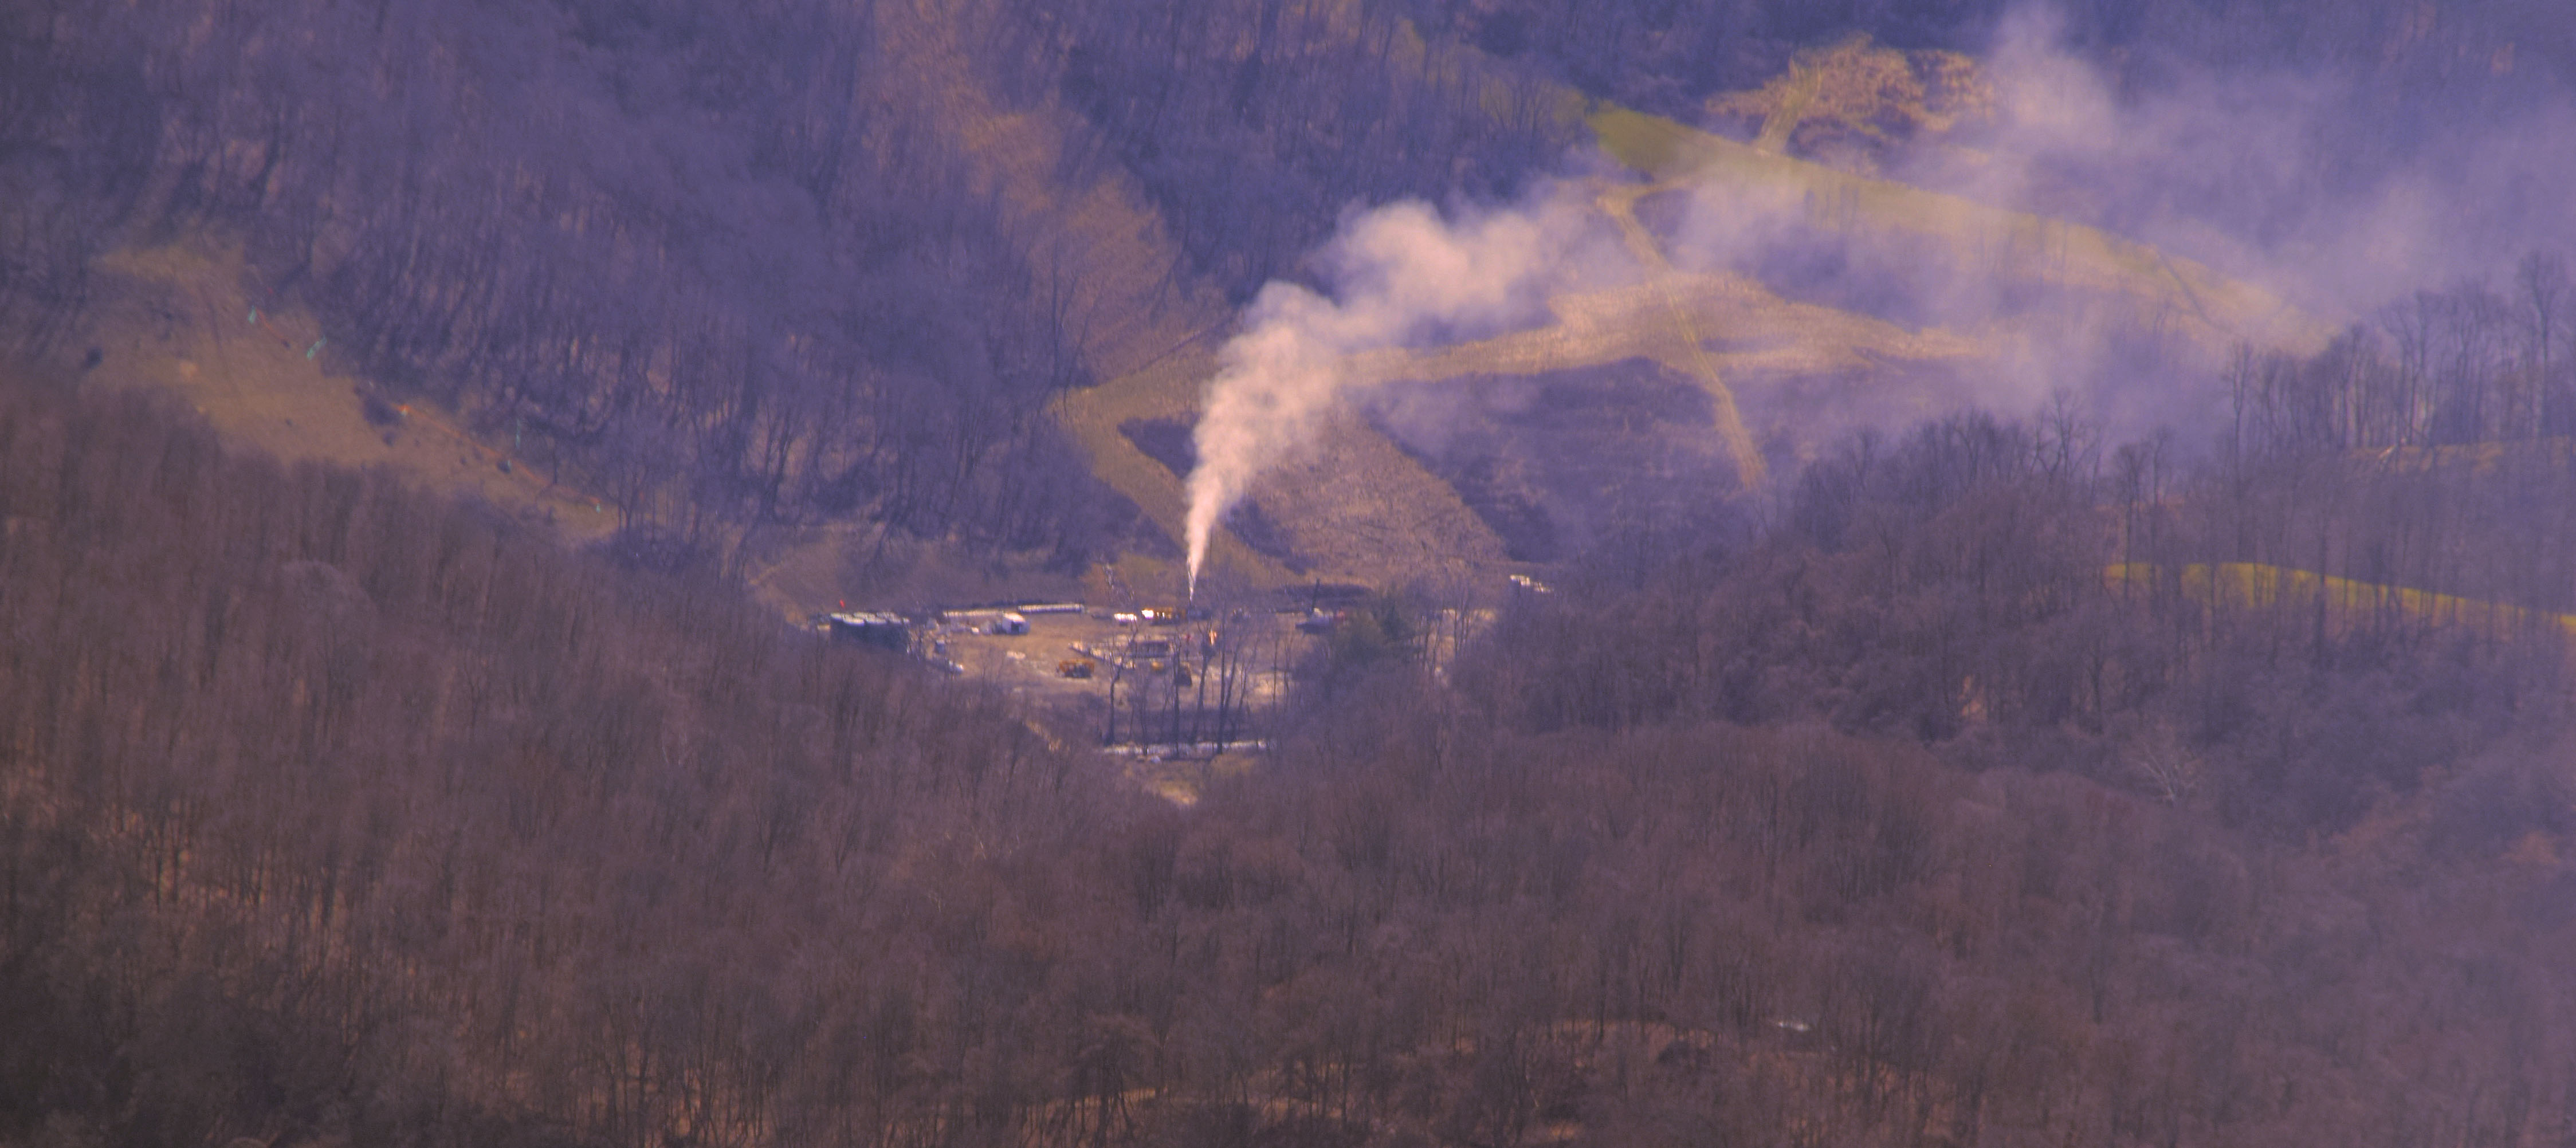
On February 15, 2018, officials evacuated residents after XTO Energy’s Schnegg gas well near Captina Creek exploded in the Powhatan Point area of Belmont County, Ohio. More than two weeks later, the well’s subsequent blowout has yet to be capped, and people want to know why. Here is what we know based on various reports, our Ohio oil and gas map, and our own fly-by on March 5th.
March 19th Update: This is footage of the Powhatan Point XTO Well Pad Explosion Footage from Ohio State Highway Patrol’s helicopter camera the day after the incident:
Powhatan Point XTO well pad explosion footage from Ohio State Highway Patrol
Cause of the Explosion
The well pad hosts three wells, one large Utica formation well, and two smaller ones. XTO’s representative stated that the large Utica well was being brought into production when the explosion occurred. The shut-off valves for the other two wells were immediately triggered, but the explosion caused a crane to fall on one of those wells. The representative claims that no gas escaped that well or the unaffected well.
Observers reported hearing a natural gas hiss and rumbling, as well as seeing smoke. The Powhatan Point Fire Chief reported that originally there was no fire, but that one later developed on the well pad. To make matters worse, reports later indicated that responders are/were dealing with emergency flooding on site, as well.
As of today, the Utica well that initially exploded is still releasing raw gas.
Map of drilling operations in southeast Ohio, with the Feb 15, 2018 explosion on XTO Energy’s Schnegg gas well pad marked with a star. View dynamic map
Public Health and Safety
No injuries were reported after the incident. First responders from all over the country are said to have been called in, though the mitigation team is not allowed to work at night for safety reasons.
The evacuation zone is for any non-responders within a 1-mile radius of the site, which is located on Cat’s Run Road near State Route 148. Thirty (30) homes were originally evacuated within the 1-mile zone according to news reports, but recently residents within the outer half-mile of the zone were cleared to return – though some have elected to stay away until the issue is resolved completely. As of March 1, four homes within ½ mile of the well pad remain off limits.
The EPA conducted a number of site assessments right after the incident, including air and water monitoring. See here and here for their initial reports from February 17th and 20th, respectively. (Many thanks to the Ohio Environmental Council for sharing those documents.)
Much of the site’s damaged equipment has been removed. Access roads to the pad have been reinforced. A bridge was recently delivered to be installed over Cats Run Creek, so as to create an additional entrance and exit from the site, speaking to the challenges faced in drilling in rural areas. A portion of the crane that fell on the adjacent wellhead has been removed, and workers are continuing their efforts in removing the rest of the crane.
The above video by Earthworks is optical gas imaging that makes visible what is normally invisible pollution from XTO’s Powhatan Point well disaster. The video was taken on March 3, 2018, almost 3 weeks after the accident that started the uncontrolled release. Learn more about Earthworks’ video and what FLIR videos show.
An early estimate for the rate of raw gas being released from this well is 100 million cubic feet/day – more than the daily rate of the infamous Aliso Canyon natural gas leak in 2015/16. Unfortunately, little public information has been provided about why the well has yet to be capped or how much gas has been released to date.
Bird’s Eye View
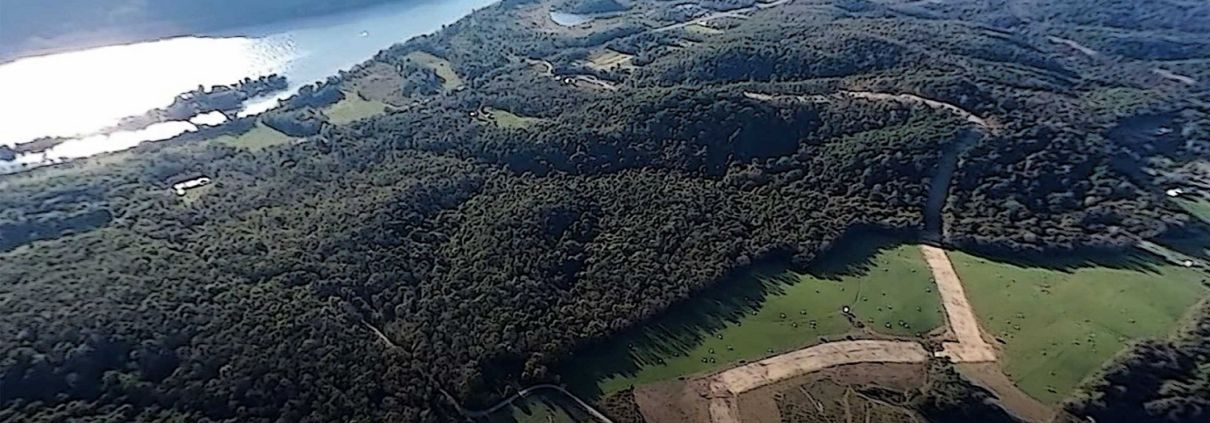
On February 26, a two-mile Temporary Flight Restriction (TFR) was enacted around the incident’s location. The TFR was supposed to lapse during the afternoon of March 5, however, due to complications at the site the TFR was extended to the evening of March 8. On March 5, we did a flyover outside of the temporary flight restriction zone, where we managed to capture a photo of the ongoing release through a valley cut. Many thanks to LightHawk and pilot Dave Warner for the lift.
XTO Energy well site and ongoing emissions after the explosion over two weeks ago. Many are still waiting on answers as to why the well has yet to be capped. Photo by Ted Auch, FracTracker Alliance, March 5, 2018. Aerial support provided by LightHawk
Additional resources
Per the Wheeling Intelligencer – Any local residents who may have been impacted by this incident are encouraged to call XTO’s claims phone number at 855-351-6573 or visit XTO’s community response command center at the Powhatan Point Volunteer Fire Department, located at 104 Mellott St. or call the fire department at 740-312-5058.
https://www.fractracker.org/a5ej20sjfwe/wp-content/uploads/2018/03/XTO-Incident-Feature.jpg400900FracTracker Alliancehttps://www.fractracker.org/a5ej20sjfwe/wp-content/uploads/2021/04/2021-FracTracker-logo-horizontal.pngFracTracker Alliance2018-03-06 15:53:362021-04-15 15:01:25Waiting on Answers Weeks after a Well Explosion in Belmont County Ohio
The head of Murray Energy Corporation, Robert Murray, is very close to the highest office in the land. Such an association demands a close look at the landscape from which this corporation and its founder arouse.
Belmont County, Ohio’s most famous tycoon Robert Murray has established a close relationship with the Trump administration. This connection dates back to his $300,000 contribution to Trump’s inauguration. The intimacy of this relationship has been given new weight recently when it was revealed that a hug between Mr. Murray and the Department of Energy’s Secretary Rick Perry preceded a meeting where Mr. Murray presented the administration with a memo outlining a 16-point plan for removing some of the burdensome regulations put in place by Mr. Murray’s least favorite person former President Barack Obama.
Among the few consistent themes from this most inconsistent of presidents has been a fondness for coal and steel, where brawny men do essential work and are threatened not by shifting economics, but by greenies and weenies who want to shut them down. Mr Trump and Mr Murray both want environmental rules rolled back—Mr Murray because it would be good for his bottom line, and Mr Trump because a second consistent aim of his presidency is to reverse anything done by Barack Obama. It is doubtful whether policy shifts alone could revive coal mining, but the attempt to do so says much about how vested interests operate in this administration… Mr Trump played a hard-nosed businessman on TV, but Mr Murray is the real thing. – The Economist, 2018
Not only has Mr. Murray succeeded in capturing the hearts and minds of the Trump administration, he has demanded that his $300,000 contribution get his longtime Oklahoman lawyer, and former aide to the senate’s chief climate skeptic James M. Inhofe of Oklahoma, the #2 spot behind Scott Pruitt at the EPA. Mr. Murray is so powerful that he managed to get Perry & Co. to fire the photographer that took the photo of the tender moment between Messrs. Perry and Murray.
Awkwardness aside, these situations could reasonably lead one to conclude that Perry and Pruitt are competing for Murray’s favor in the event they choose to run for higher office and need a patron with deep pockets. Mr. Murray would be in a real pickle if they both chose to run for the highest office in the land, with two fawning candidates potentially offering to one-up the other in terms of incentives and/or regulatory carve outs for Mr. Murray’s beloved King Coal.
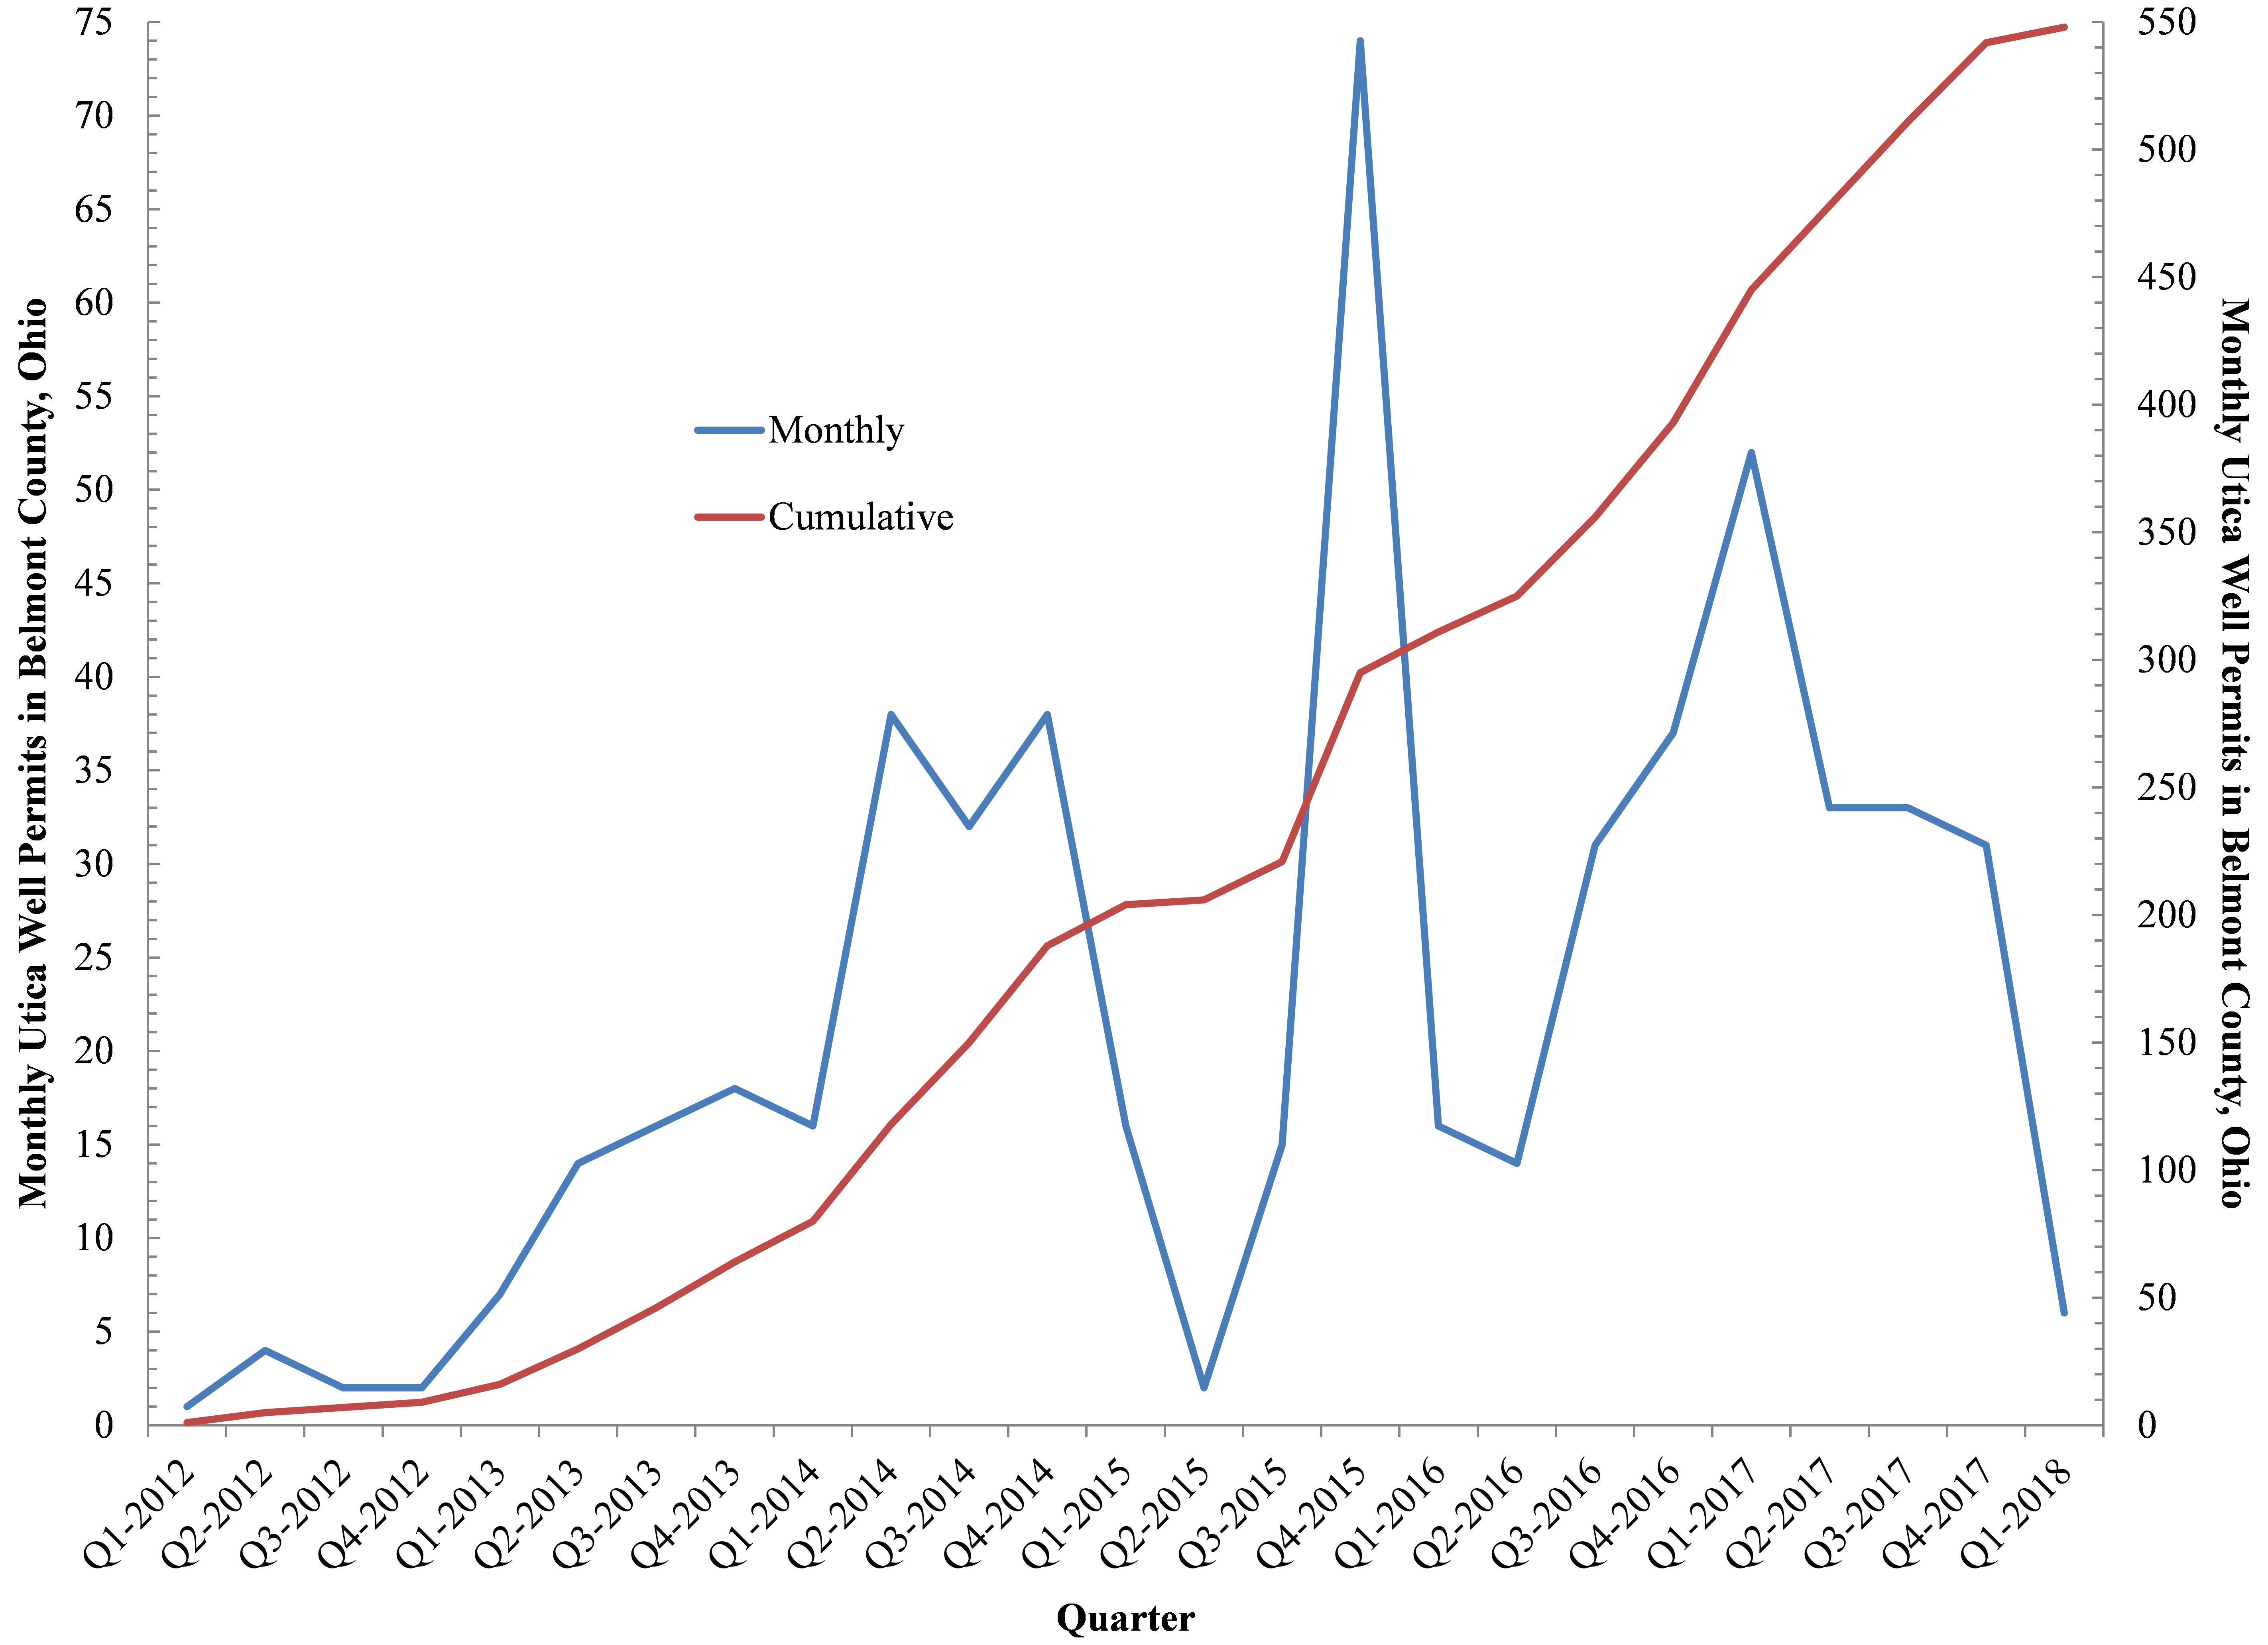
Once the heart of Ohio Coal Country, Belmont Co. is now a major player on the hydraulic fracturing landscape, as well.
Given the growing influence of Mr. Murray and the coal industry writ large we thought it was time to do a deep dive into how Mr. Murray’s Appalachian Ohio home county of Belmont and surrounding counties have been altered by coal mining. We were also interested in how the coal industry has come to interact with the hydraulic fracturing industry, which has drilled 542 Utica wells in Belmont County alone since March 2012. These wells amount to 20% of all fracked wells in Ohio as of January 2018. The rate at which Utica wells are being permitted in Belmont County is actually increasing by about 1.5 to 2 permits per month or 5.5 to 7.8 times the statewide average (Figure 1).
Belmont County also happens to be the “all-time leader in coal production in Ohio” having produced 825 million tons since 1816 (ODNR, 2005). All of this means that the Ohio county that produces the most coal is also now The Buckeye State’s most actively drilled county.
Figure 1. Monthly and cumulative hydraulically fractured wells in Belmont County, Ohio between Q1-2012 and Q1-2018
However, the days of coal’s dominance – and easily mineable coal – in Ohio appear to be coming to an end.
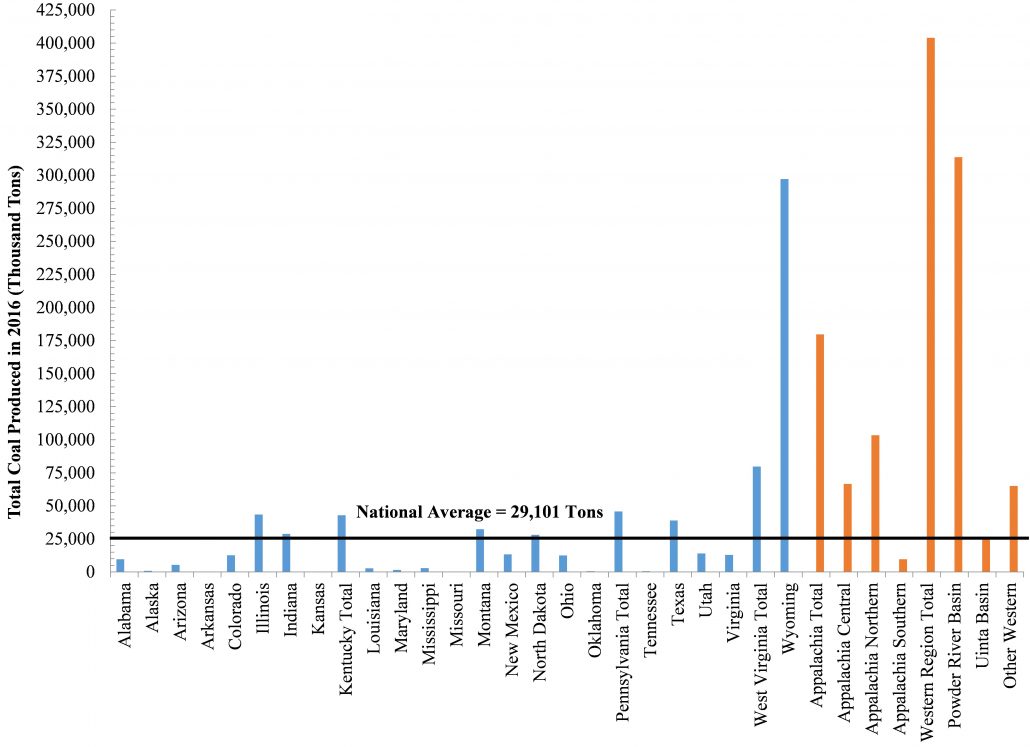
Per mine, Ohio’s mines produce about 30% of the national average and 43% of the state averages (Figure 2). Ohio’s mines only produce about 10% of what the mega Western mines produce on a per-mine basis, and much less than states like New Mexico and Texas, as well.
Even with automation, the barriers to a return of coal in Appalachia are formidable given that most of the easily recoverable coal has already been mined. Additionally, the landscape is more formidable and not as conducive to the large strip-mine and dragline operations of the Powder River Basin, which produce roughly 8.5 million tons of coal per mine, compared to an average of 330,000 tons per mine in Appalachia. (Figure 2).
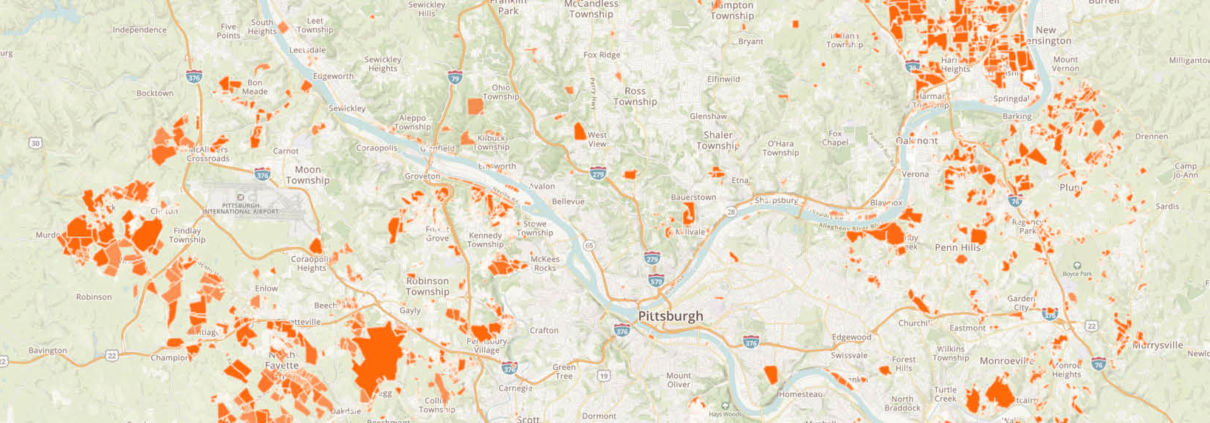
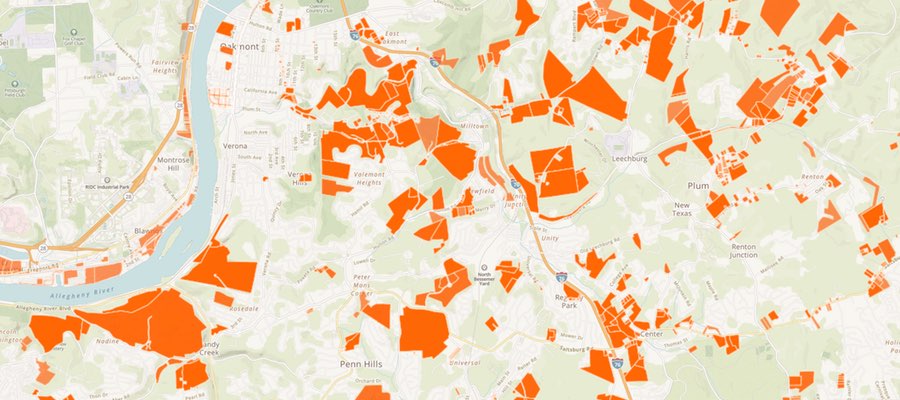
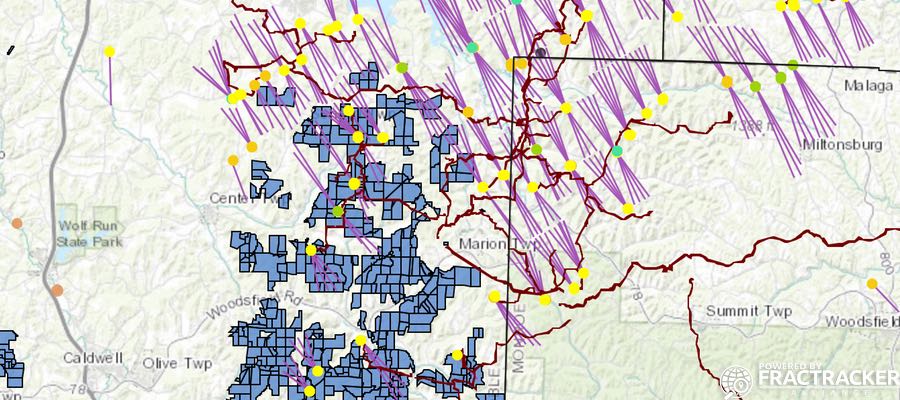
The below map depicts parcels owned by coal mining companies in the Ohio counties of Belmont, Noble, Guernsey, and Muskingum, as well as previously mined and/or potential parcels based on owner and proximity to existing mines.
We also incorporated production data (2001 to 2016) for 116 surface and strip coal mines in these and surrounding counties, natural gas pipelines, hydraulically fractured laterals, and Class II Salt Water Disposal (SWD) injection wells as of January 2018.
There are few areas in the United States where underground coal mining and fracking are taking place simultaneously and on top of each other. What could possibly go wrong when injecting massive amounts of fracking waste at high pressures into the geology below, while simultaneously pumping billions of gallons of water into hydraulically fractured laterals and mining coal at similar depths?
In the coming months and years we will be monitoring Belmont County, Ohio as an unfortunate case-study in determining the answer to such a unique question.
At the present time:
Murray Energy, its subsidiaries, and other coal companies own approximately 15% of Belmont County.
Coal companies and their associated real-estate firms and subsidiaries have mined or own approximately 5,615 square miles across the Noble, Belmont, Guernsey, and Muskingum counties.
The 116 mines in this map have mined an average of 3.22 million tons of coal since 2001 and more than 373 million tons in total. Mr. Murray’s mines account for 50% of this amount, producing nearly 15 times more coal per mine than the other 112 mines.
Collectively, these mines have contributed 1.09 billion tons of CO2 and CH4+N2O in CO2 equivalents to atmospheric climate change, or 68 million tons per year (MTPY). This volume is equivalent to the annual emissions of nearly 60 million Americans or 19% of the population.
Murray’s mines alone have contributed enough greenhouse gases (CO2+CH4+N2O) to account for the emissions of 9.2% of the US population since 2001. Each Murray mine is belching out 8.41 million tons of greenhouse gases per year or roughly equivalent to the emissions of 463,489 Americans.
Relevant data for this map can be found at the end of this article.
Broader Implications
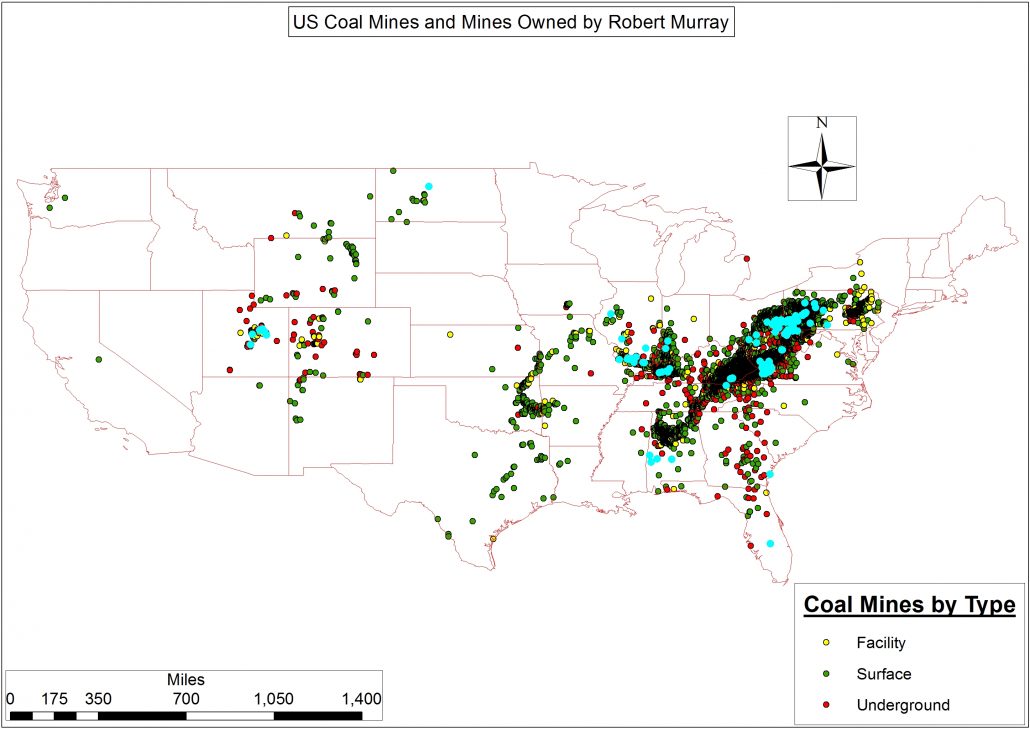
Robert Murray’s influence and mining impacts extend well beyond Appalachian Ohio.
Mr. Murray’s is the primary owner of 157 mines and associated facilities1 across eleven states – and five of the six major Lower 48 coal provinces – from Utah and North Dakota to Alabama, Georgia, and Florida (Figure 3). Mr. Murray likes to highlight his sage purchases of prime medium and high volatility bituminous coal real-estate over the years on his company’s website. However, nowhere in his corporate overview does he mention his most notorious mine: the abandoned and sealed underground Crandal Canyon Mine, Emery County, Utah. It was at this mine on August 6, 2007 that a collapse trapped six miners and resulted in their deaths, along with the deaths of three rescue workers. Mr. Murray told the BBC that he had had an emotional breakdown and hadn’t deserted anyone living in a little trailer adjacent to the mine’s entrance every day following the collapse. Furthermore, Mr. Murray blames such events on subsidiaries like Grenwal Resources Inc., which happens to be the owner of record for the Crandal Canyon Mine and is one of thirty-three unique subsidiaries owned by Mr. Murray (data download).
Figure 3. US Coal Mines by type and Mines Owned by Robert Murray highlighted in turquoise
Table 1. Robert Murray coal mine ownership by mine status
Status
Number of Mines
Abandoned
68
Abandoned and Sealed
62
Active
12
Non-Producing
10
Temporarily Idled
5
Total
157
The Politics of Energy
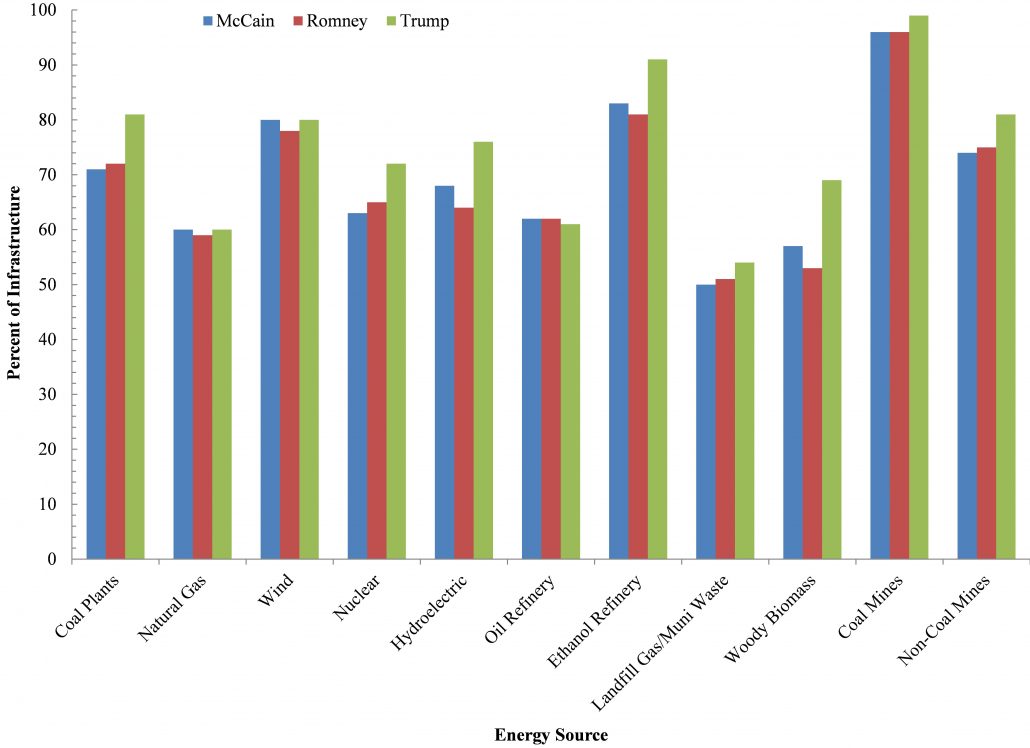
Robert Murray and his fellow fossil fuel energy brethren’s bet on Trump paid off, with Trump winning 99% of the vote in congressional districts where coal mines exist (Figure 4). Such a performance bested the previous GOP candidates of McCain and Romney even though they had achieved an impressive 96% of the vote. Interestingly, Trump did nearly as well in congressional districts dominated by wind farms and ethanol refineries where more than 87% of the electorate was white.
Figure 4. Presidential election results for GOP candidates in voting districts where various forms of energy are produced and/or processed, 2016, 2012, and 2008
Trump & Co. promised these districts that his administration would breathe life into the fossil fuel industry. True, Trump, Pruitt, Perry, and Interior Secretary Ryan Zinke are greasing the skids for the industry’s revival. In terms of annual production, however, it is far from certain that such moves will translate into the types of boost in employment promised by Trump during the 2016 campaign. Even if production does return, executives like Murray admit that the advent of efficiencies and extraction technologies means that the industry is mining more coal per miner than ever before:
“Trump has consistently pledged to restore mining jobs, but many of those jobs were lost to technology rather than regulation and to competition from natural gas and renewables, which makes it unlikely that he can do much to significantly grow the number of jobs in the industry,” said Murray. “I suggested that he temper his expectations. Those are my exact words,” said Murray. “He can’t bring them back.” – The Guardian, March 27, 2017
Conclusions and Next Steps
It remains to be seen how the coal mining and fracking industry’s battle for supremacy will play out from a socioeconomic, health, environmental, and regulatory perspective. While many people understand that coal jobs aren’t coming back, we shouldn’t doubt the will of the Trump administration and friends like Robert Murray to make sure that profits can still be extracted from Appalachia.
Will the fracking industry and coal barons agree to get along, or will they wage a war on multiple fronts to marginalize the other side? Will this be another natural resource conflagration? If so, how will the people – and species like the “near-threatened” Hellbender Salamander (Cryptobranchus alleganiensis) or the region’s recovering Bald Eagle (Haliaeetus leucocephalus) population that live in the disputed Appalachian communities respond? How will their already stressed day-to-day existence be affected? To this point, the fossil fuel industry has managed to blame everyone but itself for the tepid to non-existent job growth in their sectors.
The Appalachian landscape has been deeply scarred and fragmented by coal mining, and now it is experiencing a new colonizing force in the form of the hydraulic fracturing industry. When Appalachia realizes that automation, globalization, and natural gas, are the key drivers to the downfall of coal, will they bring fire, brimstone, and pitchforks to the doorstep of Murray Energy of the fracking companies? Or is Appalachia’s future merely that of an extraction colony?
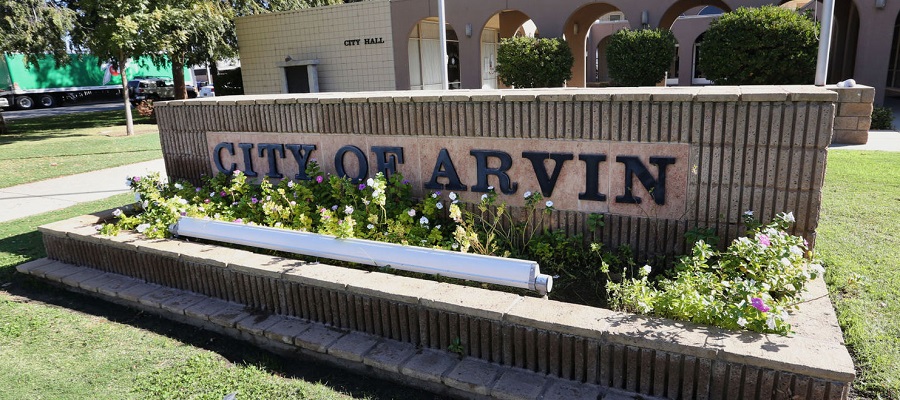
The City of Arvin, with a population of about 20,000, is located in Kern County, California just 15 miles southeast of Bakersfield. Nicknamed ‘The Garden in the Sun,’ Arvin is moving forward with establishing new regulations that would limit oil and gas development within the city limits.
Setback Map
The new ordinance proposes setback distances for sensitive sites including hospitals and schools, as well as residentially and commercially zoned parcels. The proposal establishes a 300-foot buffer for new development and 600’ for new operations.
In the map below, FracTracker Alliance has mapped out the zoning districts in Arvin and mapped the reach of the buffers around those districts. The areas where oil and gas well permits will be blocked by the ordinance are shown in green, labeled “Buffered Protected Zones.” The “Unprotected Zones” will still allow oil and gas permits for new development.
There are currently 13 producing oil and gas wells within the city limits of Arvin, 11 of them are located in the protected zones. Those within the protected zones are operated by Sun Mountain Oil and Gas and Petro Capital Resources. They were all drilled prior to 1980, and are shown in the map below.
Information on the public hearings and proposals can be found in the Arvin city website, where the city posts public notices. As of January 24, 2018, these are the current documents related to the proposed ordinance that you will find on the webpage:
In December of 2016, Committee for a Better Arvin, Committee for a Better Shafter, and Greenfield Walking Group, represented by Center for Race, Poverty and the Environment, sued Kern County. The lawsuit was filed in coordination with EarthJustice, Sierra Club, Natural Resources Defense Council, and the Center for Biological Diversity.
The Importance of Local Rule
Self-determination by local rule is fundamental of United States democracy, but is often derailed by corporate industry interests by the way of state pre-emption. There is a general understanding that local governments are able to institute policies that protect the interests of their constituents, as long as they do not conflict with the laws of the state or federal government. Typically, local municipalities are able to pass laws that are more constrictive than regional, state, and the federal government.
Unfortunately, when it comes to environmental health regulations, states commonly institute policies that preserve the rights of extractive industries to access mineral resources. In such cases, the state law “pre-empts” the ability of local municipalities to regulate. Local laws can be considered the mandate of the people, rather than the influence of outside interest on representatives. Therefore, when it comes to land use and issues of environmental health, local self-determination must be preserved so that communities are empowered in their decision making to best protect the health of their citizens.
https://www.fractracker.org/a5ej20sjfwe/wp-content/uploads/2018/01/Arvin_bakersfield_re.jpg400900Kyle Ferrar, MPHhttps://www.fractracker.org/a5ej20sjfwe/wp-content/uploads/2021/04/2021-FracTracker-logo-horizontal.pngKyle Ferrar, MPH2018-01-30 11:59:072021-04-15 15:01:28Arvin, CA – a City in the Most Drilled County in the Country – files for a Setback Ordinance


