Marcellus Shale violations issued by the Pennsylvania DEP from January through April, 2011.
Violation information from April was recently posted on the Department of Environmental Protection (DEP) website, and two new violations datasets have been posted on our DataTool as well, including:
As the titles indicate, these datasets contain inspection and enforcement data in addition to violations, which allow us to take a closer look at both violations per inspection and enforcements actions per violation.
Violations per Inspection
Marcellus Shale violations per inspection, 2010. For a dynamic, zoomable view, please click the map.
[map archived] Marcellus Shale violations per inspection, January through April 2011
In 2010, Marcellus Shale wells in the northeastern portion of the state had a noticeably higher number of violations per inspection than the southwest. This trend is less pronounced so far in 2011. I should point out that since each inspection on this report lead to at least one violation, it is more accurate to think of this category as “violations per inspection yielding violations”, a cumbersome but significant distinction.
Enforcements per Violation
Marcellus Shale enforcement actions per violation, 2010
[map archived]
Marcellus Shale enforcement actions per violation, January through April, 2011
While the northeastern portion of Pennsylvania has a higher number of violations issued per inspection, the southwest has a higher number of enforcement actions, a category which includes fines and other restrictions imposed on drilling operators by the DEP. This trend seems to continue into 2011, with relatively minor changes in distribution.
https://www.fractracker.org/a5ej20sjfwe/wp-content/uploads/2021/04/2021-FracTracker-logo-horizontal.png00Matt Kelso, BAhttps://www.fractracker.org/a5ej20sjfwe/wp-content/uploads/2021/04/2021-FracTracker-logo-horizontal.pngMatt Kelso, BA2011-05-31 15:14:002020-07-21 10:37:59Marcellus Shale Violations per Inspection and Enforcements per Violation
Fire in Hopewell Township PA,
Southwestern PA on 3-31-10
Earlier this week, a Pennsylvania Senate committee approved a bill that would require natural gas drilling companies to provide emergency response information to local authorities. Here are the key requirements of drilling companies that are being proposed:
Post emergency response information at each well site
Register distinct geographic coordinates for each drilling site with the PA Department of Environmental Protection and local authorities
File response plans with the local authorities, local 911 center, PA DEP, and PA Emergency Management Agency
Inadequate data transparency of this type has been a significant public health concern ever since natural gas drilling first began in the Marcellus Shale region in PA.Marcellus Shale sites are often drilled in rural, remote areas without exact location information or clear emergency plans. If passed into law, this legislation stands to decrease the response time in the event of an emergency at a well site, reducing the impact that drilling incidents may have on public health and the environment.
To demonstrate why improving the quality and expediency of emergency response to shale gas drilling incidents is an important endeavor, below is a map created on FracTracker’s DataTool showing only the location of violations issued by the PA DEP in 2010 to companies that were drilling into the Marcellus Shale layer. If you press “Click to see more details on this map,” you can use the DataTool to filter the dataset even further in order to see which of these violations was an environmental health and safety violation, not just administrative in nature:
(Darker diamonds indicate there was more than one violation issued in that area. Zoom in to learn more.)
https://www.fractracker.org/a5ej20sjfwe/wp-content/uploads/2021/04/2021-FracTracker-logo-horizontal.png00FracTracker Alliancehttps://www.fractracker.org/a5ej20sjfwe/wp-content/uploads/2021/04/2021-FracTracker-logo-horizontal.pngFracTracker Alliance2011-05-25 18:25:002020-07-21 10:37:59Data Transparency Bill Will Aid Emergency Response
Year to date drilled wells in Pennsylvania. Click the map for a larger, dynamic view.
I have updated the 2011 drilled wells information on FracTracker’s DataTool. There are several interesting trends to point out, including:
Percentage of wells from the Marcellus Shale formation
Drilling operator trends
Non Marcellus horizontal well data
Marcellus Shale and Other Formations
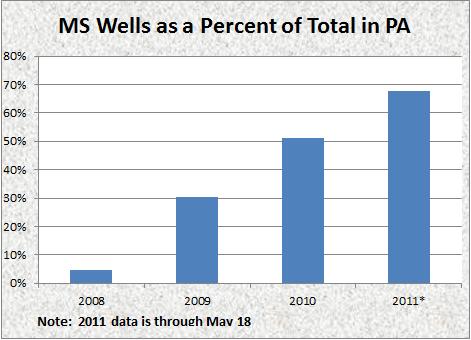
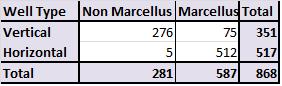
So far in 2011, 587 Marcellus Shale wells have been drilled in Pennsylvania, compared to only 281 from other formations. This means that for the first time, Marcellus wells account for over two thirds of the drilling activity statewide.
In less than three and a half years, the Marcellus Shale went from representing 5% of all oil and gas wells drilled in Pennsylvania to 68%.
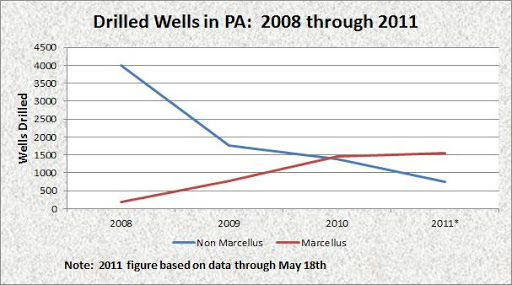
Drilling trends over time in Pennsylvania.
While part of the reason for the Marcellus Shale’s increased prominence in the oil and gas industry in Pennsylvania is that activity in the formation is rapidly increasing, it is also true that activities in other formations are decreasing rather dramatically.
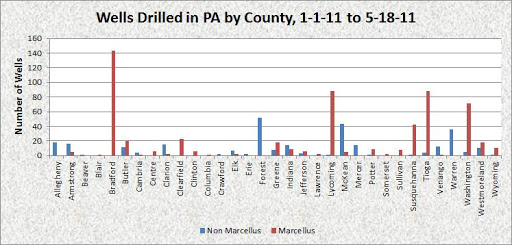
We can also take a look at drilling activity by county for both Marcellus Shale and other oil and gas wells.
Marcellus Shale and other wells drilled to date in 2011 by county.
Much of the above chart has to do with where the hydrocarbon resources are. It is interesting to note though, that the county with the most Marcellus wells (Bradford) has no wells in other formations, and that the county with the most non Marcellus wells (Forest) has no Marcellus wells at all.
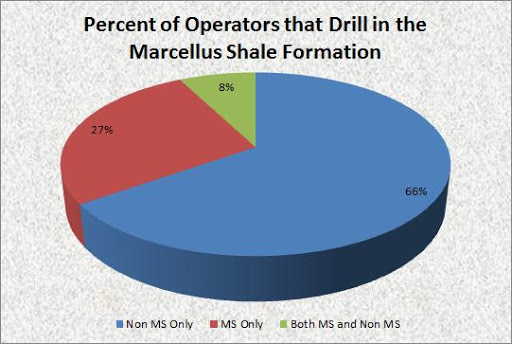
Drilling Operators and the Marcellus Shale
Of the 91 operators that have drilled oil and gas wells so far this year in Pennsylvania, 60 had no Marcellus Shale wells, 25 had only Marcellus Shale wells, and seven had wells in both categories.
Most operators drill in either the Marcellus Shale or other formations, but not both.
There is surprisingly little overlap in this chart. But what about the operators with wells in both categories?
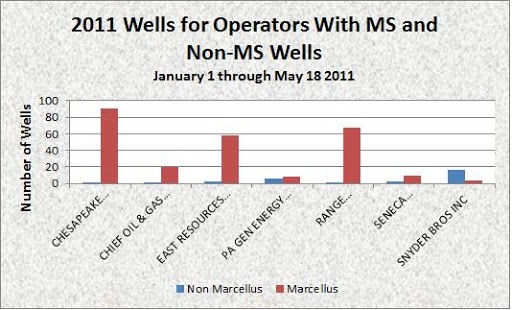
Marcellus and non Marcellus wells for operators with both categories in 2011.
Even still, most of the operators specialize in one kind or the other. Taken together, these two charts show that operators which drill in the Marcellus Shale are specialists, with very few wells drilled in other formations.
Non Marcellus Horizontal Wells
It is well known that the combination of hydraulic fracturing and horizontal drilling techniques allowed for the profitable extraction of natural gas from the Marcellus Shale. For that reason, it isn’t surprising that most of the Marcellus wells are drilled horizontally. What is interesting is that the technique is now being used in other formations as well.
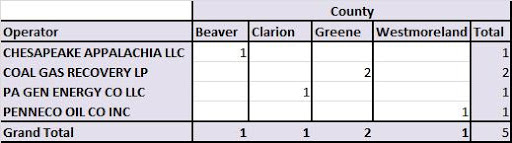
Five Non Marcellus Shale wells have been horizontally drilled so far in 2011.
Non Marcellus horizontal wells so far in 2011.
There isn’t much of a trend in which companies drilled these five wells, with two of the companies active in the Marcellus Shale and two of them not. Spatially, all four of the counties are in the western portion of the state, with Clarion County somewhat to the north of the other three.
https://www.fractracker.org/a5ej20sjfwe/wp-content/uploads/2021/04/2021-FracTracker-logo-horizontal.png00Matt Kelso, BAhttps://www.fractracker.org/a5ej20sjfwe/wp-content/uploads/2021/04/2021-FracTracker-logo-horizontal.pngMatt Kelso, BA2011-05-18 12:42:002020-07-21 10:37:59Year to Date Drilling Activity in Pennsylvania
In yesterday’s Post-Gazette, Don Hopey discussed an analysis by PennFuture which saw a notable decline in fines in the first quarter of 2011, as compared to the same period last year. The implication is that the DEP is not backing up violations with fines under Governor Corbett’s administration to the same degree that it did under former Governor Rendell. In the former administration, PennFuture calculated an enforcement action was handed out for every 1.7 violations, and now the rate is one per every 8.7 violations.
I think this is a worthwhile trend to keep an eye on, with the caveat that it is still early in Governor Corbett’s tenure, and that violation data varies widely from month to month.
It is also possible that the DEP under the Corbett administration will still issue fines for significant events. In fairness, I came across this article of fines issued over eight months after an incident by the DEP under Rendell. I think we need more time to see if the new administration’s patterns of reduced fines per violation hold.
That said, Marcellus Shale fines and enforcements under the Rendell administration is hardly a sensible target for comparison. The fines issued in 2010 were at once paltry and erratic.
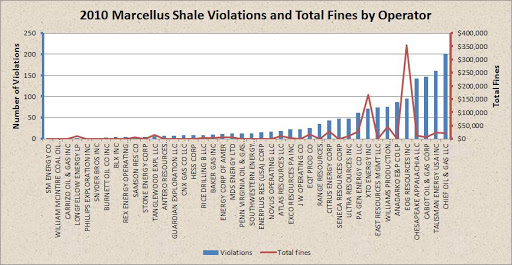
Industry sources indicate that Marcellus Shale wells cost between $5 million to $6.4 million to drill. Last year in Pennsylvania, there were 1,454 Marcellus Wells drilled in the Commonwealth, meaning that the total cost of operations for the year for the industry is somewhere in the mind-boggling range of $7.2 billion to $9.3 billion. How much of that cost was fines issued by the DEP? $775,650.22. Even using the conservative figure of $5 million per well, DEP fines only account for 0.01 percent of operating costs–hardly any impediment at all. In essence, with the change in administration the DEP went from collecting fines in Monopoly money to asking drilling operators to sit down for a while and think about what they’ve done.
Over 45 percent of the fines issued for the Marcellus Shale in 2010 went to EOG Resources, the operator for a major blowout in Clearfield County. That was far from the only major incident in 2010, but the DEP was clearly mad about the incident, posting an entire section about the incident on their website. The $353,400 fined to EOG for this incident went to cover the DEP’s cost of response and investigation.
The two operators with the highest fines issued for Marcellus Shale operation in 2010 are toward the top of companies with the largest number of violations per year. That said, those companies at the very top were fined a significantly lower amount.
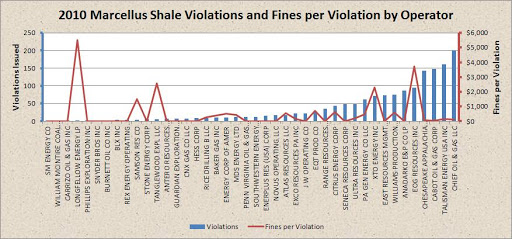
When we look at fines per violation, in addition to the same two operators that stood out in the last graph, we see several companies with relatively few violations having a significant number of fines per violation.
From an outside perspective, it is difficult to determine what sorts of factors go into whether or not a fine is issued, and if so, for how much. If the goal is simply to recoup costs of the DEP response and investigation, one wonders why there isn’t a fine more often, since every violation issued costs the DEP some resources to evaluate, process, and issue. And if fines are to act as a deterrent, they should include punitive damages, not just actual costs.
Keep in mind that the $7.2 billion to $9.3 billion range is just for Marcellus Shale wells, which last year represented about half of all oil and gas wells drilled in Pennsylvania. The industry is huge. One way we could have the oil and gas industry benefit all Pennsylvanians is by paying for the expenses of their DEP oversight, through permit fees and fines. That taxpayer savings could then be applied to other programs to help address the overall budget issue. Such an arrangement would be a huge boon to Pennsylvania, and while they might complain, the industry would barely notice if their cost per well went up by a few thousand dollars. Such an arrangement would also allow for the DEP to keep up with a rapidly expanding industry in a time of fiscal austerity that is sweeping the Commonwealth, and the nation as a whole.
Other sources, such as the Marcellus Drilling News report higher fine totals, but that includes a broader time frame. See Sean Hamill’s Post-Gazette article.
https://www.fractracker.org/a5ej20sjfwe/wp-content/uploads/2021/04/2021-FracTracker-logo-horizontal.png00Matt Kelso, BAhttps://www.fractracker.org/a5ej20sjfwe/wp-content/uploads/2021/04/2021-FracTracker-logo-horizontal.pngMatt Kelso, BA2011-05-16 14:55:002020-07-21 10:37:582010 Fines for Marcellus Shale Violations
Today we will be hosting Webinar #7 in the FracTracker training series. This afternoon’s webinar will cover the various programs working in collaboration with the the FracTracker system, a quick piece about the Data Index, and changes to the blog that are coming soon. If you can’t make the webinar, the recording will be available online after the event here.
Webinar Details
Date: Monday, May 16, 2011
Time: 12:00 pm, Eastern Daylight Time (New York, GMT-04:00)
Meeting Number: 646 482 139
Meeting Password: FTwebinar7
To View & Listen to the Webinar Using Your Computer
If you have not participated in any of our previous webinars, please click here to make sure you can view UCF (Universal Communications Format) rich media files prior to the launch of the session today.
For questions concerning this meeting, please contact Samantha Malone in advance of the scheduled meeting time at: slm75@pitt.edu.
IMPORTANT NOTICE: The WebEx service includes a feature that allows audio and any documents and other materials exchanged or viewed during the session to be recorded. By joining this session, you automatically consent to such recordings. If you do not consent to the recording, do not join the session.
Just last week, PennEnvironment released a new study, In the Shadow of the Marcellus Boom, at press conferences in Scranton and Pittsburgh, plus a national teleconference. The report looks at the proximity of schools, hospitals and day care facilities to permitted Marcellus Shale gas wells. Their aim was to demonstrate the risks of shale gas extraction to vulnerable populations. Press release.
Below is a map of the day care, school and hospital facilities located within 2 miles of a permitted Marcellus well site:
Instructions:
Use the legend to toggle the information displayed on the map on or off.
Select an area of interest using the zoom bar in the lower-left corner plus the hand tool to pan, or use the zoom selection tool.
To obtain information about any point on the map, select the “i” tool in the gray toolbar and click on a point of interest. Click again within the dialog box to drill down and see more details for each point.
You can toggle between terrain, satellite, and street view with the buttons on the lower right of the map.
https://www.fractracker.org/a5ej20sjfwe/wp-content/uploads/2021/04/2021-FracTracker-logo-horizontal.png00FracTracker Alliancehttps://www.fractracker.org/a5ej20sjfwe/wp-content/uploads/2021/04/2021-FracTracker-logo-horizontal.pngFracTracker Alliance2011-05-10 13:20:002020-07-21 10:37:57New Report: In the Shadow of the Marcellus Boom
Do you want to help prevent pollution from Marcellus Shale Development in your community? Our visual assessment training provides information on permit tracking, air and water pollution, using FracTracker, safety, and filing a complaint with DEP.
When: May 19, 2011 from 6:00 to 9:00 PM Where: Bridgeside Point Building, 100 Technology Drive, Pittsburgh, PA 15219
For more information about the training, please contact Veronica with Mountain Watershed Association: 724-455-4200 (ext. #4), veronica@mtwatershed.com. Learn more about the project here.
Changes Over TimeEvery time I think about the number of violations issued by the Pennsylvania Department of Environmental Protection (DEP) Bureau of Oil and Gas Management, I am struck on the one hand by the sheer magnitude of them–last year, the DEP issued 2,704 violations(1), a number that everyone would like to see go way down in the years ahead. On the other hand, at least that means the DEP is paying attention. It is with this spirit that I delved into the numbers, hoping to find patterns either in time or space.
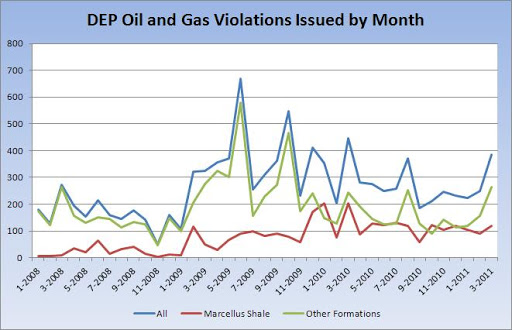
The DEP has only occasionally issued more Marcellus Shale violations per month than for other combined oil and gas formations.
The monthly issuance of violations is surprisingly erratic in a industry that is accelerating drilling activity steadily, especially for the Marcellus Shale. Once we look at the data on an annual basis, though, a clearer picture begins to emerge.
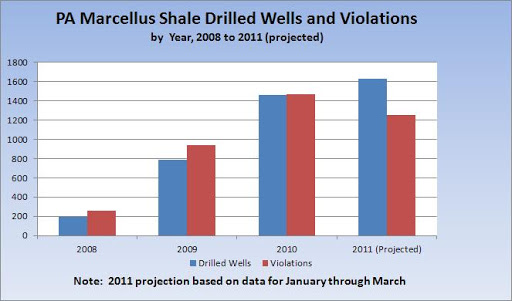
Based on a projection from the first quarter of 2011, this year will be the first year with more new Marcellus Shale wells drilled than DEP violations issued.
The number of drilled Marcellus Shale wells in Pennsylvania has been growing rapidly since the first well was drilled in 2006. Violations have been on the rise as well, but if the projections for 2010 hold true, there will actually be fewer violations this year than last year, despite the fact that there will be more Marcellus wells drilled. Again, due to the erratic nature of violations issued per month, such a projection should be taken with a grain of salt. On the other hand, it does fit with the long term trend of Marcellus Shale violations issued per wells drilled for the same calendar year.
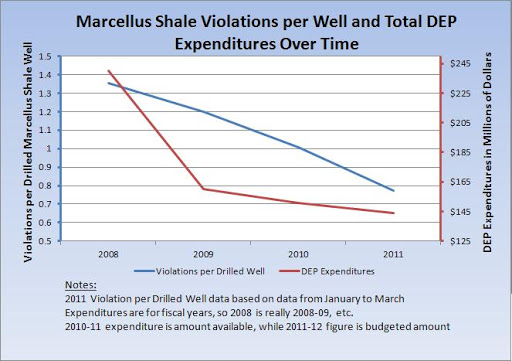
The number of Marcellus Shale violations per well has been decreasing over time, as has the budget of the Pennsylvania Department of Environmental Protection.
This graph is an attempt to look into the issue of whether the trend of decreasing violations per well might be due to DEP budget(2) issues rather than an overall increase in compliance by the industry. While this graph does not answer the question, it does lend the notion credibility.
Variance by DEP Region
Although there are six DEP regions, the Bureau of Oil and Gas is active out of three of them: the Northwest Regional Office (NWRO), the Southwest Regional Office (SWRO), and the North Central Regional Office (NCRO). All oil and gas activity in other portions of the state are included with the NCRO, giving them by far the largest territory to cover.
Violations per Well
Marcellus Shale violations per well by issuing DEP region. Click on the map for a larger, dynamic view.
The NCRO issued more than three times as many violations per Marcellus Shale well in 2010 than either of the other two regional offices. This is despite having the largest territory, and, as it turns out, the heaviest Marcellus Shale workload (3).
Violations per Inspection
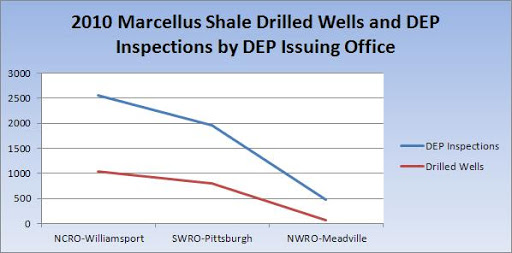
DEP workload by region.
Number of Marcellus Shale inspections and wells drilled in 2010 by DEP Region.
Each DEP Oil and Gas Region had at least twice as many inspections as new drilled wells for the Marcellus Shale in 2010.
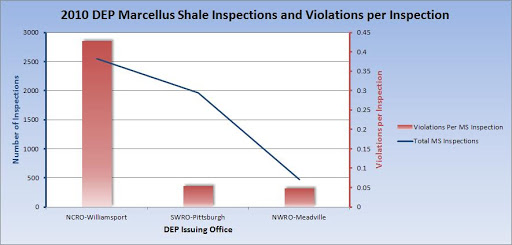
Marcellus Shale violations per inspection by issuing DEP region. Click the image for a larger, dynamic view.
The North Central Regional Office issued over eight times as many violations per inspection for Marcellus Shale wells as either of the other two DEP offices in 2010, despite the heaviest Marcellus Shale inspection workload.
Enforcement
The NCRO issued more than twice as many enforcement actions per inspection for Marcellus Shale wells than either the SWRO or NWRO in 2010.
As a quick review of the numbers for the Marcellus Shale from 2010, the NCRO compares to the other regions by issuing more than:
Three times as many violations per well
Eight times as many violations per inspection
Two times as many enforcement actions per inspection
The DEP briefly entertained the notion of centralizing violations and enforcement actions of Marcellus Shale wells. One wonders whether the end result would have been to reduce the vigilance of the NCRO, or whether the SWRO and NWRO would be instructed to catch up with their sibling. Indeed, either course of action could occur, even without Secretary Krancer’s direct approval of such actions.
Operators Active in Multiple Regions
Although the violation and enforcement numbers of the NCRO above are already convincing, there is another variability that could potentially skew the data: drilling operators. Some of the better operators in terms of violations per well such as Consol and Range Resources are active primarily in the SWRO’s jurisdiciton. Could it be that the NCRO just has more bad apples than the other two regions?
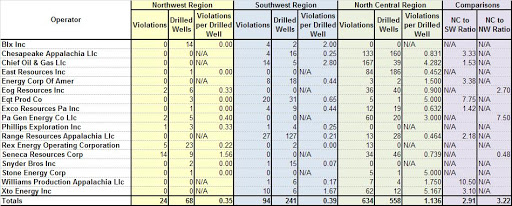
To answer this, I narrowed the list of Marcellus Shale operators from wells drilled in 2010 to those active in more than one region, the results of which are below.
There were 17 drilling operators that drilled Marcellus Shale wells in more than one DEP oil and gas region in 2010.
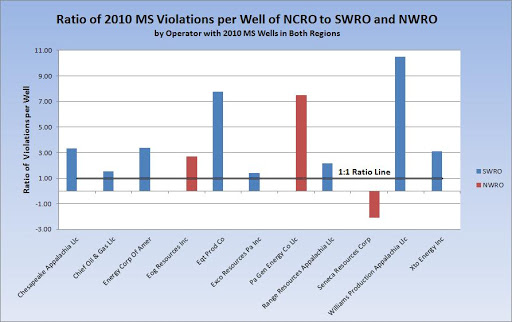
Even when we limit the field to the eleven operators active in the NCRO and one of the other districts, we once again see that the North Central Regional Office issued about three times as many violations per well as did the others.
Drilling operators with at least one 2010 Marcellus Shale well in the NCRO as well as either the SWRO or NWRO. Seneca Resources is the only instance where there were fewer violations issued in the NCRO than elsewhere.
It seems difficult to imagine that the geology in the NCRO jurisdiction is really that much more challenging to work with than the rest of the state. Short of that, I cannot speculate on a reason for the consistently stark contrast in violation and enforcement patterns other than to suggest that the North Central Regional Office is run with a culture of vigilance that is unmatched by their counterparts in the Southwest and Northwest.
The goal should be for the industry to achieve a greater level of compliance with Pennsylvania’s environmental laws, not to see a greater number of violations. At the same time, every person deserves to know that he or she is being aggressively protected from an industry that can be very dangerous and polluting. Undoubtedly, there is a lot that goes into the inspection process beyond the issuance of violations and enforcement actions, and the numbers can only go so far in providing a description of events on the ground. Nonetheless, those numbers are striking and consistent in showing a North Central Regional Office that takes a no-nonsense approach to its efforts of regulating the Marcellus Shale industry, at least as compared to either the Southwest Regional Office and Northwest Regional Office.
I would have rather compared violations to the Bureau of Oil and Gas budget, but it is not separated in that fashion within the budget reports.
The NCRO does have the smallest overall workload, but this blog is focused on the Marcellus Shale.
https://www.fractracker.org/a5ej20sjfwe/wp-content/uploads/2021/04/2021-FracTracker-logo-horizontal.png00Matt Kelso, BAhttps://www.fractracker.org/a5ej20sjfwe/wp-content/uploads/2021/04/2021-FracTracker-logo-horizontal.pngMatt Kelso, BA2011-05-04 11:04:002020-07-21 10:37:57Issuance of PA Marcellus Shale Violations Over Time and by DEP Region