Logbook FracTracker Postcard Front

Summer Summary of the Trail Logbook Project

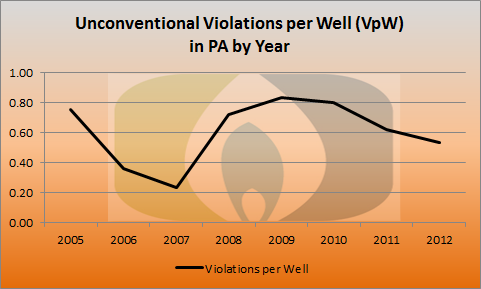
As summer transitioned into fall, and as winter knocks on our doorsteps in PA, I would like to take some time to summarize the preliminary feedback coming in through our pilot Trail Logbook Project. The project, for those of you who aren’t familiar, is a collaboration between Keystone Trails Association (KTA) and FracTracker Alliance. With the expansion of unconventional natural gas extraction into our state forests, we wanted to understand the experiences of people who are using those areas for recreation – and to document the change in those experiences as drilling continues. Most of the results of the project so far indicate that drilling is having a small, but notable effect on the traditionally tranquil experiences of hikers, bikers, and the like across the Commonwealth. The most common complaints are those of noise and degradation of scenery (see complete list ofLogbook reports below, or trail alerts on KTA’s website). Some people who entered information into the Logbook have noted that gas-drilling opponents have actually contributed to the degradation of the local scenery with graffiti and protest signs.

Given the number of hikers and other outdoor enthusiasts that frequent the Commonwealth every year, we need more people to report back to us in order to make a comprehensive and accurate statement about the overall impacts that drilling may be having on some of PA’s most beautiful natural resources. Perhaps there are no more issues to report, or perhaps people just don’t know who to tell. Regardless, we hope to expand our efforts to promote the project, which includes working with trail organizations in other states where shale gas activities may conflict with trail use.

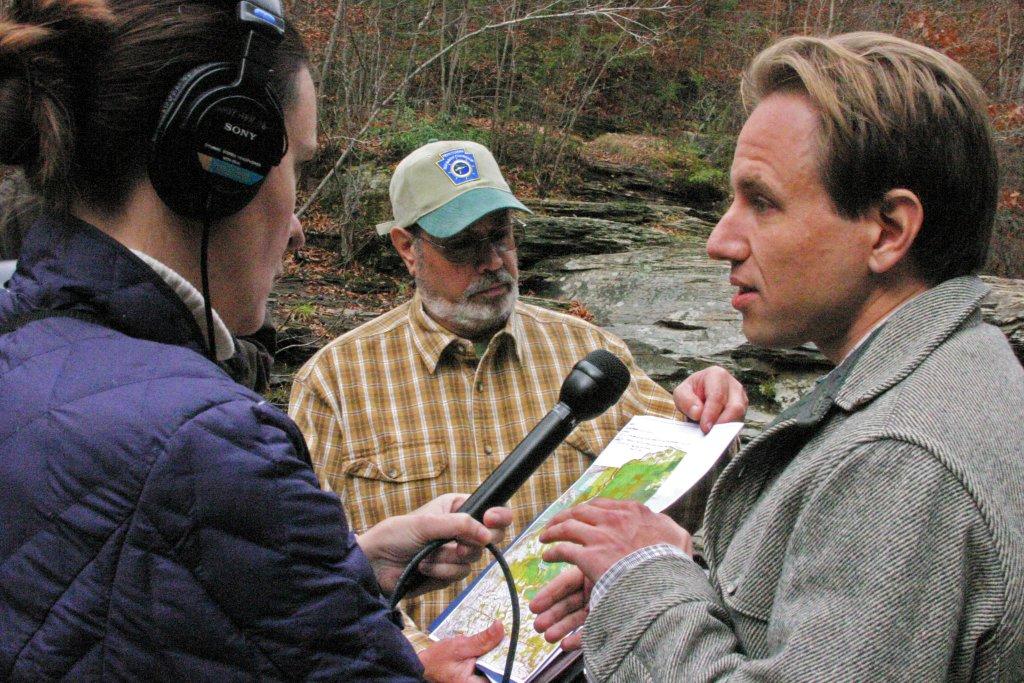
On a side note, the lack of awareness about the Logbook and the state of drilling in popular recreation areas are key reasons why we are hosting a series of media tours this fall. The first was held on October 25th in Loyalsock State Forest due to the conerns of environmental concervation groups and residents about the communication barriers in existence between DCNR, the natural gas industry, and the public. If you are interested in participating in one of the next two tours, learn more here.

The full list of Logbook complaints to-date and the main areas impacted by unconventional natural gas extraction activity according to those reports are listed below:

Complaints from Logbook

Visual Degradation of Scenery

  • Anti-gas drilling graffiti
  • Flagging tape indicating seismic testing or road widening littered the area, called into question the “leave no trace” character of the trail
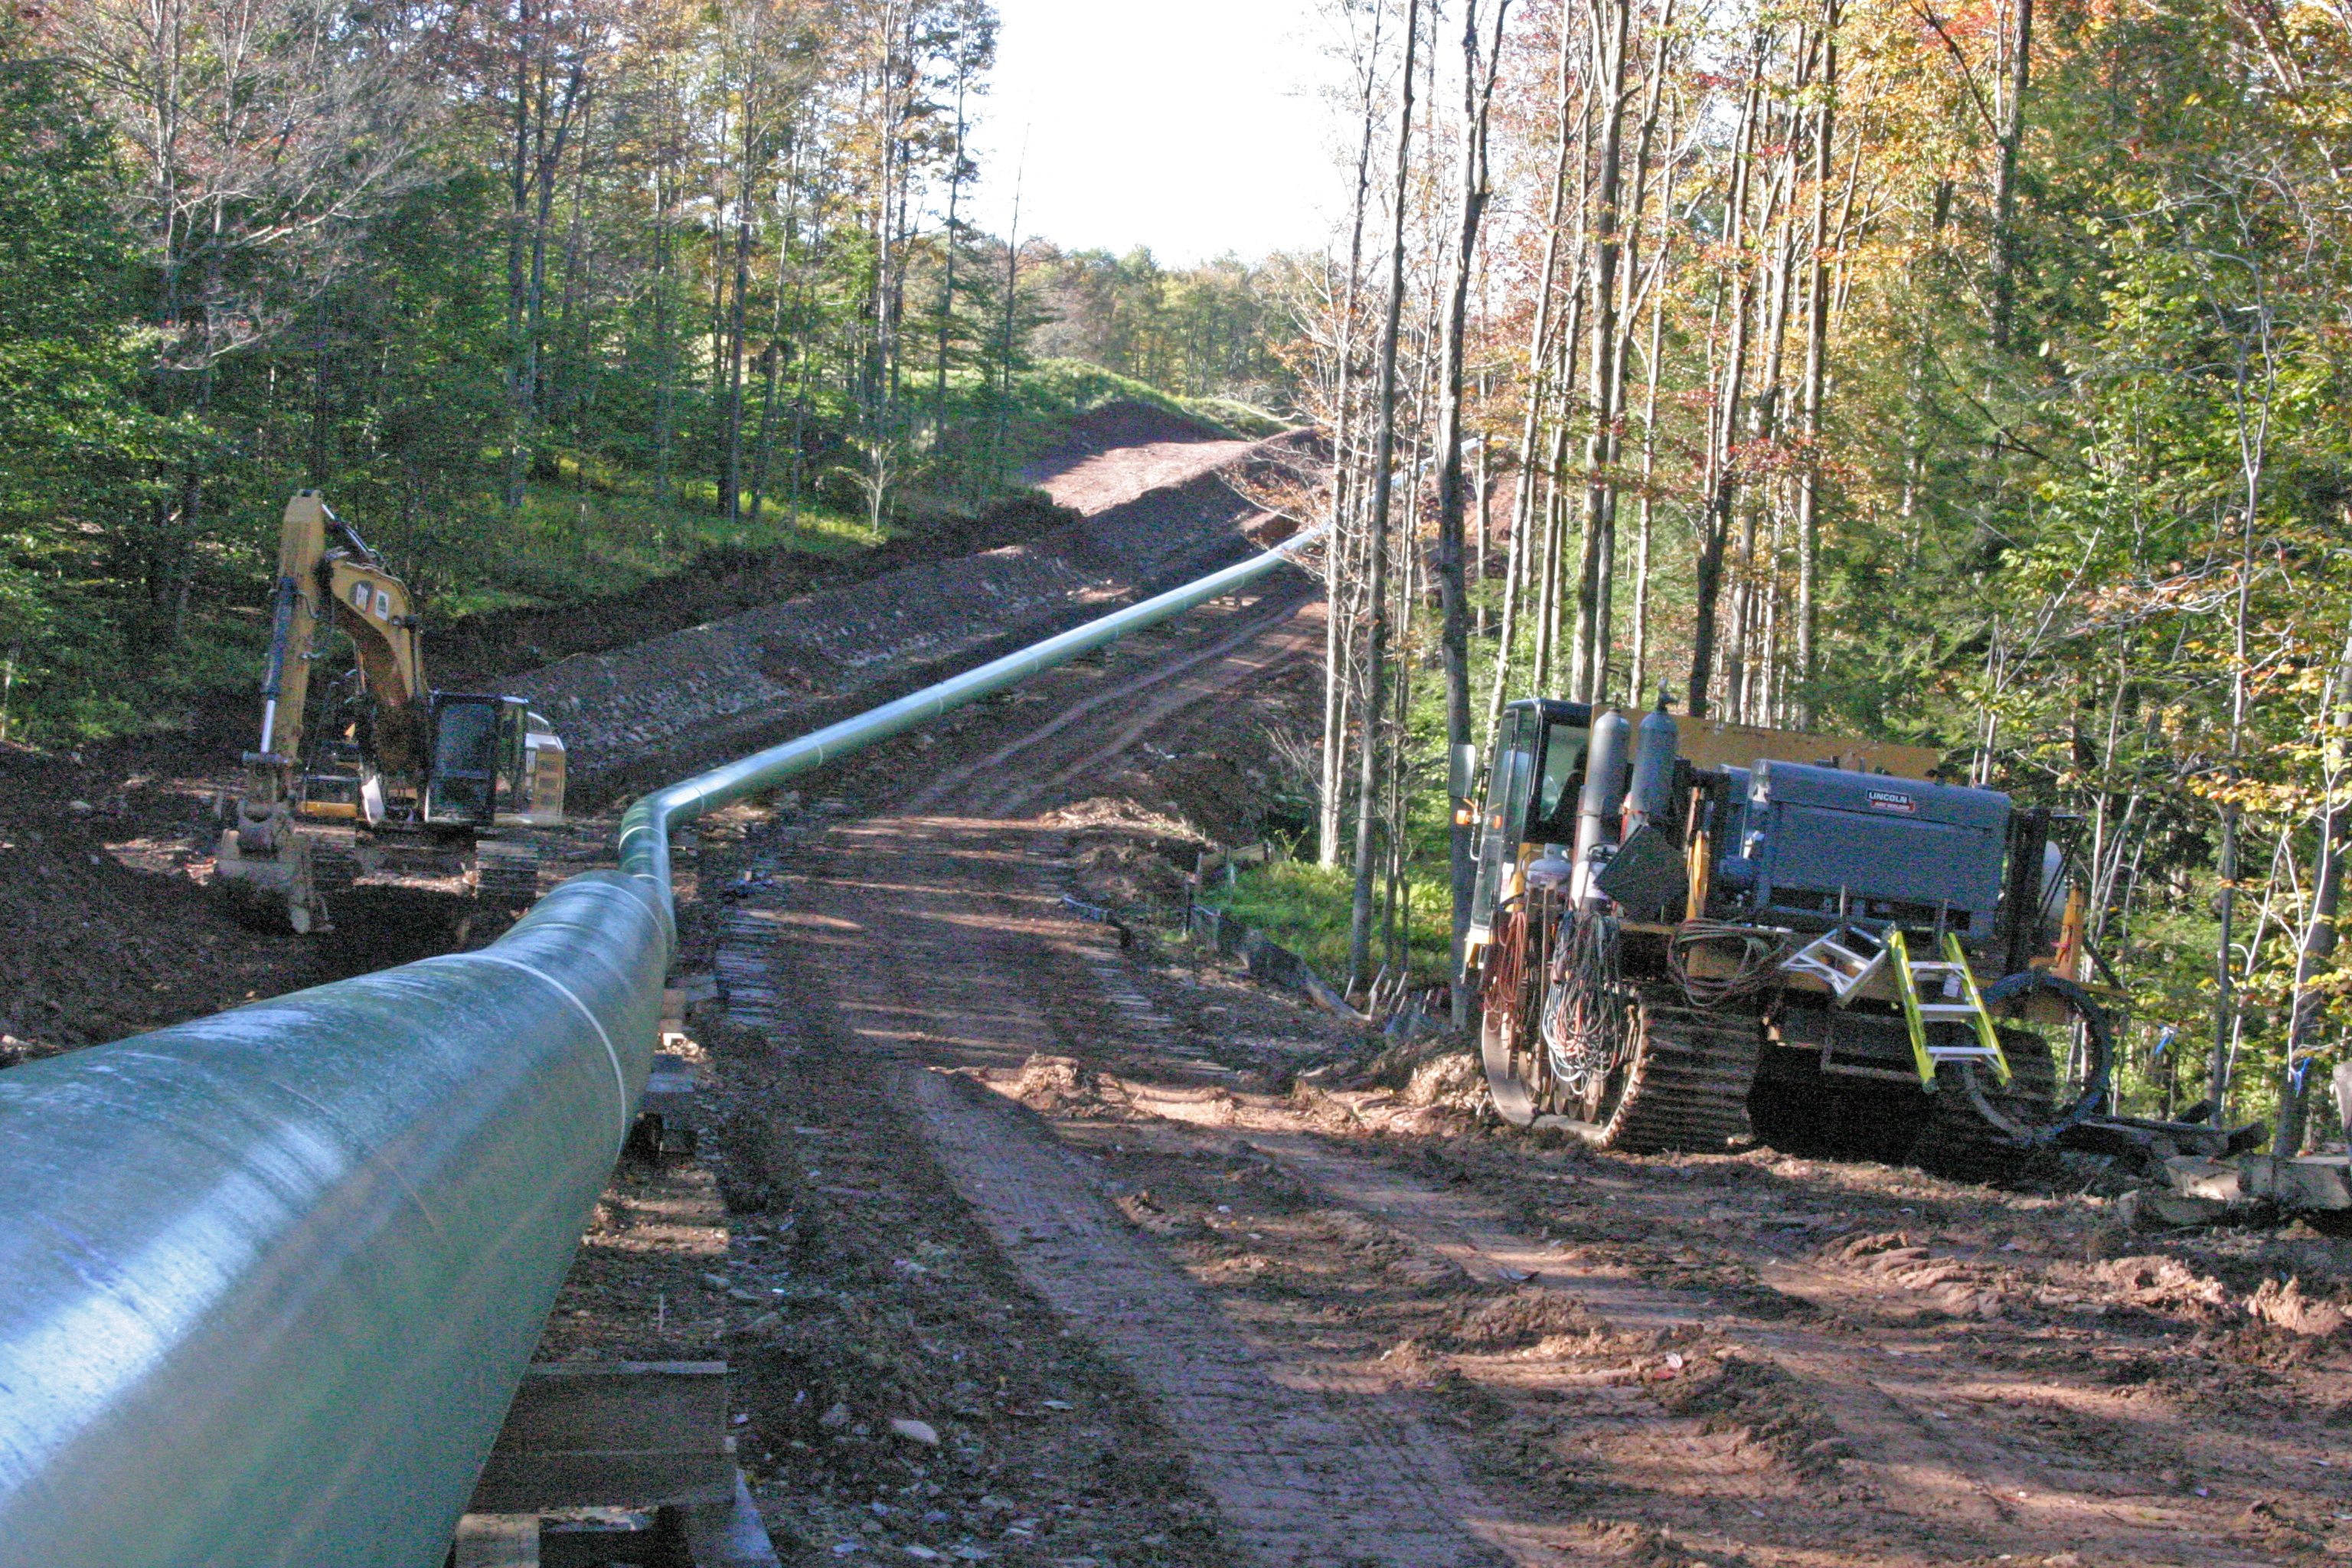
  • Intense construction activity and clearings for pipelines

Noise Pollution

  • Constant noise from compressor station
  • Helicopters
  • Construction and well pad noise

Safety

  • Seismic Testing: One hiker found 2 red wires with labels “Danger Explosives” portruding up from the ground
  • Seismic Testing: Equipment left right on the trail

Convenience

  • Trail relocation (4 miles)
  • Flagging tape caused confusion regarding the direction of trail

Main Areas Impacted

Fall Media Tours

Event Notice: FracTracker Alliance would like to invite members of the media to participate in one of our media tours scheduled for the fall of 2012 in northeastern Pennsylvania. These tours are made possible through the support of the Foundation for Pennsylvania Watersheds and the William Penn Foundation.

As part of our mission to educate and inform the public about shale gas issues, these tours are designed to highlight specific lesser-known impacts of the drilling industry and familiarize reporters and journalists about the work of FracTracker Alliance and our website’s mapping and data capabilities.

The first tour occurred on Thursday, October 25th and addressed forest and wildlife considerations in Loyalsock State Forest. This event included a driving tour with guest speakers: Ephraim Zimmerman (Western PA Conservancy), Paul Zeph (Audubon), Dick Martin (PA Forest Coalition), Curt Ashenfelter (Keystone Trails Association) and Mark Szybist  (PennFuture). A follow up to that media tour will be posted on FracTracker soon, but in the meantime check out the photos below:

Note these dates and topics for the next two fall tours:

  • Friday, November 16 – New perspectives on water quality impacts
  • Thursday, November 29 – Challenges to agriculture

There is a $10 fee (check made payable to the Community Foundation for the Alleghenies) if you would like us to provide you with a bagged lunch for future tours. Otherwise the events are free, including transportation by van during the tour, but registration is required. Please email Samantha Malone to save your seat on the next trip: malone@fractracker.org.

Additionally, starting in November 2012, we will be distributing a bi-weekly e-newsletter specifically designed for the media featuring grassroots stories, maps, and data that may be of use in writing your own articles. Sign up to receive the e-newsletter below:

Subscribe to our media mailing list

* indicates required


Email Format


Production Data by Operator for PA’s Unconventional Wells

A visitor to our site recently asked about the amount of shale gas produced in Pennsylvania by operator.  The following table contains data from the first six months of 2012, summarized by operator. It includes the number of wells showing gas production, the total sum of gas produced, and the average production of each operator’s producing wells. The dataset was downloaded on October 30, 2012, which is important to note, as it is sometimes updated without notice.

The results vary tremendously.  There could be numerous reasons for this, including the age and location of the wells.  This table does not take into consideration condensate or oil production, however those categories are rare in Pennsylvania’s Marcellus Shale and other unconventional wells.

Trends in PA Data for Unconventional Wells

The Pennsylvania Department of Environmental Protection (PADEP) maintains datasets that are updated nightly for permits, drilled wells, and violations.  It seems like it should be a fairly simple task to find totals and trends in this data, but this isn’t always as straight-forward as one might hope.

For example, on the permits data that I downloaded from PADEP on October 22, 2012, there were 13,847 entries, but only 10,512 unique wells as defined by their eight digit API number.  This part is explainable, since additional permits are required for alterations to existing wells, but then there is the PADEP workload report, which counts 11,819 permits issued through October 12, 2012–a number that is obviously altogether different.

The drilled wells dataset used to be similarly afflicted, but the data now seem to be cured of that malady. However, the drilled wells had another issue: In January of this year, the Post-Gazette reported that there were hundreds of wells on the production dataset that were not on the drilled wells list, which is problematic because we’ve not yet figured out how to get the gas out of the ground without drilling a well first. At any rate, there is some reason to believe that this issue has been addressed–at least in part–as there are now records of more historical drilled unconventional wells than there used to be.

Which takes us to violations. The obstacle here is that there are often numerous issues that are encountered on an inspection, and the data show that PADEP hasn’t always been consistent in how it has handled that fact. While it does seem clear that PADEP counts violations by the number of discrete violation ID numbers that have been issued, sometimes those numbers have been used to apply to more than one issue found at a well. In addition, sometimes a single violation seems to apply to more than one well (perhaps at the same wellpad), and then sometimes there are enforcement actions that go along with violations, which generates a new line of data in the report. The net result is that the violations data that I downloaded on October 26, 2012 had 4,696 rows of data, which contained 4,064 violation ID numbers. Unlike permits and drilled wells, the workload report (see above) does not tally violations for multiple years, so that comparison is not available.

Given all of this, we can now see why questions such as, “How many unconventional gas permits have been issued in Pennsylvania?” are less straight-forward than one would hope. It also creates a challenge when trying to analyze the data that is based on such questions, while minimizing skew.

In order to look at long-term trends we need a consistent approach, so I developed a simple strategy to tackle these questions: use the summary information provided by PADEP from the dataset queries.  Results may therefore not reflect what I think to be an optimal representation of events on the ground, but they are totals produced by PADEP that have been obtained in a uniform manner. For each year, I searched for all unconventional records between New Year’s Day and New Year’s Eve, except for 2012 of course, where I used today’s date. Here are those results:


Unconventional gas activity in Pennsylvania, with 2012 year to date totals and projections

The projected totals, for those who are curious, are based on the fact that October 29th is the 302nd day of the year, and multiplying the year to date totals by the inverse of the percentage of time elapsed in the year (365/302).  The projected total for each category is down substantially from 2011 totals.  Let’s take a closer look at each one:


Permits issued by year
At the current rate, there will be 1001 fewer permits for unconventional oil and gas wells issued in 2012 as the year before, a reduction of 28%.  This was widely predicted due to the low price of natural gas earlier in the year.  That price has now rebounded back to $3.81. It remains to be seen whether permit counts rebound as well.


Drilled wells per year
This graph looks pretty similar to the permits, with the exception that all of the total values are lower. 2012 is on pace to have 581 fewer wells drilled statewide than 2011, a 29% reduction, presumably for much the same reason as permits.


Violations issued per year
The number of violations peaked in 2010, so there may be some reason for the reduction other than the fact the industry itself is in a phase of contraction. Pennsylvania is on pace for 473 fewer violations that last year, which is a 39% drop. What these numbers cannot tell us is why. Is it a result of better performance in the field or less rigorous inspection by an administration with long-standing ties to the industry, or both?


Violations per drilled well, by year
Since 2010, I’ve taken periodic looks at the number of violations issued divided by the number of wells drilled. It is a somewhat simplistic but effective way to conduct a cost-benefit analysis of impact by various operators, geographies, or in this case, time. The 2012 rate of 0.54 violations per drilled well is down 13% from last year, and 36% from the peak in 2009. This chart also has a huge dip in the years 2006 and 2007, at a time when the number of wells being drilled was small but growing rapidly.

North Dakota shale viewer

Exploring North Dakota’s Bakken Formation on FracMapper

A new North Dakota map is now available on FracTracker. It joins content from New York, Ohio, Pennsylvania, and West Virginia in our efforts to make data concerning mineral extraction from shale more accessible and understandable.


In this embedded view of the North Dakota map, users can pan and zoom. For full featured control, click the expanding arrows icon (top right of map) to access the map directly.

The area drawn in yellow in the western portion of the state is a generalized layer of activity for the Bakken formation. It was created to help with map performance and accuracy at scales ranging from statewide to 1:750,000, or about the size of a county. Once you zoom in beyond that level, the generalized layer goes away, and some interesting content becomes available.


A screen capture of the North Dakota map
In the screen capture above, I zoomed in past 1:750,000, so the producing wells are visible, as well as a layer of horizontal laterals that are associated with the wells, a feature that few states make available.  The location was chosen at random from the Bakken region, however, if you would like to see a similar view, click the “Search” tool and then type “New Town, ND” into the text box.  I have also changed the basemap to show a satellite image by selecting “Imagery with Labels” from the base map selector.


Close up of “Mamba 1-20H” well

Each feature, or item on the map, has different data associated with it.  I’ve clicked on a well at random to bring up the data pop up box.  Because the data is controlled at the state level, there are often substantial differences in the types of data that are available.  In North Dakota, we can see the cumulative total of oil, gas, and waste water production by scrolling through these pop up boxes.  Units of measure are not provided, but they are assumed to be barrels for oil and waste water, and thousands of cubic feet (Mcf) for gas.

At the very top of that box, there is a gray bar with the text “(1 of 3)”.  This means that multiple features are selected.  Viewers can scroll through them by clicking the arrow icon on the gray bar.  Viewers can reduce the number of selected items by zooming in and making layers inactive.  To change the layers, just click on “Layers” in the main toolbar, and click the checkboxes next to each layer to select or de-select the various available choices.  Please recall that some layers are scale dependent, so they are not available at all times.

For more information about the Bakken formation and the layers available on the map, please click the “About” icon on the main toolbar.