PACWA’s List of the Harmed Now Mapped by FracTracker

Jenny Lisak, co-director of the Pennsylvania Alliance for Clean Water and Air, maintains a list of people claiming to be harmed by hydraulic fracturing or related processes, called the List of the Harmed.  This version of the list, last updated on February 23, 2013, has 822 people thought to be negatively impacted by the industry, with symptoms ranging from headaches and rashes to death.


The List of the Harmed is maintained by the Pennsylvania Alliance for Clean Water and Air. For full access to map controls, click the “Fullscreen” icon at the top right corner of the map.

The FracTracker Alliance was not involved in the creation or maintenance of this list, but our intern Stephen Paddock did map the incidents to the best available level of accuracy, whether that was at the municipal, county, or state level. Please do not assume that the locations on the map are any more accurate than the level indicated in the “Accuracy” column.

Popup box containing the data for one of the 878 entries on the List.

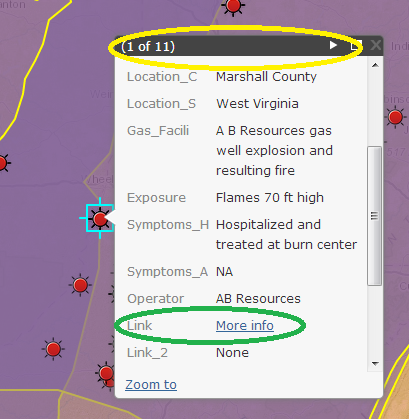
Popup box containing the data for one of the 878 entries on the List.  The yellow oval shows that there are multiple boxes stacked on top of each other, and the green oval provides a hyperlink to more information about the incident in question.

Each entry on the List of the Harmed has at least one link to more information about the given incident.  To access those, click on any map icon to bring up the popup box.  Then scroll down to the “Link” section, and click on “More info”.  If there are multiple sources, they will appear under “Link_2” or “Link_3”.

In the picture above, the text “(1 of 11)” in the yellow oval tells us that there are eleven popup boxes stacked on top on one another.  To sort through the records, simply click the arrow button toward the right edge of the yellow oval.

Waste produced by unconventional wells in Pennsylvania from June to December 2012.

Six Months of Production and Waste From PA’s Unconventional Wells

The Pennsylvania Department of Environmental Protection (DEP) recently published its biannual reports for production and waste from unconventional wells throughout the state for the last half of 2012. FracTracker has learned the hard way not to be too eager in analyzing this data.  In the previous cycle, this data was released without the contribution several operators, one of which happened to be the biggest player in the state, Chesapeake Appalachia.  That incident prompted the inclusion of a data disclaimer from DEP, which includes the following text:

The Oil and Gas Act reporting is a self-reporting system, meaning that data is reported from producers to DEP as required by law. All production data is posted as it was received from the unconventional well operators. DEP does not independently verify the data before it is posted.

While the Oil and Gas Act requires accurate and on-time data reporting by producers, and the producers and DEP endeavor to correct any errors discovered after the data is posted, DEP makes no claims, promises or guarantees regarding the accuracy, completeness or timeliness of the operators’ data that DEP is required to post.

While considering content regarding production and waste in Pennsylvania, it is worth noting that the DEP considers the data to belong to the various operators.  All data for this post was downloaded on February 25, 2013, and while it seems reasonably complete, it is important to note that there could be operators which have not posted their data to DEP in a timely fashion.


PA Production and Waste From Unconventional Wells: July 2012 to December 2012. Click on any map icon for more information, or click the “Fullscreen” button at the top right of the map to access more toolbars.  To access data for individual wells, viewers must zoom in to 1:750,000, or an area equivalent to several counties.

The default map frame includes most of the activity for unconventional oil and gas production and waste from Pennsylvania, but if you zoom out, you can find a landfill in southwestern Idaho that accepted 11 tons of flowback fracturing sand for disposal.  Unfortunately, the available data does not give any indication of why an operator might choose to ship waste over 2,000 miles away from its source.

Below are the six month statewide production and waste totals for Pennsylvania’s unconventional wells, including the number of wells that contributed to each total:


Production from unconventional wells in Pennsylvania from July to December 2012

Production from unconventional wells in Pennsylvania from July to December 2012.  Mcf represents 1,000 cubic feet, and barrels measure 42 US gallons.

The total gas produced was over 1.1 trillion cubic feet (Tcf) for the six month period, which was over 250 billion cubic feet (Bcf) higher than the previous total of 895 Bcf.

Waste produced by unconventional wells in Pennsylvania from June to December 2012.

Waste produced by unconventional wells in Pennsylvania from June to December 2012.

And here is a look at the disposal method for each type of waste, in terms of percentage:

Disposal methods of Pennsylvania unconventional oil and gas waste products, in terms of percentage of the waste type.  July - December 2012.

Disposal methods of Pennsylvania unconventional oil and gas waste products, in terms of percentage of the waste type. July – December 2012.

Note that while road spreading rounds down to 0%, 425 barrels of produced fluid were used in this effort.