Controversy in the Loyalsock

Controversy in the Loyalsock

By Mark Szybist, Staff Attorney, PennFuture

What are the Clarence Moore Lands?

The Clarence Moore lands are 25,621 acres of “split estate” lands in the Loyalsock State Forest where the surface rights are owned by the Commonwealth of Pennsylvania and the oil and gas rights are owned by two private parties – an affiliate of Anadarko Petroleum Corporation (Anadarko) and a private company called International Development Corporation (IDC). The Pennsylvania Department of Conservation and Natural Resources (DCNR) calls this acreage the “Clarence Moore lands,” after an individual who once owned the area’s oil and gas interests.

What is the controversy over the Clarence Moore lands?

The Clarence Moore lands have become controversial because Anadarko wants to drill gas wells on them (and build compressor stations, water impoundments, pipelines, and new roads). Because of the ecological and recreational sensitivity of the Clarence Moore lands, PA’s conservation community (and much of the general public) wants the DCNR to use its substantial powers to minimize surface activities, if not prevent them altogether.

In general, when a “split estate” exists in PA, the party that owns or controls the oil and gas estate has an implied right to use the surface that it does not own in order to extract oil and gas. The Clarence Moore lands present an exception to this rule. Due to a provision in the Commonwealth’s deed, the DCNR has the power to deny Anadarko access to 18,870 acres of the Clarence Moore lands – almost 75%. To obtain access, Anadarko needs a right-of-way from the DCNR. Conservationists are arguing that given this power, the DCNR has leverage to protect all of the Clarence Moore lands – including the 6,841 acres where Anadarko appears to have traditional “split estate” surface rights.

In March 2012 Anadarko submitted to the DCNR a development plan for the Clarence Moore lands. For almost a year, a coalition of conservation, recreation, fishing and hunting organizations (and thousands of private citizens) have been pressing the DCNR to conduct a public input process on the Clarence Moore lands before making any agreement with Anadarko. The coalition wants the DCNR to make public its environmental impact analyses, allow public comment on all development and non-development alternatives, and protect the Clarence Moore lands for future generations of Pennsylvania citizens. In April 2013 the DCNR conducted an invitation-only meeting about the Clarence Moore lands for “local stakeholders,” followed by a webinar in collaboration with the Penn State Extension of the Penn State College of Agricultural Sciences. The DCNR announced on May 22, 2013 that it would hold a public meeting in Williamsport on June 3rd.

Why are the Clarence Moore lands so important?

The Clarence Moore lands are a wealth of ecological and recreational resources. They include the Old Loggers Path (OLP), an acclaimed 27-mile hiking trail that follows former logging trails and opens onto stunning vistas. According to DCNR documents, the OLP “will be taking the brunt of development [from Anadarko’s activities].”

The Clarence Moore lands include most of the watershed of Rock Run, an Exceptional Value (EV) stream widely hailed as the most beautiful stream in Pennsylvania. The headwaters of Rock Run and Pleasant Stream, another EV stream, emerge from ridge-top wetlands that provide habitat for several threatened or endangered plant and animal species.

The Clarence Moore lands provide habitat for numerous plant and animal species that Pennsylvania has classified as threatened, rare, or at risk (or determined to be candidates for these classifications). Among these species (to name just a few): the timber rattlesnake, northern water shrew, creeping snowberry, northern bulrush, northern goshawk, and yellow-bellied flycatcher. The Clarence Moore lands have been designated an Important Bird Area by the Audubon Society. (See p. 82 of this PDF).

Finally, the Clarence Moore lands are one of only a few large public land areas in north-central PA that have not been opened to gas development, and still contain relatively unfragmented forests.  The DCNR has already leased almost 21,000 other acres of Loyalsock (the forest is around 114,000 acres in all), and has also leased much of the Tiadaghton State Forest to the west and the Tioga State Forest to the north.

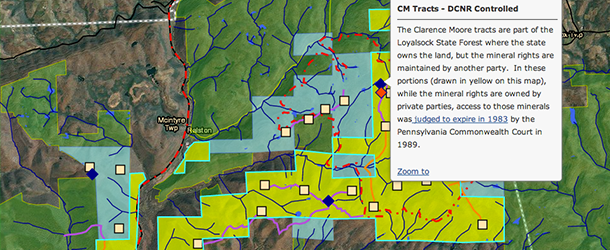
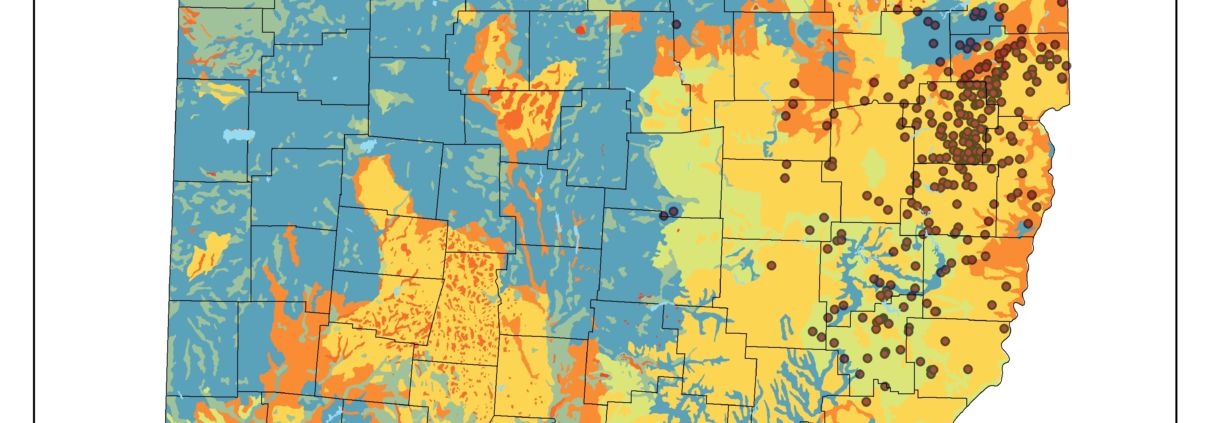
FracTracker map of Clarence Moore Lands and Activity

The map above shows the Clarence Moore lands as yellow and blue areas within the Loyalsock State Forest. In the yellow areas, the DCNR has exclusive control of the surface. In the blue areas, Anadarko has the right to use the surface to extract oil and gas. The locations of the yellow and blue Clarence Moore areas are based on documents obtained by PennFuture through the Pennsylvania Right to Know Law (RTKL) and on maps that the DCNR presented at the April 2013 webinar noted above.

The map also shows the oil and gas wells, pipelines, roads, compressor stations, and impoundments that conservationists believe Anadarko has proposed to build in the Clarence Moore lands. The locations of this infrastructure are based on the RTKL documents and on hikers’ observations of survey flags within the Loyalsock State Forest.


Questions and comments about this issue or the June 3rd public meeting can be directed to Mark Szybist: Szybist@pennfuture.org.

Groundwater Complaints to PADEP Compiled by Times-Tribune

In a May 19th article published in the Scranton Times-Tribune, Laura Legere discusses data that she has compiled from a Right-to-know law request to the Pennsylvania Department of Environmental Protection (PADEP).  The data show 969 complaints between 2008 and the fall of 2012.  According to the article, 161 of these complaints include determination letters where PADEP indicates some sort of link between oil and gas activity and impacted groundwater supplies. The Times-Tribune data has been geolocated and mapped by the FracTracker Alliance:


Map showing groundwater complaints to PADEP from 2008 through Fall 2012. Orange-red dots indicate instances where PADEP has established come connection between drilling activity and groundwater impacts, yellow dots mean that PADEP analysis is still pending, and green dots indicate that PADEP has not established such a connection. Please note that the locations are not exact, and that in many instances there are multiple records at a single location on the map. Click on “Fullscreen” to access additional mapping tools.

According to our correspondence with Ms. Legere, there are future plans to release the source documents to the public as well, once needs to protect the privacy of the complainants have been addressed.

We have also added this data to our US Map of Suspected Well Water Impacts:


US Map of Suspected Well Water Impacts. Here, the Times-Tribune data have been represented by light blue dots. Due to crowding from other layers, it is necessary to zoom in to Pennsylvania to see all of the data. For more information on this map, please click on “Fullscreen” and then the “About” tool.

Land-Use Change, the Utica Shale, and the Loss of Ecosystem Services

By Ted Auch, PhD – Ohio Program Coordinator, FracTracker Alliance

In Ohio, Utica Well pads range in size from 5-15 acres. (Estimates for pipeline and retention ponds are unavailable.) That figure gives us the chance to estimate how hydraulic fracturing influenced changes to land-use, ecosystem services, plant productivity, and soil carbon loss.

Working with Caleb Gallemore and his Ohio State University GIS class, we created a data set that estimated the percent cover for each well pad prior to drilling using the USGS and Department of Interior’s 2006 National Land Cover Database (NLCD, 2006) [1].

Figure 1. Ohio’s original vegetation cover and Utica Well permits as of April 30th, 2013

Figure 1. Ohio’s original vegetation cover and Utica Well permits as of April 30, 2013

Accordingly, the state was and is dominated by:

  • mixed oak (from 12,038 mi2 pre-settlement to 7,911 mi2 today) to the east and
  • maple-beech-birch (from 13,917 mi2 pre-settlement to 2,521 mi2 today) to the west stretching into the southeast and northwest corner of Ohio.

During pre-settlement times additional dominant forest types included:

Since industrialization:

  • The faster growing elm-ash-cottonwood has arisen as a sub-dominant forest type currently comprising 1,237 mi2.
  • Additional sub-dominant forest types comprising 100-140 mi2 of Ohio’s land area include aspen-birch (134 mi2), white-red-jack pine (124 mi2), and loblolly-shortleaf pine (108 mi2).

Our results suggest the average amount of deciduous forest [2] disturbed – as a percent of total well pad area – by well pad establishment is 9.8 ± 5.5% per well pad with a range of 4.7% in Stark and Holmes Counties and a high of 24% in Monroe County (Figure 2). With respect to pasture and crop displacement the average is 11.7 and 10.7% per well pad, respectively, with significantly higher between-county variability for crop cover (±5.5% Vs ±3.6%).

Figure 2. Percent Cover across Ohio’s 269 Utica Well Pads assuming an average area of 7.75 acres and the National Land Cover Database 2006 (NLCD 2006) as a proxy for previous land-use.

Figure 2. Percent Cover across Ohio’s 269 Utica Well Pads assuming an average area of 7.75 acres and the National Land Cover Database 2006 (NLCD 2006) as a proxy for previous land-use. – Click to enlarge

Converting this data into ecosystem services requires certain assumptions about plant growth, soil organic matter content, and soil compaction utilizing Natural Resource Conservation Service (NRCS) soil data to model the latter two and established peer-reviewed estimates for plant pattern and process (Follett, Kimble, & Lal, 2000; Lobell et al., 2002; Valentine et al., 2012). The basics of this analysis – assuming subsurface soils are 25% more compact and contain 45% less organic matter than the surface 12-13 inches (Needelman et al., 1999) – demonstrated that well pad establishment has displaced approximately 28,205 tons of surface and 78,348 tons of subsurface soil carbon [3] for a total of 106,554 tons of carbon equivalent to 389,986 tons of CO2.

Additionally, the displacement and/or removal of vegetation – assuming the average Ohio forest is 40-80 years old [4] – has resulted in the annual loss of 1,050, 6,516, and 9,461 tons of crop, pasture, and forest carbon production, respectively. This is equal to 17,027 tons of carbon or 62,319 tons of CO2, which when added to the aforementioned soil loss is equivalent to the CO2 footprint of 25,198 Ohioans [5].

Over the life of these three ecosystem types, well pad establishment displaces 1,021,619 tons of carbon. This equates to 3.74 million tons of CO2 or 230,034 Ohioans, which is roughly 9,000 less people than reside in Akron and Warren combined. Another way way to frame this figure is that it would be equivalent to the eightieth largest US city between Henderson, NV and Scottsdale, AZ.

At CO2’s current valuation this Ohio Utica well pad “carbon displacement” is roughly $18.71 million. However, if we assume this is at the lower end of reasonable CO2 estimates and that a range of $10-75 dollars is more indicative of carbon’s price, then we estimate the value of well pad displaced carbon is more like $41.29-309.68 million.

The true value of Utica well pad carbon displacement is somewhere in this range and entirely dependent on your belief in the feasibility of valuing CO2 emissions. However, these estimates do point to some of the externalities associated with Utica Shale development currently ignored by industry lobbyists and political advocates. There is far more work to be done as it relates to understanding well pads’ influence on ecosystem services, crop productivity, and local hydrology; this is simply an attempt to begin quantifying such effects.


References

Follett, R F, Kimble, J M, & Lal, R. (2000). The Potential of U.S. Grazing Lands to Sequester Carbon and Mitigate the Greenhouse Effect. Boca Raton, FL: CRC Press LLC.

Fry, J, Xian, G, Jin, S, Dewitz, J, Homer, C, Yang, L, . . . Wickham, J. (2011). Completion of the 2006 National Land Cover Database for the Conterminous United States. PE&RS, 77(9), 858-864.

Lobell, D B, Hicke, J A, Asner, G P, Field, C B, Tucker, C J, & Los, S O. (2002). Satellite estimates of productivity and light use efficiency in United States agriculture, 1982-98. Global Change Biology, 8(8), 722-735.

Needelman, B A, Wander, M M, Bollero, G A, Boast, C W, Sims, G K, & Bullock, D G. (1999). Interaction of Tillage and Soil Texture Biologically Active Soil Organic Matter in Illinois. Soil Science Society of America Journal, 63(5), 1326-1334.

Valentine, J, Clifton-Brown, J, Hastings, A, Robson, P, Allison, G, & Smith, P. (2012). Food vs. Fuel: The use of land for lignocellulosic next generation energy crops to minimize competition with primary food production. Global Change Biology Bioenergy, 4(1), 1-19.


Footnotes

[1] The NLCD estimates land cover using sixteen classes at a 98 foot spatial resolution applied to 2006 Landsat satellite data or 4-5 years prior to the first Ohio Utica permit in September, 2010 (Fry et al., 2011)

[2] Primary tree species include red and sugar maple, red and white oak, white ash, black cherry, American beech, hickory, and tulip poplar according to the most recent USFS Forest Inventory Analysis “Ohio Forests 2006”.

[3] Along with roughly 6,536 tons of soil nitrogen assuming an Ohio soil Carbon-To-Nitrogen ratio of 14.6.

[4] Utilizing the USFS’s Forest Inventory and Analysis EVALIDator Version 1.5.1.04 tool we determined that 62% of Ohio’s oak-hickory, maple-beech-birch, elm-ash-cottonwood, and oak-pine forest types, which account for 94% of the state’s forest area, are 40-80 years old.

[5] Assuming 17.3-18.6 tons of CO2 per capita based on Oak Ridge National Laboratory’s Carbon Dioxide Information Analysis Center as cited by the World Bank.

Logbook FracTracker Postcard Front

Winter Summary of the Trail Logbook Project

As the forests beckon us to return to their paths now that winter has subsided (hopefully), let’s take a look at the reports we received over the winter for our Trail Logbook Project.

Impacts Summary

Reports came from several counties, but the majority of complaints focused on the impacts of drilling in Loyalsock State Forest.

Counties:

  • Clinton
  • Centre
  • Lycoming
  • Warren
  • Sullivan

Suspected Causes:

  • Existing gas line
  • Shallow gas wells
  • Truck traffic
  • Pipeline construction
  • Drilling/hydraulic fracturing
  • Impoundment
  • Seismic Testing

Main Trails Affected:

  • Loyalsock State Forest trails
  • Eddy Lick Trail Loop
  • Minister Creek Trail

Impacts Reported (in descending order according to frequency):

  • Unpleasant odors
  • Confrontation with gas company employees, contractors, security personnel
  • Noise impacts
  • Potential degradation/contamination of a stream, spring, lake, or pond, brine in the water at ANF pump
  • Visual impacts (degradation of scenery)

Logbook Quotes

Drilling has largely overtaken this tract of Loyalsock State Forest. I would say that drilling has completely eclipsed the recreational aspect of the tract. Indeed, the tract seems to have been transformed into an industrial forest. I came here for hiking and nature photography, but I felt as though I were a guest on Seneca-owned land, not a visitor to public land paid for by the citizens of Pennsylvania. I noticed no other visitors in the tract, too; everyone I saw was a Seneca employee.   The scenic vista on Bodine Mountain Road (noted on the Loyalsock State Forest map) was less than scenic when I visited; many drilling pads (some near, some far) were seen. The noise from trucks and compressors also diminished the recreational aspect. I won’t return here until most of the drilling ends.

This stream, Minister Creek, is a “Safe” zone for Brook Trout. It now has areas of bubbles and a thin oil sheen on its surface in addition to the Brine taste at the pump.

While setting up campsite just off the Loyalsock Trail at the old CCC Camp on Sandstone Lane, I heard an approaching Crew Truck with a loudspeaker blasting radio conversation with supervisors.  As the Lane had been damaged in recent storms, they tried to drive thru a meadow and right thru my Campsite.  There was no opening in the trees wide enough to pass and I told them so.  They went back to the lane and bored thru the rutted, flood-gouged lane past my camp…

Recommendations from Citizen Reports

Where roads are narrow, especially in forested areas, there are often checkpoints set up by the operators in order to control two-way traffic. Often signs are not sufficiently visible/present/clear, so motorists may not realize the new rules. In Loyalsock State Forest, this has been an issue. As such, below are recreationalists’ recommendations regarding ways to reduce or avoid the issues currently arising from gas operations in this and other public areas:

  • Seneca Resources Corp. and the DCNR should work together to better educate visitors on the need to stop at every checkpoint in this tract of Loyalsock State Forest (or in any forested area that is frequented by recreationalists).
  • At each of the two entrances (Hagerman Run Road and Grays Run Road) to the tract from Pennsylvania Route 14, post a large, prominent sign about the need to stop at every checkpoint for two-way traffic control;
  • Post clearly visible signs at every checkpoint; and
  • On the DCNR Web site in the Advisories section of the Loyalsock State Forest page, post information about roads affected by two-way traffic control and the need to stop at checkpoints. (Currently, information about such roads is posted on the Road Advisories page on the DCNR Web site, but accessing this page from the home page is challenging. Also, the Road Advisories page doesn’t mention that motorists need to stop at checkpoints.)

More Information

Visit the Trail Logbook Project landing page for more information about this initiative, our partners, and to submit your own report.

US Map of Suspected Well Water Impacts

Launch of National Mapping Project Designed to Show Possible Impacts of Oil and Gas Drilling on Well Water

FOR IMMEDIATE RELEASE
US Map of Suspected Well Water Impacts
Contacts: Brook Lenker, Executive Director, FracTracker Alliance, (717) 303-0403; and
Samantha Malone, Manager of Science and Communications, FracTracker Alliance, (412) 802-0273

May 1, 2013 – The US Map of Suspected Well Water Impacts is a project that will attempt to piece together recent complaints of well water quality impacts that people believe are attributed to unconventional gas and oil operations. Research has demonstrated potential risks to ground and drinking water posed by faulty well casings, surface spills, and hydraulic fracturing. From across the country, in areas where gas and oil development is occurring, accounts of possible well water contamination have been reported but not been collected all in one place – yet. The FracTracker Alliance and cooperating organizations are providing that opportunity.

Inspired by other “crowd-sourced” data and mapping projects, this project aims to collect ongoing stories, narratives, and data from individual homeowners living on well water near drilling operations and map the general location of these reports online.  The first version of the dynamic map (shown below) is available at www.fractracker.org/usmap.

US Map of Suspected Well Water Impacts - V1

US Map of Suspected Well Water Impacts
Read more about Version 1 of the map

Once received, submissions will be reviewed to the extent possible by cooperating researchers and organizations. Not all reported cases of water contamination, however, have been or will be able to be substantiated. According to Brook Lenker, Executive Director of FracTracker Alliance:

The reports we are collecting are not necessarily indisputable evidence that drilling has contaminated drinking water sources. Some accounts are irrefutable. Others remain unsubstantiated, but that doesn’t mean the well owner isn’t experiencing serious problems. Even where proof may be elusive, perception of risk can tell us much about an issue and the level of concern by the community.  This information will likely help to identify pre-existing problems or conditions that were not previously well known.  Such outreach is needed to permit citizens, local agencies, and others to work together to address pre-existing concerns, improve local regulations or standards, conduct proper baseline testing and monitoring, and make informed decisions.

As unconventional natural gas and oil extraction expands internationally, an Internet-based project like the US Map of Suspected Well Water Impacts can help to share on a global scale how people in the U.S. view – and may be impacted by – unconventional drilling. If everyone contributed their stories, the public’s understanding of gas and oil extraction’s impacts on well water could expand dramatically.

Anyone wishing to submit their story should visit www.fractracker.org/usmap or call (202) 639-6426. A complete list of current project partners is available on the website.

# # #

Downloadable Press Release (PDF)
Read more about Version 1 of the map

US Map of Suspected Well Water Impacts - V1

Introducing the US Map of Suspected Well Water Impacts

About the Map

The FracTracker Alliance has been working with nine different community partners on a project to map instances where oil and gas activity are suspect of impacting groundwater supplies in the United States. The US Map of Suspected Well Water Impacts is now ready for its initial release, and consists of the following data layers:

  • Visitor Submitted Impacts. This layer consists of viewer submitted form data describing suspected incidents of groundwater contamination by oil and gas extraction and related industries.  The locations have been determined using the centroids or geometric center-points of the zip code in which the suspected incident occurred.  If you are aware of additional incidents, please submit them here.
  • Pipeline Incidents Contaminating Groundwater. This data layer includes hazardous liquid pipeline incidents that were indicated as resulting in groundwater contamination between 1/1/2010 and 3/29/2013.  The data were obtained by the US Department of Transportation Pipeline and Hazardous Materials Safety Administration (PHMSA).  The data have been altered by the FracTracker Alliance in that it only includes incidents leading to groundwater contamination, and by the removal of several dozen columns of data about the incident for the sake of brevity.  There are 30 incidents on this list.
  • NRDC Suspected Contamination Events. Amy Mall of the Natural Resources Defense Council compiled a list of 37 incidents where hydraulic fracturing is suspected of contributing to groundwater contamination.   The list was compiled in December 2011, and each entry is linked to news reports of the event.   This layer was mapped by the FracTracker Alliance based on the centroids or geographic center-points of the municipality, county, or state of the incident, depending on the best information available.
  • List of the Harmed Suspected Water Incidents. Jenny Lisak, co-director of the Pennsylvania Alliance for Clean Water and Air, maintains a list of people claiming to be harmed by hydraulic fracturing or related processes, called the List of the Harmed (LotH).  This data layer is based on the February 23, 2013 update of the list, and contains only the events in which water is the suspected exposure pathway.  This data was mapped by the FracTracker Alliance based on the centroids or geographic center-points of the municipality, county, or state of the incident, depending on the best information available.
  • NM Pit Contamination Events. This layer consists of events where the New Mexico Oil Conservation Division determined that substances from oil and gas pits contaminated groundwater.  Altogether, there are 369 incidents included in the data.  The document on which this map was based was published in 2008.  This data was mapped by the FracTracker Alliance based on the centroids or geographic center-points of the PLSS section, meaning that the points should be accurate within 0.72 miles.

US Map of Suspected Well Water Impacts – Version 1

It is important to note that the standard for inclusion in the map is simply whether or not someone suspects that well water has been impacted by oil and gas extraction-related activity.  Specifically, items on the Visitor Submitted Impacts, NRDC Suspected Contamination Events, and List of the Harmed Suspected Water Incidents should be thought of as perceived  impacts by oil and gas activity, not confirmed ones.  The NRDC and LotH lists were built with links to one or more media reports about the event.

On the other hand, the New Mexico document on which the pit contamination event layer was built simply says, “Cases Where Pit Substances Contaminated New Mexico’s Ground Water,” and it is worth noting that it was published by a state regulatory agency. Likewise, the PHMSA pipeline data is published by an administration within the US Department of Transportation.  Between these two layers, there are 399 incidents with the authority of a regulatory agency behind them.

Future versions of this map can be found on the project’s landing page.