Mapping California’s State Bill 4 (SB4) Well Stimulation Notices

By Kyle Ferrar, CA Program Coordinator, FracTracker Alliance

Introduction

California passed State Bill 4 (SB4) in September, 2013 to develop and establish a regulatorySanta Barbara Channel_10.7.13 structure for unconventional resource extraction (hydraulic fracturing, acidizing, and other stimulation techniques) for the state.   As a feature of the current version of the regulations, oil and gas drilling/development operators are required to notify the California Department of Conservation’s Division of Oil Gas and Geothermal Resources (DOGGR), as well as neighboring property owners, 30 days prior to stimulating an oil or gas well.  In addition to property owners having the right to request baseline water sampling within the the following 20 days, DOGGR posts the well stimulation notices to their website.

Current State of Oil and Gas Production

The DOGGR dataset of well stimulation notices was downloaded, mapped, the dataset explored, and well-site proximity to certain sites of interest were evaluated using GIS techniques. First, the newest set of well stimulation notices, posted 1/17/14 were compared to a previous version of the same dataset, downloaded 12/27/13. When the two datasets are compared there are several distinct differences. The new dataset has an additional field identifying the date of permit approval and fields for latitude/longitude coordinates. This is an improvement, but there is much more data collected in the DOGGR stimulation notification forms that can be provided digitally in the dataset, including sources of water, amount of water used for stimulation, disposal methods, etc… An additional 60 wells have been added to the dataset, making the total count now 249 stimulation notices, with 37 stimulated by acid matrix (acidizing), 212 hydraulically fractured, and 3 by both. Of the 249, 59 look to be new wells as the API identifcation numbers are not listed in the DOGGR “AllWells.zip” database here, while 187 are reworks of existing wells. A difference of particular interest is the discrepancy in latitudes and longitudes listed for several well-sites. The largest discrepancy shows a difference of almost 10,000 feet for an Aera Energy well (API 3051341) approved for stimulation December 23, 2013. The majority of the well stimulations (246/249) are located in Kern County, and the remaining three are located in Ventura County.

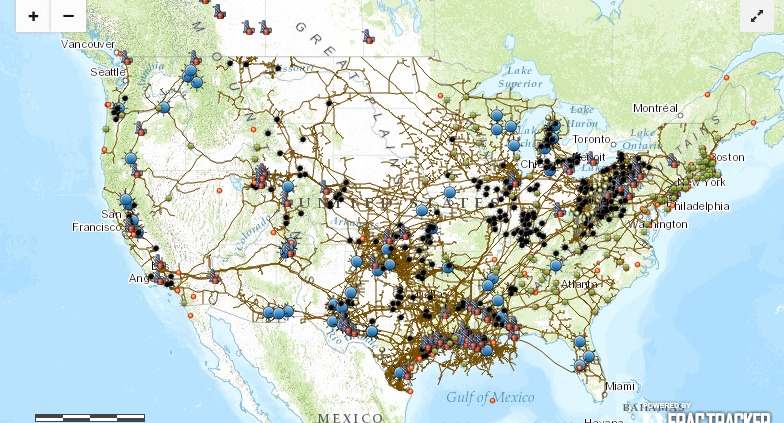
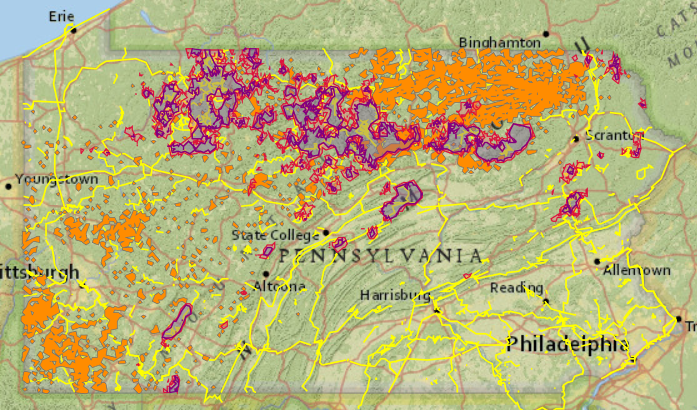
Figure 1. Stimulation Notices and Past/Present Oil and Gas Wells
Click on the arrows in the upper right hand corner of the map for the legend and to view the map fullscreen.

Well Spacing

As can be seen in Figure 1, the well stimulations are planned for heavily developed oil and gas fields where hydraulic fracturing has been used by operators in the past. California is the 4th largest oil producing state in the nation, which means a high density of oil and gas wells. Many other states limit the amount of wells drilled in a set amount of space in support of safer development and extraction. In Ohio, unconventional wells (>4,000 foot depths) have a 1,000 foot spacing requirement , West Virginia has a 3,000 foot requirement for deep wells , and the Texas Railroad Commission has set a 1,200 foot well spacing requirement. Using Texas’s setback as an example buffer for analysis, 241/249 of the DOGGR new stimulations are within 1,200 feet of an active oil and gas well. Of the 364 hydraulically fractured oil and gas wells DOGGR has listed as “New” (they are not yet producing, but are permitted and may be in development), 351 are within 1,200 feet of a well identified in DOGGR’s database as an active oil and gas well. One of the industry promoted benefits of using stimulations such as hydraulic fracturing is the ability to decrease the number of well-sites necessary to extract resources and therefore decrease the surface impact of wells. This does not look to be the practice in California.

Environmental Media

Following this initial review of oil and gas production/development, three additional maps were created to visualize the environmental media threatened by contamination events such as fugitive emissions, spills or well-casing failures. The maps are focused on themes of freshwater resources, ambient air quality, and conservation areas.

Freshwater Resources

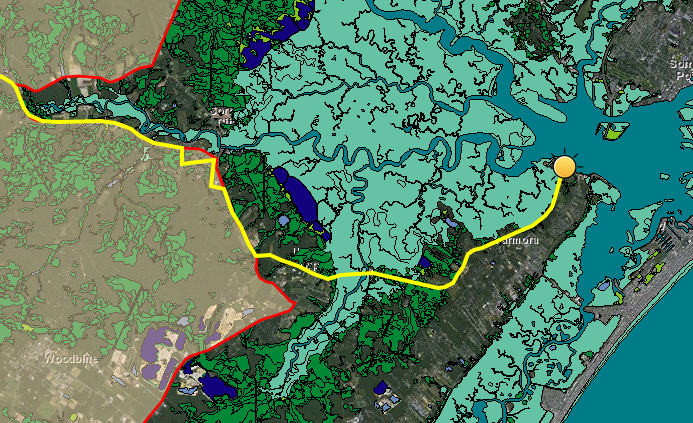
Figure 2. New Wells, Stimulation Notices and California’s Freshwater Resources
Click on the arrows in the upper right hand corner of the map for the legend and to view the map fullscreen.

Freshwater resources are limited in arid regions of California, and the state is currently suffering from the worst drought on record. In light of these issues, the FracMapper map “New Well Stimulations and California Freshwater Resources” includes map layers focused on groundwater withdrawals, groundwater availability, Class II wastewater injection wells, watershed basins, and the United States Geological Survey’s (USGS) National Hydrography Data-set (NHD). Since California does not have a buffer rule for streams and waterways, we used the setback regulation from Pennsylvania for an analysis of the proximity of the well stimulation notices to streams and rivers. In Pennsylvania, 300 feet is the minimum setback allowed for hydraulic fracturing near recognized surface waters. Of the 246 wells listed for new stimulation, 26 are within 300 feet of a waterway identified in the USGS’s NHD. The watersheds layer shows the drainage areas for these well locations. As a side note, the state of Colorado does not allow well-sites located within 100 year flood plains after the flash floods in September 2013 that caused over 890 barrels of oil condensates to be spilled into waterways. Also featured in Figure 2 are the predominant shallow aquifers in California. The current well stimulations posted by DOGGR are located in the Elk Hills (Occidental Inc.), Lost Hills (Chevron), Belridge and Ventura (both Aera Production) oil fields and have all exempted out of a groundwater monitoring plans based on aquifer exemptions, even though the aquifers are a source of irrigation for the neighboring agriculture.   Stimulation notices by Vintage Production in the Rose oil field, located in crop fields on farms, are accompanied by a groundwater and surface water monitoring plan. Take notice of the source water wells on the map that provide freshwater for both the acidizing and hydraulic fracturing operations and the Class II oil and gas wastewater injection wells that dispose of the produced waters. Produced wastewaters may also be injected into Class II enhanced oil recovery water flood wells, and several of the stimulation notices have indicated the use of produced waters for hydraulic fracturing.

Ambient Air Quality

Figure 3. California New Wells, Stimulation Notices and Air Quality
Click on the arrows in the upper right hand corner of the map for the legend and to view the map fullscreen.

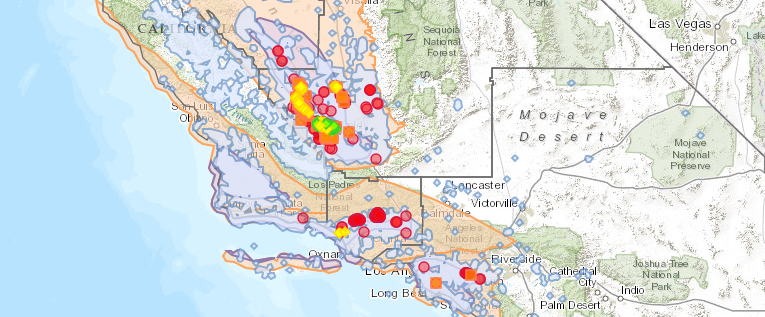
Impacts to ambient air quality resulting from oil and gas fields employing stimulation techniques have been documented in areas like Wyoming’s Upper Green River Basin , the Uintah Basin of Utah , and the city of Dish, Texas . Typically, ozone is considered a summertime issue in urban environments, but the biggest threat to air quality in these regions has been elevated concentrations of ozone, particularly in the winter time. Ozone levels in these regions have been measured at concentrations higher than would typically be seen in Los Angeles or New York City. In Figure 3, the state and federal ozone attainment layers show that the areas with the highest concentrations of “new” wells and the DOGGR New Stimulation Notices do not pass ambient air criteria standards to qualify as “attainment” status for either state or federal ambient ozone compliance, meaning their ambient concentrations reach levels above health standards. Other air pollutants known to be released during oil and gas development, stimulation, and production include volatile organic compounds (VOCs) such as Benzene, Toluene, Ethylbenzene and xylene (BTEX); carbon monoxide (CO); hydrogen sulfide (H2S), Nitrogen Oxides (NOx), and sulfur dioxide (SO2), and methane (CH4), a potent greenhouse gas. It is important to point out that ground level ozone is not emitted directly but rather is created by chemical reactions between NOx and VOCs. Besides ozone, all these other air pollutants are in “attainment” in California except NOx in Los Angeles County. There have not been any stimulation notices posted in Los Angeles County, but the South Coast Air Quality Monitoring District identifies 662 recent wells that have been stimulated using hydraulic fracturing, acidizing, or gravel packing. See the Local Actions map of California for these well sites.

Conservation Areas

Figure 4. New Wells, Stimulation Notices and Conservation Areas
Click on the arrows in the upper right hand corner of the map for the legend and to view the map fullscreen.

The map in Figure 4, “New Well Stimulations and Conservation Lands”, features land use planning maps developed by California and Federal agencies for conservation of the environment for multiple uses, ranging from recreation to farming and agriculture.  Many of the Stimulation Notices as well as “new” well sites located in Kern County are located in or along the boundary of the San Joaquin Valley Conservation Opportunity; land identified by the California Department of Fish and Game, Parks and Recreations, and Transportation (Caltrans) as important for wildlife connectivity. Oil and gas development inevitably results in loss of habitat for native species. Habitat disturbance and fragmentation of the natural ecosystems can pose risks particularly for endangered species like the San Joaquin Kit Fox, California Condor, and the blunt-nosed leopard lizards.

The California Rangeland Priority Conservation Areas layer was created to identify the most important areas for priority efforts to conserve the Oak Savannah grasslands of high diversity that host many grassland birds, native plants, and threatened vernal pool species. The areas of high biodiversity value are marked in red as “critical conservation areas”. The majority of the new well stimulations are encroaching on the borders of these “critical areas,” particularly in the Belridge oil field. The CA Farmland Mapping and Monitoring Program map layer rates land according to soil quality to analyze impacts on California’s agricultural resources. The majority of new stimulations and new oil wells are located on the border of areas designated as “prime farmland,” particularly the Belridge and Lost Hills fields. The Rose field on the other hand is located within the “prime farmland” and “farmland of statewide importance.” Also, well-sites from all fields in Kern County are located on Williamson Act Agricultural Preserve Land Parcels. By enrolling in the program these areas can take advantage of reduced tax rates as they are important buffers to reduce urban sprawl and over-development. Although the point of the act was to protect California’s important farmland and agriculture, some parcels enrolled in the Williamson Agricultural Preserve Act program even house stimulation notice sites and “new” hydraulically fractured wells.

Discussion

While allowing hydraulic fracturing, acidizing and other stimulations until January 1, 2015 under temporary regulations, SB4 requires the state of California to complete an Environmental Impact Review (EIR). New regulations will then be developed on the recommendations of the EIR. The regulations will be enforced by the Division of Oil, Gas, and Geothermal Resources (DOGGR), the agency currently responsible for issuing drilling permits to operators in the state. In some municipalities of California, an additional “land-use” development permit is required from the local land-use agency (Air district, Water District, County, other local municipality or any combination) for an operator to be granted permission to drill a well. In most areas of California a “land-use” permit is not required, and only the state permit from DOGGR is necessary. A simple explanation is DOGGR grants the permit for everything that occurs underground, and in some locations a separate regulatory body approves the permit for what occurs above the ground at the surface. The exceptions are San Benito County which has a 500 foot setback from roads and buildings, Santa Cruz County, which passed a moratorium, Santa Barbara with a de facto ban*, and the South Coast Air quality Monitoring District’s notification requirements, permitting a well stimulation (such as “fracking” or “acidizing”).  For the rest of the state permitting a well  stimulation is essentially the same as permitting a conventional well-site, although it should be recognized that some counties like Ventura have setback and buffer provisions for all (conventional and unconventional) oil and gas wells. Additionally, DOGGR’s provisional regulations do require chemical disclosures to FracFocus and public notifications to local residents 30 days in advance, but lacks public health and safety provisions such as setbacks, continuous air monitoring, and the majority of wells in the notices are exempt from groundwater monitoring,   While public notifications and chemical disclosures are all important for liability and tracking purposes, they are no substitute for environmental and engineering standards of practice including setbacks and other primary protection regulations to prevent environmental contamination. The state-sponsored EIR is intended to inform these types of rules, but that leaves a year of development without these protections.
*Santa Barbara County requires all operators using hydraulic fracturing to obtain an oil drilling production plan from the Santa Barbara County Planning Commission. No operator has applied for a permit since the rule’s passing in 2011.

References

  1. DOGGR. 2014. Welcome to the Division of Oil, Gas and Geothermal Resources.  Accessed 1/28/14.
  2. Lawriter Ohio Laws and Rules. 2010. 1501:9-1-04 Spacing of wells. Accessed 1/29/14.
  3. WVDNR. 2013. Regulations. Accessed 1/29/14.
  4. Railroad Commission of Texas. 2013. Texas Administrative Code. Accessed 1/28/14.
  5. PADEP. 2013. Act 13 Frequently Asked Questions.  Accessed 1/29/14.
  6. U.S.EPA. 2008. Wyoming Area Designations for the 2008 Ozone National Ambient Air Quality Standards. Accessed 1/29/14.
  7. UT DEQ. 2014. Uintah Basin. Accessed 1/29/14.
  8. UT DEQ. 2012. 2012 Uintah Basin Winter Ozone & Air Quality Study.
  9. Wolf Eagle Environmental. 2009. Town of Dish, TX Ambient Air Monitoring Analysis.

Sustainability and Unconventional Drilling: Pt. II

Different Definitions, Shared Discourse

By Jill Terner, PA Communications Intern, FracTracker Alliance

In the previous installment of this three part blog series, I focused on how industry defines sustainability, and how industry mobilizes research done on unconventional drilling in an attempt to label drilling a sustainable practice. That sustainability lends itself to industry’s mostly economic definition. Other groups, which for the sake of this series I will refer to as pro-environmental groups, use a different definition while sharing discourse with industry. This pattern makes sustainability a good example of a boundary object1. The versatile nature of a concept like sustainability makes it possible for different groups of people to talk about it, while each maintains their own understanding of what it is. Here, I will look at sustainability through the lens of groups charged with environmental regulation and protection, and discuss how they might use the same science as industry to tell a different story.

Sustainability Defined by Environmental Groups

While industry adheres to an economic model of sustainability, pro-environmental groups factor in environmental and social sustainability. These three facets – economic, environmental, and social – comprise a more holistic definition of sustainability, wherein the benefits of one facet do not outweigh the costs associated with another2. Focusing only on one component while downplaying others, then, would be inherently unsustainable. In particular, this view means recognizing that things like water quality and the environment are not entities we can separate from things we may care more about, like economic development3.

For example, Perkins (2012) suggests taking this holistic approach to development by rejecting one-or-the-other thinking and by decentralizing community decision-making. Through this people-and-place specific method of development regulation, the voices of all participants are heard. This process leads to representation of both industrial and pro-environmental interest groups, which, in turn, propagates social equity because everyone’s voices are being heard.

In terms of economic sustainability, environmental groups view unconventional drilling as a double-edged sword. While industry related job creation might see positive gains, other sectors of the local economy may be at a loss, particularly arenas that rely on environmental conservation4. As many of the areas slated to host drilling are non-metropolitan areas where activities like agriculture, hunting, and fishing are popular, environmental interest groups warn against drilling in these regions for economic reasons. Just as general sustainability should be viewed holistically, so should economic sustainability; all sectors of the local economy should be considered, not just those related to drilling.

A good way to illustrate this point would be to look at areas like the Marcellus Shale in Pennsylvania and the southern tier of New York. Here, outdoor tourism related industries accounted for over $200 million in 20084. A potential secondary source of income for these areas is owners of second homes that are used to escape the harshness of everyday life. Public fear of industrial consequences, regardless or whether those fears are entirely realistic, could stymy these income sources for areas located over shale formations. The industrial consequences themselves could render the environment untenable to future re-development of outdoor recreational industries4.

Environmentally speaking, regulatory groups and local leaders view sustainable practices as those that occur with the least amount of environmental impact possible3. Air and water pollution primarily related to industry emissions are a major concern, however other environmental threats are also common. These include diesel emissions from truck traffic introduced by industry, degradation of the natural landscape due to industry activity, as well as noise and light pollution5, 6. All of these things must be mitigated in order to substantiate environmental sustainability.

Acknowledging that introducing industry to a community could have different direct and indirect socioeconomic impacts on different demographics and acting on this intersectionality constitutes social sustainability2. That is to say, social sustainability means making sure that all groups of a community are involved in the implementation of development, and reaching out to those members who stand to be negatively impacted by industry’s presence. As I mentioned above, making sure that all interests within a community receive fair and adequate representation is one way to do this. As one can imagine, these three components of sustainability are dynamic and connected, and weighing them against one another results in something unsustainable.

How Environmental Regulatory Groups Use Science

As I mentioned in my previous installment of this series, little detailed research has been conducted on any impacts of unconventional drilling on local economies. As a result of this, many environmental regulation and protection groups look at economic patterns that have occurred in other cities and countries. One analogy that researchers have used is that of the “resource curse.”4 This is the tendency for areas rich in natural resources to be economically poor and experience relatively slow economic growth, typically due to conflicting national and state level interests. Proponents of environmental regulation and protection warn against rapid growth of extractive practices in resource rich areas, as it could ultimately lead to a decline in economic growth and stymieing of community betterment.

Related to the “resource curse” is the boom-bust cycle4, 5. Pro-environmental groups pay equal or more attention to the bust as well as the boom. While pro-industry groups may highlight the positive economic outcomes associated with industry, those favoring regulation are quick to speak up about the research done on the bust that often follows. The bust doesn’t necessarily negate the positive findings related to the boom, however such a historical pattern makes it clear that there could be just as many negative consequences for modern day unconventional O&G extraction.

Similar to focusing on the flipside of economic impacts, regulatory groups also draw from research done on the environmental and social impacts of unconventional drilling. These components of sustainability often don’t figure into the equation in industry-funded studies4, so considering them sheds more light on the holistic definition of sustainability. Environmentally speaking, pro-environmental groups focus on studies that address a cumulative hazard, rather than just that of one or two emissions. That is, instead of saying that levels of two or three notable pollutants are below EPA thresholds, studies should refer to the cumulative effect of all the possible pollutants.

With regards to unconventional drilling, preliminary and industry funded studies found that the amount of CO2 released was half that of conventional coal combustion. Later, however, burgeoning research indicated that other pollutants, such as ground level ozone in the air and heightened levels of manganese, strontium, and toluene in the water table can pose a great risk when considered together7.

Additionally, pro-environmental groups focus on the social costs of unconventional drilling. By doing community based participatory research8, as well as focusing on noise and light pollution as consequences that can detract from residents’ quality of life, researchers often find that the presence of industry in communities can be taxing on residents9. Although there is a lack of research on the social impacts of drilling, what little has been done has indicated that if existing social inequalities are not addressed as part of the holistic definition of sustainability, they can worsen after industry becomes present in a community4. Importantly, those who promote regulation espouse the viewpoint that these social burdens are not a necessary cost of industry that might be mollified by economic boons. On the contrary, the social piece is equally as important as the economic and environmental portions of the sustainability pie.

Next Time

In the final installment of this three part series, I will discuss how these two different definitions of sustainability inform the court of public opinion when it comes to the development of unconventional drilling.

Sources

1. Star, S. L., & Griesemer, J. R. (1989). Institutional ecology, ‘translations’ and boundary objects: Amateurs and professionals in Berkeley’s museum of vertebrate zoology, 1907-39. Social Studies of Science, 19, 387-420.

2. Perkins, N. D. (2012). The fracturing of place: The regulation of Marcellus Shale development and the subordination of local experience. (research paper). Retrieved from Duquesne University School of Law Legal Studies Research Paper Series. (2012-17).

3. Dernbach, J. C., & Bernstein, S. (2003). Pursuing sustainable communities: Looking back, looking forward. The Urban Lawyer, 35(3), 495-532.

4. Barth, J. M. (2013). The economic impact of shale gas development on state and local economies: Benefits, costs, and uncertainties. New Solutions, 23(1), 85-101.

5. Brasier, K. J., Filteau, M. R., McLaughlin, D. K., Jacquet, J., Stedman, R. C., Kelsey, T. W., & Goetz, S. J. (2011). Residents’ perceptions of community and environmental impacts from development of natural gas in the Marcellus Shale: a comparison of Pennsylvania and New York cases. Journal of Rural Sociology, 26(1), 32-61.

6. Korfmacher, K. S., Jones, W. A., Malone, S. L., & Vinci, L. F. (2013). Public health and high volume hydraulic fracturing. New Solutions, 23(1), 13-31.

7. Smith, K.R., Frumkin, H., Balakrishnan, K., Butler, C. D., Chafe, Z. A., Fairlie, I., Kinney, P., Kjellstrom, T., Mauzerall, D. L., McKone, T. E., McMichael, A. J., & Schneider M. (2013). Energy and human health. Annual Review of Public Health, 34, 159-188.

8. Perry, S. L. (2013). Using ethnography to monitor the community health implications of onshore unconventional oil and gas developments: examples from Pennsylvania’s Marcellus Shale. New Solutions, 23(1), 33-53.

9. Ferrar, K. J., Kriesky, J., Christen, C. L., Marshall, L. P., Malone, S. L., Sharma, R. K., Michanowicz, D. R., & Goldstein, B. D. (2013). Assessment and longitudinal analysis of health impacts and stressors perceived to result from unconventional shale gas development in the Marcellus Shale region. International Journal of Occupational and Environmental Health, 19(2), 104-112.

Ohio Hydrocarbon Production Well Inspections and Violations

Inspections and Violations in Ohio

Only a few states in the U.S. currently release free violations data related to unconventional oil and gas drilling. The Ohio Department of Natural Resources (ODNR) maintains an inventory of well inspections and violations within its RBDMS database. We examined and mapped their data with a focus on hydrocarbon (oil and natural gas) production wells and relevant Class II Injection1 wells – where the high volumes of liquid wastes produced during hydrocarbon extraction are often disposed of, deep within the earth.

By the Numbers

As of January 2013 there were a total of 5,954 hydrocarbon well inspections and 956 “True” violations. “True” violations refer to those inspections that were deemed to be in violation of the Ohio Revised Code (OAC) Chapter 1501:9-3 Saltwater Operation or Chapter 1501:9-1 Oil Well Drilling.  Violations and/or inspections tend to fall under a couple of categories including compliance notices, neighbor phone call, or routine field visits or inspections. There have been 470 and 430 “Complaint” and “Request” based inspections to date, respectively (Table 1).

This graph depicts monthly and cumulative Ohio hydrocarbon production well inspections and ODNR deemed "True" violations between September 2010 and January 2013.

Figure 1. Cumulative OH hydrocarbon production well inspections & ODNR determined true violations (Sept 2010 – Jan 2013)

The ratio of inspections to violations issued over time in Ohio has been somewhat variable, but a trend does seem to be slowly emerging. At the present time average hydrocarbon well inspections are increasing by 7 per month, while true violations are only increasing by 0.5 per month (Figure 1)2. Thus, the ratio of inspections-to-violations declined from its September 2010 high of 13.2 to 3.1 in February 2011. This ratio, however, began to rise shortly thereafter.

Assuming the current trajectory holds, the next ODNR RBDMS update should report approximately 11,696 inspections as of the end of January 2014 and more than 48,000 total inspections by January 2018. This trajectory dictates that we will see roughly 1,500-1,600 true violations by January 2014 and approximately 4,500 by January 2018.

Map Description

The map below displays a monthly updated inventory of Ohio’s hydrocarbon and relevant injection well-related violations. This map will be updated monthly around the 25th of each month. We have established fixed search criteria for the RBDMS Microsoft Access database, which is updated weekly. Inspection purposes include general complaints, civil action, compliance agreement, and criminal actions, while there are myriad inspection descriptions (Table 2).

To view the legend, metadata, and map fullscreen click on the arrows in the top right hand corner of the map.

Inspection Data Availability and Analysis

Significant data gaps exist with respect to latitude-longitude across Ohio’s current inventory of Class II and hydrocarbon well inspections (Note: Data is only available up to February 2013). Below we have analyzed the current gap between “Total” inspections and those “w/Latitude-Longitude” data. We are currently working to close these gaps. The largest gap exists for the “Salt Water Injection Wells All Time” (i.e., Hydraulic Fracturing Waste Class II’s) data with only 3.5% of all inspections accompanied by latitude-longitude coordinates.

Production Wells

  • Pre 9/1/2010 (i.e., First Ohio Utica Permits)
    • Total: 63,707
    • w/Latitude-Longitude: 24,912
    • 39% coverage
  • Post 9/1/2010 (i.e., First Ohio Utica Permits)
    • Total:  13,735
    • w/Latitude-Longitude: 5,917
    • 43% coverage

Salt Water Injection Wells All Time

  • Total: 11,939
  • w/Latitude-Longitude: 413
  • 3.5% coverage

Annular Disposal + Enhanced Oil Recovery + Orphan + Solution Mining Project + Storage Well

  • Total: 15,694
  • w/Latitude-Longitude: 5,300
  • 33.8% coverage 

Tables

The primary columns of importance to the public in the tables below are “Inspection Purpose”, “Inspection Description”, and “Notification Type.” Eighty-three percent (83%) of the state’s production well inspections were for what seem to be routine “Status Checks.” With respect to notification type, most were categorized as “Unknown” (Tables 1 and 3).
Table 1. Ohio production and Class II injection well Inspection Purposes

Code

Definition

Number of Inspections

C

Complaint

470

CAF

Civil Action Follow-up

4

CMF

Compliance Agreement Follow-up

4

NMF

Notice of Material or Substantial Follow-Up

2

NVF

Notice of Violation Follow-Up

99

OF

Order Follow-Up

4

R

Request

430

SC

Status Check

4,802

Unknown

3

Table 2. Ohio production and Class II injection well inspection descriptions

Description

Failure to maintain record of pipeline location

Inadequate pipeline strength

Failure to properly bury pipeline

Well operation causing pollution and contamination

General Safety

Well insufficiently equipped to prevent escape of oil and gas

Failure to legibly identify well

Violation of tank spacing requirements

Violation of tank fire heater spacing requirements

Unattended portable heater less than 50 feet from  tank

Violation of separator spacing requirements

Operating tank heater while oil is being produced

Improperly located oil tank

Equipment pressure rated below operating pressure

No SPCC dike/or failure to keep dike free of water or oil

Unlawful venting or flaring of gas

Failure to have required locks, bull plugs

Well incapable of production

Illegal/Unauthorized annular disposal of brine

Unlawful method of storage or disposal of brine

Dike or pit not able to prevent brine escape

Unlawful use of pit for temporary brine storage

Use of pit of dike for ultimate disposal of brine

Disposal of muds or cuttings in violation of a rule

Failure to keep dike or pit free of brine / other wastes

Illegal/Unauthorized annular disposal of brine

Non registered operator/ Bond/ Insurance

Table 3. Ohio production and Class II injection well notification types

Code

Definition

Number of Inspections

CN

Compliance Notice

470

FVI

Field Visit or Inspection

225

LET

Informal Letter

2

NOV

Notice of Violation

74

OTH

Other Notification

8

PHN

Phone Call

225

Unknown

4,810


Endnotes

1. Relevant Class II wells include Salt Water Injection, Annular Disposal, Enhanced Oil Recovery, Orphan, Solution Mining Projects, and Storage Wells

2. If we remove the first month of 2013, the former increases to 9 per month and the latter 0.8 per month.

Songbird Nurseries of Pennsylvania

Guest Blog by Paul T. Zeph, Director of Conservation for Audubon Pennsylvania

Millions of small, beautiful, colorful songbirds that live in the tropics for most of the year venture north each spring to Pennsylvania to nest in our deep, quiet forests—forests that are now in danger of being fracked apart into industrial zones of natural gas extraction.

Pennsylvania’s forests provide nesting habitat for 17% of the world’s Scarlet Tanagers. Photo courtesy of the PA Gaming Commission.

Pennsylvania’s forests provide nesting habitat for 17% of the world’s Scarlet Tanagers. Photo by Jake Dingel, via the PA Game Commission.

The names of these birds are often described by their vibrant colors:  Black-throated Blue Warbler, Scarlet Tanager, Cerulean Warbler, or Rose-breasted Grosbeak. Here, in the deep remnants of Penn’s Woods, they find an abundance of caterpillars and other insects that are critical protein for raising baby birds. Once the young are fledged and finding food on their own, the parents and juveniles head back south in early fall to their “non-breeding” habitat, which is more accurately called the Neotropics; that is, the New World tropics of the Caribbean, Central America and South America.

Most of these Neotropical migrants cannot nest successfully in small woodlots or fragmented forests, and depend upon large, undisturbed tracts of woodland that we call “core” forests.  These are forests that are at least 300 feet from a permanent edge – such as a road, utility corridor, or housing development.  Pennsylvania still has some very large forest blocks, primarily in the northern tier of the state, that serve as bird “nurseries”—places where the nest density is high and many species are successfully fledging young.

A recently-completed Pennsylvania Breeding Bird Atlas is undergoing analysis by many researchers, and the data is helping us to identify the “best of the best” places in the state needed to sustain populations of our Neotropical visitors, for which we have a North American responsibility.  Not surprisingly, these quiet, large blocks of forest are also favorite places for humans to use for passive recreation, relaxation, and spiritual renewal.  If you want a quiet, peaceful place to escape the modern world for a weekend, look for places frequented in June by Blackburnian Warblers or Blue-headed Vireos.


Unconventional drilling and key forest songbird habitat in Pennsylvania. To access the legend, layer descriptions, and other tools, click on the expanding arrows icon in the top-right corner of the map.

Since many populations of our Neotropical species have been dramatically declining over the past 50 years, we need to protect as much nesting habitat as possible.  In 100 years, we will probably see many species disappear from Pennsylvania altogether due to fragmentation and climate change.  Our northern forest blocks may be a last refuge for a number of bird and other animal species that cannot survive in our sprawling suburbs or the ecological changes that will come with a warming planet.

Extensive gas infrastructure in forested Pennsylvania land. Photo by Pete Stern, 2013.

Extensive gas infrastructure in forested Pennsylvania land. Photo by Pete Stern, 2013.

Fracking is a heavily industrialized activity that not only causes short-term fragmentation, noise, and ecological disruption, but can lead to long-term ecological collapse of healthy, intact forest blocks.  Birds are only one of many types of animals that are impacted by the vast array of fracking infrastructure that is becoming all-too-common in our state’s quiet and shady bird nurseries, trout streams, and recreation areas:  widened roads letting in sunlight and nest predators; long, wide pipelines creating miles of permanent edge; thousands of acres of forest floor buried under compacted gravel pads; rain events carrying road and well pad gravel into sensitive headwater streams, burying aquatic life.

We have precious few public lands left in Pennsylvania that have not been leased for mineral extraction.  We must do all that we can to prevent leasing of lands where the state owns the mineral rights; and, where the rights are severed and owned by another, we must find compromises and solutions that keep as much of the forest intact as possible.

Louisiana Shale Viewer Added to FracMapper

Louisiana is the 21st state to have its own shale viewer map on the FracMapper section of our website:


Louisiana Shale Viewer. Please click expanding arrows icon in upper-right corner of the map to access additional details, including the legend.

In addition to production wells and salt water disposal wells, which are available in most states, Louisiana also has some data that is relatively rare, including pits, storage wells, and inspections.  In addition, most of these datasets contain additional information that can be accessed by links in the popup boxes.  Due to the large number of features on the map, users will need to zoom in several clicks, to the point where the “generalized” layers are replaced with the actual data layers.

Controversial Pinelands Pipeline Defeated

For many months, a battle has been raging in New Jersey about whether to convert the coal-burning BL England power plant to natural gas. While coal-burning is relatively more polluting (especially in terms of sulfur dioxide, NOx, and carbon dioxide emissions) and more expensive than natural gas, natural gas power plants bring with them other concerns. In order to repower this plant on the shore of Cape May County, a 22-mile-long pipeline was proposed to be built through the 1.1-million acre New Jersey Pinelands National Reserve, a sensitive wetland habitat that straddles the Cape May and Cumberland County lines. The pipeline would have run adjacent to Rt 49, a main highway that bisects the Pinelands. Although the administration of Governor Chris Christie had lobbied strongly for the project, saying that the pipeline would go under and alongside existing roads, opponents of the project felt that that it posed too much of a threat to state- and federally-regulated wetlands and other Natural Heritage sites.


Map of Proposed Pinelands Pipeline plan (defeated). For a full-screen version of this map (including map legend), click here.

On Friday, January 10, the New Jersey Pinelands Commission rejected the proposal by New Jersey Gas to move ahead with the project. According to the New York Times, New Jersey Gas would have been exempt from a ban on additional transmission pipelines through the Pinelands because they were including an offer to acquire and preserve two to three thousand acres of land near the pipeline route. Now, the next decision will be whether to find an alternate route for gas delivery to the plant if it is converted, keep the plant running on coal, or, perhaps, like has been suggested for other sites like the Cayuga and Dunkirk plants in New York State, choose to upgrade the efficiency of transmission lines, and capture energy that is currently lost.

For more information:
New Jersey Pinelands National Reserve National Park Service website
New Jersey Officials Back Pinelands Pipeline NY Post, 12/12/2013
Panel Blocks Gas Pipeline in New Jersey Pinelands New York Times, 1/11/2014
Controversial Repowering of the Cayuga and Dunkirk Coal-fired Power Plants, Earthjustice website
Coal-To-Natural-Gas Switch For Power Generation Is Paying Off In Smaller Carbon Footprint, International Business Times, 1/14/2014

Data sources
National Wetlands Inventory: US Fish and Wildlife Service

Letter of Inquiry from a Public Health Professional

By Mary Ellen Cassidy, Community Outreach Coordinator

I recently came across a letter by Dr. Alan Ducatman, MS, MD, Professor of Public Health and Medicine at WVU in Donald Strimbeck’s updates.  It stuck me by its sincerity, logical tone, and reasonableness.

Drilling Spill SampleDr. Ducatman’s letter begins by commenting on the gas industry’s response to a surface spill in Garfield County.  The industry’s response to this spill, an Energy In Depth Blog (12/20/13), includes the following statement, “We all know spills are bad and can cause problems, so what exactly did they expect to find?”

Dr. Ducatman’s letter looks past the rather snide tone of the response to commend the industry for its honest acknowledgement that spills do occur and bad things can and do happen.  Dr. Ducatman notes that, although the response “lacks consistency with past and present behavior in public forums,” he hopes to see it become a “consistent and reasonable position” in the future.

The letter then calls on industry to be more scientific and open in their communications regarding other issues such as quality assurance, worker safety, well casing failures, leaks, water testing impediments, public protection practices, and reporting, while reminding the industry of the human and economic costs of externalities and the “terrible weight” of these collateral impacts on communities.

It occurred to me, upon reading this letter that more of us need to ask questions of the industry and take action to protect and support our impacted communities. Not only do we need more professional researchers like Dr. Ducatman asking questions, we also need many more people on the ground _DSC4465documenting what is happening around them to hold the industry accountable.

FracTracker Alliance aims to empower and equip volunteers to track and document unconventional gas and oil activities. Options for engagement include:

  • Trail Logbook – addressing trail-based observations about physical and experiential conflicts related to oil and gas development
  • The US Map of Suspected Well Water Impacts – aggregating cases of home drinking water problems that may be associated with oil and gas exploration
  • The new FracTracker mobile app (for iPhones) – making it easy  to take photos and record information on various oil and gas impacts in your neighborhood or afar. We are currently in the pilot testing phase of this app, which can also be used to contribute data to the other two programs described above.

These programs depend on crowdsourced information from you and others to grow a national database on the extensive footprint of the industry.  Check out our website and projects to see where you fit.

In addition, we always welcome your ideas on how our mapping and other services can help your community’s efforts to protect its health and natural resources.

Contact me to learn more about how you can become a part of the FracTracker team, and a special thank you to Dr. Alan Ducatman for his letter reenergizing this important conversation.

If you are one of those people ready to work together in a concerted effort towards a more positive energy future, FracTracker needs you.


Mary Ellen Cassidy, Community Outreach Coordinator
Cassidy@FracTracker.org
304-312-2063

Hydrocarbon Industrial Complex Map In Detail

Below is a brand new map from our team that contains multiple data layers that speak to the myriad players and facilities involved in the North American hydrocarbon network – from upstream processing facilities to transporters and export terminals. This map helps us to demonstrate the complexity of the hydrocarbon industry, because we often assume that hydraulic fracturing or related extractive techniques are local issues. However, there is actually a tremendous – and growing – interconnectivity between production, transport, processing, usage, storage, and export.


To see a fullscreen version of this map, along with a legend and description, click on the arrows in the upper right hand corner of the map.

Data Descriptions

EIA Sources: Peak Shavers, Underground Natural Gas Storage, Compressor Station, Natural Gas HUBs, and Pipeline Data

Peak Shavers are:

…used for storing surplus natural gas that is to be used to meet the requirements of peak consumption later during winter or summer. Each peak-shaving facility has a regasification unit attached but may or may not have a liquefaction unit…[they] depend upon tank trucks to bring LNG from other nearby sources to them. Of the approximate 113 active LNG facilities in the United States, 57 are peak-shaving facilities. The other LNG facilities include marine terminals, storage facilities, and operations involved in niche markets such as LNG vehicular fuel. Learn more

The data included in this map include 109 Peak Shavers vs. the aforementioned 57.

  • Regional distribution: 7 Central US, 12 Midwest, 53 Northwest, 24 Southeast, 5 Southwest, 8 Western
  • 106 of which are active and 3 under construction

The Underground Natural Gas Storage Facilities (UNGSF) layer is an EIA-defined collection of 413 facilities1, a definition that includes “pipelines, local distribution companies, producers, and pipeline shippers with an inventory management tool, seasonal supply backup, and access to natural gas needed to avoid imbalances between receipts and deliveries on a pipeline network.” (For a more detailed description of UNGSF, see the EIA’s description)

Compressor Stations are designed to ensure:

…that the natural gas flowing through any one pipeline remains pressurized, compression of this natural gas is required periodically along the pipe…usually placed at 40 to 100 mile intervals along the pipeline. The natural gas enters the compressor station, where it is compressed by either a turbine, motor, or engine…[they] gain their energy by using up a small proportion of the natural gas that they compress.

For a more detailed discussion of the importance and design of compressor stations, refer to NaturalGas.org’s The Transportation of Natural Gas.

  • This layer includes: 1,756 compressor stations with the following regional distribution: 207 Canadian, 344 Central US, 14 Gulf Coast, 169 Midwest, 249 Northeast, 191 Southeast, 450 Southwest, and 132 Western stations
  • The mean and total horsepower across 1,417 of these facilities is 10,411 and 18,282,484, respectively, with average and total throughput of 660 and 1,159 Billion Cubic Feet (BCF)2.

Natural Gas HUBs are broken down by operator type with 26 “Market Center”, 31 “Market Hub”, 3 “Production Hub”, and 3 “Storage Hub” facilities included.

  • Regional distribution: 9 in Canada, 7 across the Central US, 4 in the Midwest, 8 in the Northeast, 4 in the Southeast, 24 in the Southwest, and 7 in the Western US.
  • All facilities were activated between 1994 and 1998
  • Status: 5 Canceled, 13 Inactive, 36 Operational, and 9 Proposed HUBs

Pipeline segments are parsed by type: a) 69 sections totaling 1,627 miles described as “Gathering” at an average diameter of 17 inches, b) 18,905 segments totaling 127,049 miles as “Interstate” with an average diameter of 15 inches, and  c) 15,152 “Intrastate” segments totaling 66,939 miles and an average diameter of 2.8 inches.

Select states statistics:

  1. 7,450 segments were located in Texas with a total length of 44,600 miles,
  2. 1,313 segments were located in California with a total length of 6,370 miles,
  3. 2,738 segments in Louisiana with a  total length of 15,330,
  4. New York and New Jersey are home to a combined 2,315 pipeline segments with a total length of 4,015 miles,
  5. 859 segments and 5,935 miles in Ohio,
  6. Great Lakes bordering states contain 6,841 pipeline segments totaling 33,457 miles,
  7. Pacific Northwest states including Washington, Oregon, Idaho, and Montana contain 1,765 segments totaling 6,121 miles,
  8. Gulf Coast states sans Texas contain 3,886 pipeline segments totaling 25,775 miles.

The above datasets were compiled by Ted Auch and Daniel Berghoff of the FracTracker Alliance or sourced from the US Energy Information Administration via their Natural Gas data portal and their analysts Tu Tran and Robert King.

US River and Coastal Export/Import Ports

US inland (i.e., Mississippi River) and coastal ports are the singular ways in which all manner of hydrocarbons are transported to downstream processing facilities and subsequently used domestically or exported. The data contained herein include 12 Mississippi, 7 Ohio and Tennessee River, and 11 Columbia river ports along with 16 Great Lakes/St. Lawrence river ports (Table 1).

Table 1. Number of inland and coastal US and territories ports as of December 2013.

State

Number of Ports

State

Number of Ports

AK

40

MO

2

AL

7

MS

3

AR

2

NC

2

CA

9

NJ

2

CT

3

NY

6

DE, VA, MD, & DC

6

OH

2

FL

17

OK

2

GA

2

OR

13

HI

7

PA

2

IA

1

PR

1

ID

1

RI

1

IL

4

SC

1

KY

2

TN

4

LA

13

TX

11

MA

3

VI

1

ME

2

WA

6

MI

6

WI

4

MN

4

WV

2

US Coal Plants & Emissions

We were pointed to this data by Source Watch’s “Coal Swarm” project’s Director Ted Nace and researcher Joshua Frank. Learn more. The layer includes coal used, emissions of carbon dioxide (CO2), sulfur dioxide (SO2), methane (CH4), oxides of nitrogen (NOX), and mercury (Hg). Also included are the number of deaths across a variety of categories and emergency room visits attributed to each coal plant, along with estimates of the valuation of each of these. The raw data are available from the the US EPA’s Emissions & Generation Resource Integrated Database (eGRID) comprehensive data portal with the “Version 1.0” ZIP file containing: “spreadsheet files, state import-export files, Technical Support Document, file structure document, Summary Tables, GHG output emission rates, the EUEC2010 paper, and graphical representations of eGRID subregion and NERC region maps. Data in this file encompasses years 2009, 2007, 2005 and 2004.” The data were most recently updated on May 10, 2012 in order to include 2009 data.

Transload Facilities Directory

Directory Description:

Rail-to-truck transload facilities where cargo is transferred between tank trucks and water or rail transportation…These bulk material handling companies also provide information such as products handled, services and equipment available, and methods for dry bulk product transfer…These intermodal locations are owned or operated by trucking companies, railroads, or independent bulk terminal operators. Unless the prohibition is stated, these businesses have indicated they allow outside carriers to load products at their facilities. Learn more

Services Key:

  • Products handled: a. Acids, b. Chemicals (liquid), c. Chemicals (dry), d. Asphalt, e. Foods (liquid), f. Foods (dry), g. Plastics (dry), h. Petroleum products
  • Services/equipment available: a. Air compressor, b. Scale, c. Blending meters, d. Sampling service, e. Hot water heating, f. Steam heating, g. Tank trailer cleaning, h. Liquid storage tanks, i. Liquid pumps
  • Dry bulk product transfer by: a. Vacuum trailer, b. Auger, c. Blower, d. Gravity (trestle), e. Portable vacuum/air conveyor, f. Bulk conveyor

Intermodal Tank Containers

Those facilities “that have actual storage depot operations. The operators specialize in both the handling and storage of ISO containers.” Learn more

Intermodal tanks are:

… intermodal container[s] for the transport of liquids, gases and powders as bulk cargo…built to the [International Organization for Standardization] Standard, making it suitable for different modes of transportation. Both hazardous and non-hazardous products can be transported in tank containers. A tank container is a vessel of stainless steel surrounded by an insulation and protective layer of usually Polyurethane and aluminum. The vessel is in the middle of a steel frame. The frame is made according to ISO standards and is 19.8556 feet (6.05 meters) long, 7.874 feet (2.40 meters) wide and 7.874 feet (2.40 meters) or 8.374 feet (2.55 meters) high. The contents of the tank ranges from 27,000 to 40,000 liters (5,900 to 8,800 imp gal; 7,100 to 11,000 U.S. gal). There are both smaller and larger tank containers, which usually have a size different from the ISO standard sizes. The trade organization @TCO estimates that at the end of 2012 the global fleet of tank containers is between 340,000 and 380,000. (Wikipedia definition)

Services Key: a. Storage, b. Cleaning, c. Container shuttle service, d. Container drayage, e. Steam/electric heat, f. Rail siding, g. Repair/refurbishing, h. American Bureau of Shipping (ABS) certification, i. American Society of Mechanical Engineers (ASME) certification, j. ISO 9000 certification, k. 2.5- and 5-year ABS testing, l. Reefer tank repairs, m. Parts supply

Abbreviations: SC=straddle carrier, TLSL=top-lifting side-loader, D/D=drop-deck

MarkWest Facilities

Facility locational data gathered from the company’s operations website.

Cargo Tank Repair Directory

“Bulk Transporter’s Cargo Tank Trailer Repair Directory…the most comprehensive listing of repair facilities that service tank trucks and tank trailers. Additionally, many of these facilities offer custom fabrication. Most listings include services offered, but tank truck operators are encouraged to contact the facilities directly for more information…The first six items listed on the “Services Key” are the DOT tests and inspections required by federal law. Companies listing “R” or “U” stamps were asked to provide Bulk Transporter with a record of their accreditation. The federal CT registration number also was requested for the tank repair shops in the directory.” Learn more

Repair Services Key:

1. External visual inspection, 2. Internal visual inspection, 3. Lining inspection, 4. Leakage test, 5. Pressure retesting, 6. Thickness testing, 7. MC330/331 retesting, 8. Vapor recovery testing, 9. Bottom-loading conversion, 10. Major barrel repair, 11. Tank passivation, 12. Sandblasting/painting, 13. Tank changeouts, 14. Tank degassing, 15. Tank cleaning (for repair only), 16. Custom fabrication, 17. Purchase wrecked trailers, 18. Pick-up & delivery, 19. Lining repair, 20. ASME “U” stamp, 21. National Board “R” stamp

Soon To Be Added Data:

Tank Cleaning Directory

The Commercial Tank Cleaning Directory…information…was supplied by the operators of commercial and carrier-owned tank wash facilities that provide cargo tank interior cleaning. Directory listings may include product limitations such as “food grade only” or “no hazmat.” Learn more


Footnotes

[1] 407 active and 6 inactive facilities; Region –

  1. 259 “Consuming East” primarily within depleted reservoirs providing supplemental backup and/or peak period supply,
  2. 49 “Consuming West” primarily for domestic US and Alberta gas to flow at constant rates, and
  3. 105 “Producing” facilities which are primarily responsible for hydrocarbon basin export connectivity, transmission, and distribution and allow for the storage of currently redundant natural gas supply; Field Type Affiliation – 43 aquifers, 331 depleted fields, and 39 salt domes. Learn more

[2] These total horsepower and throughput figures are up from 13.4 million and 743 BCF in 1996.

So, Where’s that North Carolina Map?

Sometimes, one vote really does make a difference.  When the North Carolina state legislature attempted to override then-Governor Beverly Perdue’s veto of a bill designed to allow hydraulic fracturing and horizontal drilling in the Tar Heel State back in July 2012, one legislator pressed the wrong button, and was not allowed to correct her vote.  With that, proponents of the law had enough votes, and historical laws banning horizontal production wells and injection wells were stricken from the books.

So now that it’s legal, where’s the North Carolina map?

Our maps section has maps for over 30 states, numerous maps of national interest, and one for British Columbia, as well.  There have certainly been numerous requests from people in North Carolina in the year and a half since Governor Perdue’s veto was overridden for us to map their state.

It’s true that our small staff is still working on backlog of states to be added to our collection of shale viewer maps.  It’s also true that some states produce insufficient data to map their unconventional oil and gas efforts.  For example, neighboring Tennessee’s Department of Environment & Conservation has no data at all available on their website (a fact that I have verified through personal correspondence).

But in North Carolina, the reasons are different.  While horizontal drilling and injection wells are now legal, essentially paving the way for development with hydraulic fracturing, the law that was passed over the veto mandated that the Mining and Energy Commission develop a regulatory framework for the modern drilling techniques.  The Commission is  still in the process of putting that together, and should be finished by October 1, 2014.

So stay tuned.

This post was updated on February 13, 2015 to fix a broken link and provide a more accurate estimate for the number of shale viewer maps we offer.

Renewal

By Brook Lenker, Executive Director, FracTracker Alliance

This isn’t a call for membership (we really don’t have members, but we do accept donations through the donate button on our home page), it’s a pause for gratitude, reflection, and sharing of good news and good will as we begin 2014.

In our expanding efforts to communicate impacts of the global oil and gas industry and inform actions that positively shape our energy future, the FracTracker Alliance is pleased to have Mary Ellen Cassidy join the staff as Community Outreach Coordinator. Mary Ellen has a diverse background as a teacher, researcher, and program director. She has a passion for energy issues – including promoting awareness of climate change and the need for energy conservation and efficiency – and her research has focused primarily on extractive industries’ impacts on community watersheds. FracTracker’s national outreach and education initiatives will be the thrust of her new role. Those initiatives include an emphasis on crowd-sourced data collection.

Crowdsourcing is – by the Wikipedia definition – “the practice of obtaining needed…services or content by soliciting contributions from a large group of people,” and we see great opportunity to learn more about the effects of hydraulic fracturing via observations, photos, and measurements from people across the country and around the world. With Mary Ellen aboard and a new mobile app, our capacity to foster crowdsourcing can blossom and the more we learn, the more we can show, tell, and enlighten.

Mary Ellen also gives FracTracker a missing presence in West Virginia – where many communities are grossly burdened by the heavy foot of shale gas development. While her role is different from our state coordinators, her location in Wheeling presents advantages for partnering with West Virginia organizations and institutions underscoring our vision to be a leading resource on oil and gas issues and a trusted asset to the concerned public. We are rooted in collaboration.

From West Virginia to California, Pennsylvania, New York, Ohio and everything in between, our work and reach is empowered by our funders, enriched by our partners, and in service of communities and people in need. The first two renew and infuse our vigor; the latter we hope will find renewal in 2014 through the collective efforts of many.

So as we continue our quest for truth and transparency in a new year, I profusely thank my smart, energetic and hyper-dedicated staff – Sam, Matt, Karen, Ted, Gwen, Kyle, and Mary Ellen – for their ceaseless efforts. My appreciation also flows to the FracTracker board– John, Mike, Brian, Ben, and Sara – for their ongoing guidance.

On behalf of the staff and board, I extend a world of thanks to our funders, past and present:

  • Heinz Endowments
  • George Gund Foundation
  • Park Foundation
  • 11th Hour Project
  • Hoover Foundation
  • Foundation for Pennsylvania Watersheds
  • William Penn Foundation

And we thank the multitude of grassroots groups – of various sizes and geographies -and academic researchers who tirelessly address the challenges of unconventional fossil fuels. If we haven’t worked together in the past, perhaps this is the year we can.

Finally, we thank the thousands of people who have visited FracTracker.org, who follow us via social media, or met us at conference or training. We hope we’ve been informative, helpful, and invigorative…fueling a new-found energy.