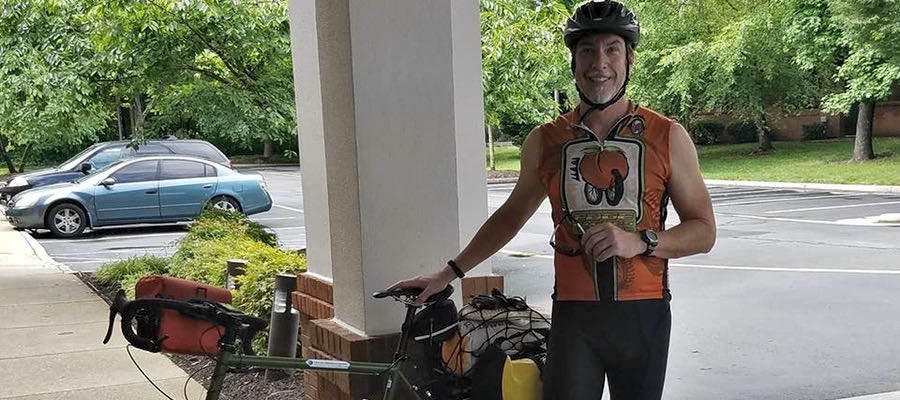
We are excited to announce that FracTracker will be the beneficiary of a cross-country cycling expedition! Starting today, Dave Weyant of San Mateo, California will set out on a 4,262 mile cross-country journey on the Transamerica Route from tidewater Virginia to the Oregon Coast. The funds raised through this ride will be used by FracTracker to conduct tours and presentations to college and high school students – to show them first-hand or through compelling maps and imagery the harms that accompany oil and gas development and the better energy options available now. If you’d like to donate, please visit Dave’s Go Fund Me page. We appreciate your contribution for this important purpose.
Interview with Dave Weyant:
We interviewed Dave to learn more about his motivations for the trek and for supporting FracTracker.
When did you start thinking about doing this adventure?
Since 1976, when the Trans Am trip was first done to celebrate the bicentennial; I was 10 years old.
What excites you most about this trip/what are you looking forward to?
The self-reliance aspect of it, the fact that all I have will be on my bike. And all those miles, slowly seeing the US landscape change. I imagine I’ll have to eat a lot, too, and I enjoy eating.
What do you think will be the greatest challenges?
Humidity, bad weather, and a few things to be determined that I hadn’t planned for.
Why are you helping out FracTracker?
I’m concerned about fracking and fossil fuel development, especially the effects on the environment, drinking water, and how all this activity tends to slow or detract from investments in renewable energy. Being a history teacher, I hate the thought of someone looking back on us and saying “what were they thinking?”
What gives you hope that we can save the planet and effectively fight climate change?
Young people who care and are informed.
What was your favorite cycling experience to date?
Cycling down the coast from San Francisco to LA. Beautiful!
Why should others take up cycling? Why is it important to you?
It is a clean source of transportation. It keeps us healthy, removes cars from the road, and takes you back to being a kid pedaling through your neighborhood.
Check back throughout the summer for more articles & info about Dave’s experiences on the road.
https://www.fractracker.org/a5ej20sjfwe/wp-content/uploads/2016/05/Dave-Weyant-Feature.jpg400900FracTracker Alliancehttps://www.fractracker.org/a5ej20sjfwe/wp-content/uploads/2021/04/2021-FracTracker-logo-horizontal.pngFracTracker Alliance2016-05-31 15:15:502020-03-05 11:51:13Pedal Power for the Planet
As part of our staff spotlight series, learn more about Kyle Ferrar and why he works with FracTracker Alliance to conduct and communicate research on the public health impacts associated with the oil and gas / fossil fuel industry.
Time with FracTracker: I’ve been working with FracTracker since its inception in 2010, and started as an official staff member in July, 2014.
Nickname: Ky
Education: BS from the University of Pittsburgh; and MPH from the University of Pittsburgh Graduate School of Public Health, where I am currently a DrPH candidate.
Office Location: I have an office in downtown Oakland, CA.
Title: Western Program Coordinator
What do you actually do in that role?
My major role as the Western Program Coordinator consists of a variety of responsibilities of operating a FracTracker Alliance branch office. In addition to the contributions of analyses and research that is documented on FracTracker’s California (and other western states’) page, my activities include fundraising, community outreach, and acting as an expert adviser on public health impacts for policy makers, regulators, other research institutions, at conferences, and directly to the public.
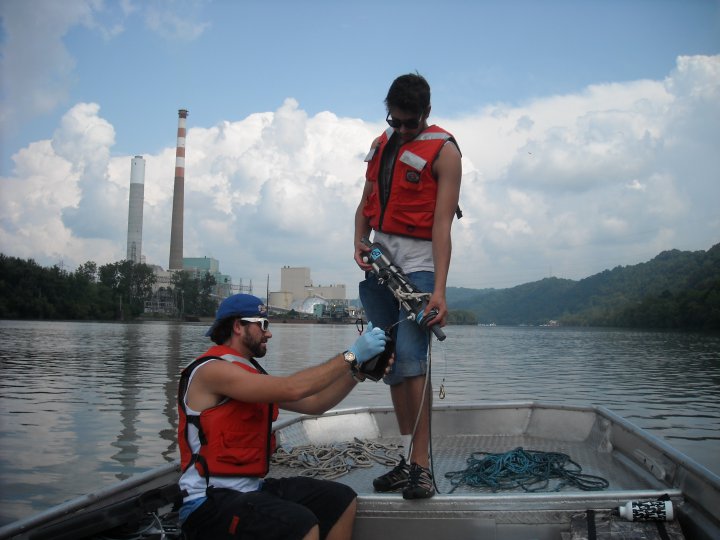
Kyle Ferrar (right) taking water samples
Previous Position and Organization
My previous research as a staff member with the Center for Healthy Environments and Communities (CHEC) at the University of Pittsburgh focused on public health impacts from various sectors of the fossil fuel industry, including Marcellus Shale development. In the picture to the right, you can see a CHEC colleague and I collecting water samples from the Allegheny River, next to a coal fired power plant.
How did you first get involved working on oil and gas issues / fracking?
As a steward to my local environment in Southwestern Pennsylvania, I was alerted of the concerns many residents were feeling as a result of the rapid increase of industrial presence in rural Pennsylvania resulting from Marcellus Shale natural gas extraction. The connections our CHEC had made in the past using community based participatory research methods to address and study other sources of environmental degradation were a vital resource for understanding what was really happening – on the ground.
What is one of the most impactful projects that you have been involved in with FracTracker?
The majority of my time is spent working on my computer, and cleaning and massaging datasets in spreadsheets. This is necessary and important, but incredibly tedious and far-removed. One project in 2015 that started this way, as most do, became much more personal. Working with a group called Center for Race, Poverty and the Environment, we identified the fact that Hispanic students and other students of color are more likely to attend schools near active oil and gas wells than white students. This was also true for hydraulically fractured (stimulated) oil and gas wells. Now, no student should have to go to school near this type of activity, but California does not have minimum setback requirements for schools or any other sensitive sites.
Meeting and working with the families of the students – and the students themselves that attend schools in the midst of the oil and gas wastelands – drives me to continue working for a future free from the fossil-fuel industry. No child should have to go to school near oil and gas fields to get an education. And as is typically the case, non-white and Hispanic communities in California bear the heaviest burden.
Check back soon to read the analysis described above. It will be the focus of my next blog piece.
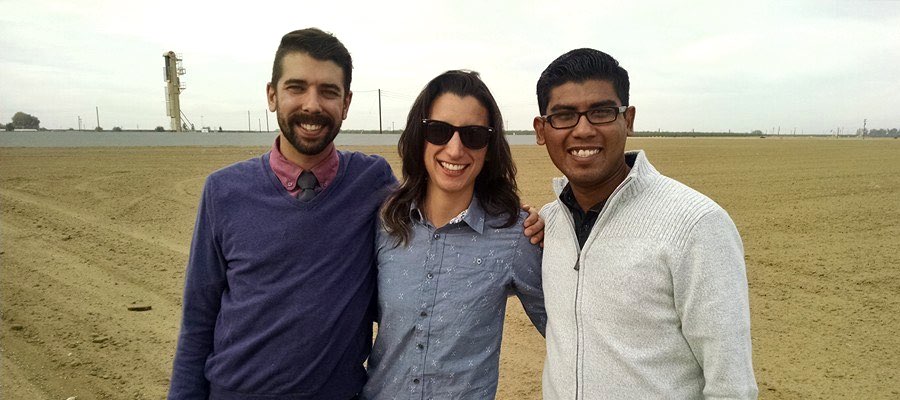
Feature Image: Kyle Ferrar (left) with colleagues from CRPE
CA Crude by Rail, from the Bakken Shale and Canada’s Tar Sands to California Refineries By Kyle Ferrar, Western Program Coordinator & Kirk Jalbert, Manager of Community Based Research & Engagement
Refineries in California plan to increase capacity and refine more Bakken Shale crude oil and Canadian tar sands bitumen. However, CA’s refinery communities that already bear a disparate amount of the burden (the refinery corridor along the north shore of the East Bay) will be more impacted than they were previously. New crude-by-rail terminals will put additional Californians at risk of accidents such as spills, derailments, and explosions. Additionally, air quality in refinery communities will be further degraded as refineries change to lower quality sources of crude oil. Below we discuss where the raw crude oil originates, why people are concerned about crude-by-rail projects, and what CA communities are doing to protect themselves. We also discuss our GIS analysis, showing the number of Californians living within the half-mile blast zones of the rail lines that currently are or will be supported by the new and existing crude by rail terminal projects.
Sources of Raw Crude Oil
Figure 1. Sources of crude oil feedstock refined in California over time (CA Energy Commission, 2015)
California’s once plentiful oil reserves of locally extracted crude are dwindling and nearing depletion. Since 1985, crude extraction in CA has dropped by half. Production from Alaska has dropped even more, from 2 million B/D (barrels per day) to around 500,000 B/D. The 1.9 million B/D refining capacity in CA is looking for new sources of fuels. Refineries continue to supplement crude feedstock with oil from other sources, and the majority has been coming from overseas, specifically Iraq and Saudi Arabia. This trend is shown in figure 1.
Predictions project that sources of raw crude oil are shifting to the energy intensive Bakken formation and Canadian Tar Sands. The Borealis Centre estimates an 800% increase of tar sands oil in CA refineries over the next 25 years (NRDC, 2015). The increase in raw material from these isolated locations means new routes are necessary to transport the crude to refineries. New pipelines and crude-by-rail facilities would be necessary, specifically in locations where there are not marine terminals such as the Central Valley and Central Coast of CA. The cheapest way for operators in the Canadian Tar Sands and North Dakota’s Bakken Shale to get their raw crude to CA’s refinery markets is by railroad (30% less than shipping by marine routes from ports in Oregon and Washington), but this process also presents several issues.
CA Crude by Rail
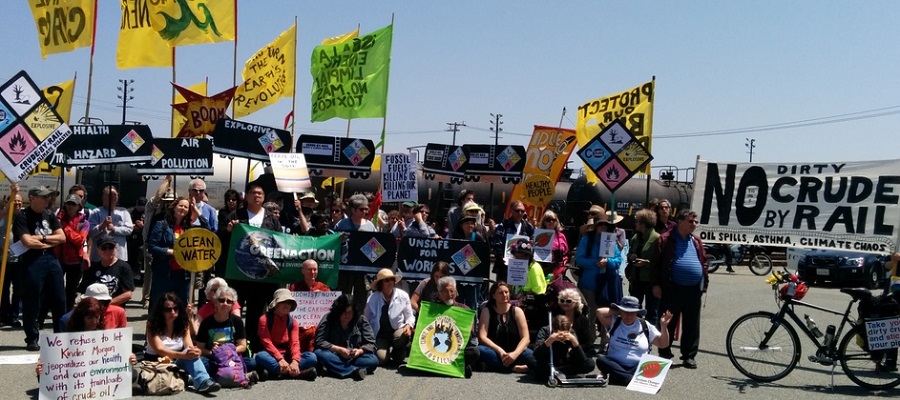
More than 1 million children — 250,000 in the East Bay — attend school within one mile of a current or proposed oil train line (CBD, 2015). Using this “oil train blast zone” map developed by ForestEthics (now called Stand) you can explore the various areas at risk in the US if there was an oil train explosion along a rail line. Unfortunately, there are environmental injustices that exist for communities living along the rail lines that would be transporting the crude according to another ForestEthics report.
The specific focus of the map in Figure 2 is the five proposed and eight existing crude-by-rail terminals that allow oil rail cars to unload at the refineries. The eight existing rail terminals have a combined capacity of 496,000 barrels. Combined, the 15 terminals would increase CA’s crude imports to over 1 million B/D by rail. The currently active terminals are shown with red markers. Proposed terminals are shown with orange markers, and inactive terminals with yellow markers. Much of the data on terminals was taken from the Oil Change International Crude by Rail Map, which covers the entire U.S.
The same type of facility is currently operating in the East Bay’s refinery corridor in Richmond, CA. The Kinder Morgan Richmond terminal was repurposed from handling ethanol to crude oil, but with no public notice. The terminal began operating without conducting an Environmental Impact Report (EIR) or public review of the permit. Unfortunately, this anti-transparent process was similar to a tactic used by another facility in Kern County. The relatively new (November 2014) terminal in Taft, CA operated by Plains All American Pipeline LLC also did not conduct an EIR, and the permit is being challenged on the grounds of not following the CA Environmental Quality Act (CEQA).
EIRs are an important component of the permitting process for any hydrocarbon-related facility. In April 2015 in Pittsburg, for example, a proposed 50,000 B/D terminal at the WesPac Midstream LLC’s railyard was abandoned due to community resistance and criticism over the EIR from the State Attorney General, along with the larger proposal of a 192,000 B/D marine terminal.
Crude-by-rail terminals bring with them not only the threat of derailments and the risk of other such accidents, but the terminals are also a source of air emissions. Terminals – both rail and marine – are major sources of PAH’s (polycyclic aromatic hydrocarbons). The Sacramento Valley Railroad (SAV) Patriot rail oil terminal at a business park on the former McClellan Air Force Base property actually had its operating permit withdrawn by Sacramento air quality regulators due to this issue (read more). The terminal was unloading and reloading oil tanker cars.
FracTracker’s recent report, Emissions in the Refinery Corridor, shows that the refineries in this region are the major point source for emissions of both cancer and non-cancer risk drivers in the region. These air pollution sources get worse, however. According to the report by NRDC, changing the source of crude feedstock to increased amounts of Canadian Tar Sands oil and Bakken Shale oil would:
… increase the levels of highly toxic fugitive emissions; heavy emissions of particulate, metals, and benzene; result in a higher risk of refinery accidents; and the accumulation of petroleum coke* (a coal-like, dusty byproduct of heavy oil refining linked to severe respiratory impacts). This possibility would exacerbate the harmful health effects faced by the thousands of low-income families that currently live around the edges of California’s refineries. These effects are likely to include harmful impacts to eyes, skin, and the nervous and respiratory systems. Read NRDC Report
The contribution to climate change from accessing the tar sands also needs to be considered. Extracting tar sands is estimated to release on average 17% average more green-house gas (GHG) emissions than conventional oil extraction operations in the U.S., according to the U.S. Department of State. (Greenhouse gases are gases that trap heat in the atmosphere, contributing to climate change on a global scale.) The refining process, too, has a larger environmental / public health footprint; refining the tar sands to produce gasoline or diesel generates an average of 81% more GHGs (U.S. Dept of State. Appendix W. 2015). In total this results in a much larger climate impact (NRDC, NextGen Climate, Forest Ethics. 2015).
Local Fights
People opposed to CA crude by rail have been fighting the railway terminal proposals on several fronts. In Benicia, Valero’s proposal for a rail terminal was denied by the city’s Planning Commission, and the project’s environmental impact report was denied, as well. The city of Benicia, however, hired lawyers to ensure that the railway projects are built. The legality of railway development is protected regardless of the impacts of what the rails may be used to ship. This legal principle is referred to as “preemption,” which means the federal permitting prevents state or local actions from trying to limit or block development. In this case, community and environmental advocacy groups such as Communities for a Better Environment, the Natural Resources Defense Council, and the Stanford-Mills Law Project all agree the “preemption” doctrine doesn’t apply here. They believe preemption does not disallow the city or other local governments from blocking land use permits for the refinery expansion and crude terminals that unload the train cars at the refinery. The Planning Commission’s decision is being appealed by Valero, and another meeting is scheduled for September, 2016.
The fight for local communities along the rail-lines is more complicated when the refinery is far way, under the jurisdiction of other municipalities. Such is the case for the Phillips 66 Santa Maria Refinery, located on California State Highway 1 on the Nipomo Mesa. The Santa Maria refinery is requesting land use permits to extend track to the Union Pacific Railway that transits CA’s central coast. The extension is necessary to bring the rail cars to the proposed rail terminal. This project would not just increase traffic within San Luis Obispo, but for the entirety of the rail line, which passes directly through the East Bay. The project would mean an 80-car train carrying 2 million gallons of Bakken Crude would travel through the East Bay from Richmond through Berekely and Emeryville to Jack London Square and then south through Oakland and the South Bay. This would occur 3 to 5 times per week. In San Luis Obispo county 88,377 people live within the half-mile blast zone of the railroad tracks.
In January, the San Luis Obispo County Planning Department proposed to deny Phillips 66 the permits necessary for the rail spur and terminals. This decision was not easy, as Phillips 66, a corporation ranked Number 7 on the Fortune 500 list, has fought the decision. The discussion remained open with many days of meetings, but the majority of the San Luis Obispo Planning Commission spoke in favor of the proposal at a meeting Monday, May 16. There is overwhelming opposition to the rail spur project coming from 250 miles away in Berkeley, CA. In 2014, the Berkeley and Richmond city councils voted to oppose all transport of crude oil through the East Bay. Without the rail spur approval, Phillips 66 declared the Santa Maria refinery would otherwise transport oil from Kern County via 100 trucks per day. Learn more about this project.
GIS Analysis
GIS techniques were used to estimate the number of Californians living in the half mile “at risk” blast zone in the communities hosting the crude-by-rail lines. First, we estimated the total population of Californians living a half mile from the BNSF and UP rail lines that could potentially transport crude trains. Next, we limited our study area to just the East Bay refinery corridor, which included Contra Costa and the city of Benicia in Solano County. Then, we estimated the number of Californians that would be living near rail lines if the Phillips 66 Santa Maria refinery crude by rail project is approved and becomes operational. The results are shown below:
Population living within a half mile of rail lines throughout all of California: 6,900,000
Population living within a half mile of rail lines in CA’s East Bay refinery communities: 198,000
Population living within a half mile of rail lines along the UP lines connecting Richmond, CA to the Phillips 66 Santa Maria refinery: 930,000
By Brook Lenker, Executive Director, FracTracker Alliance
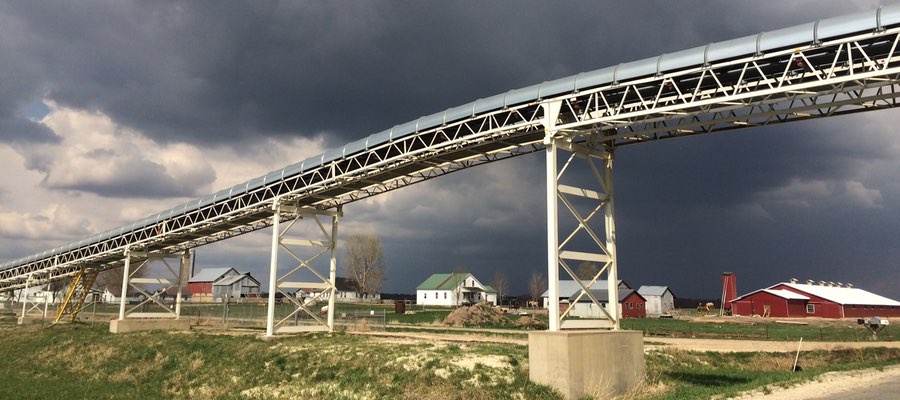
Frac sand mining is a growing threat to the agricultural landscapes of the upper Midwest and a health risk to those who live near the mines. With a general slowdown in the oil and gas industry, sand mining may seem a lessening concern in the universe of extraction impacts, but a recent visit to Wisconsin during Earth Week suggested otherwise.
Frac Sand Mining Presentations
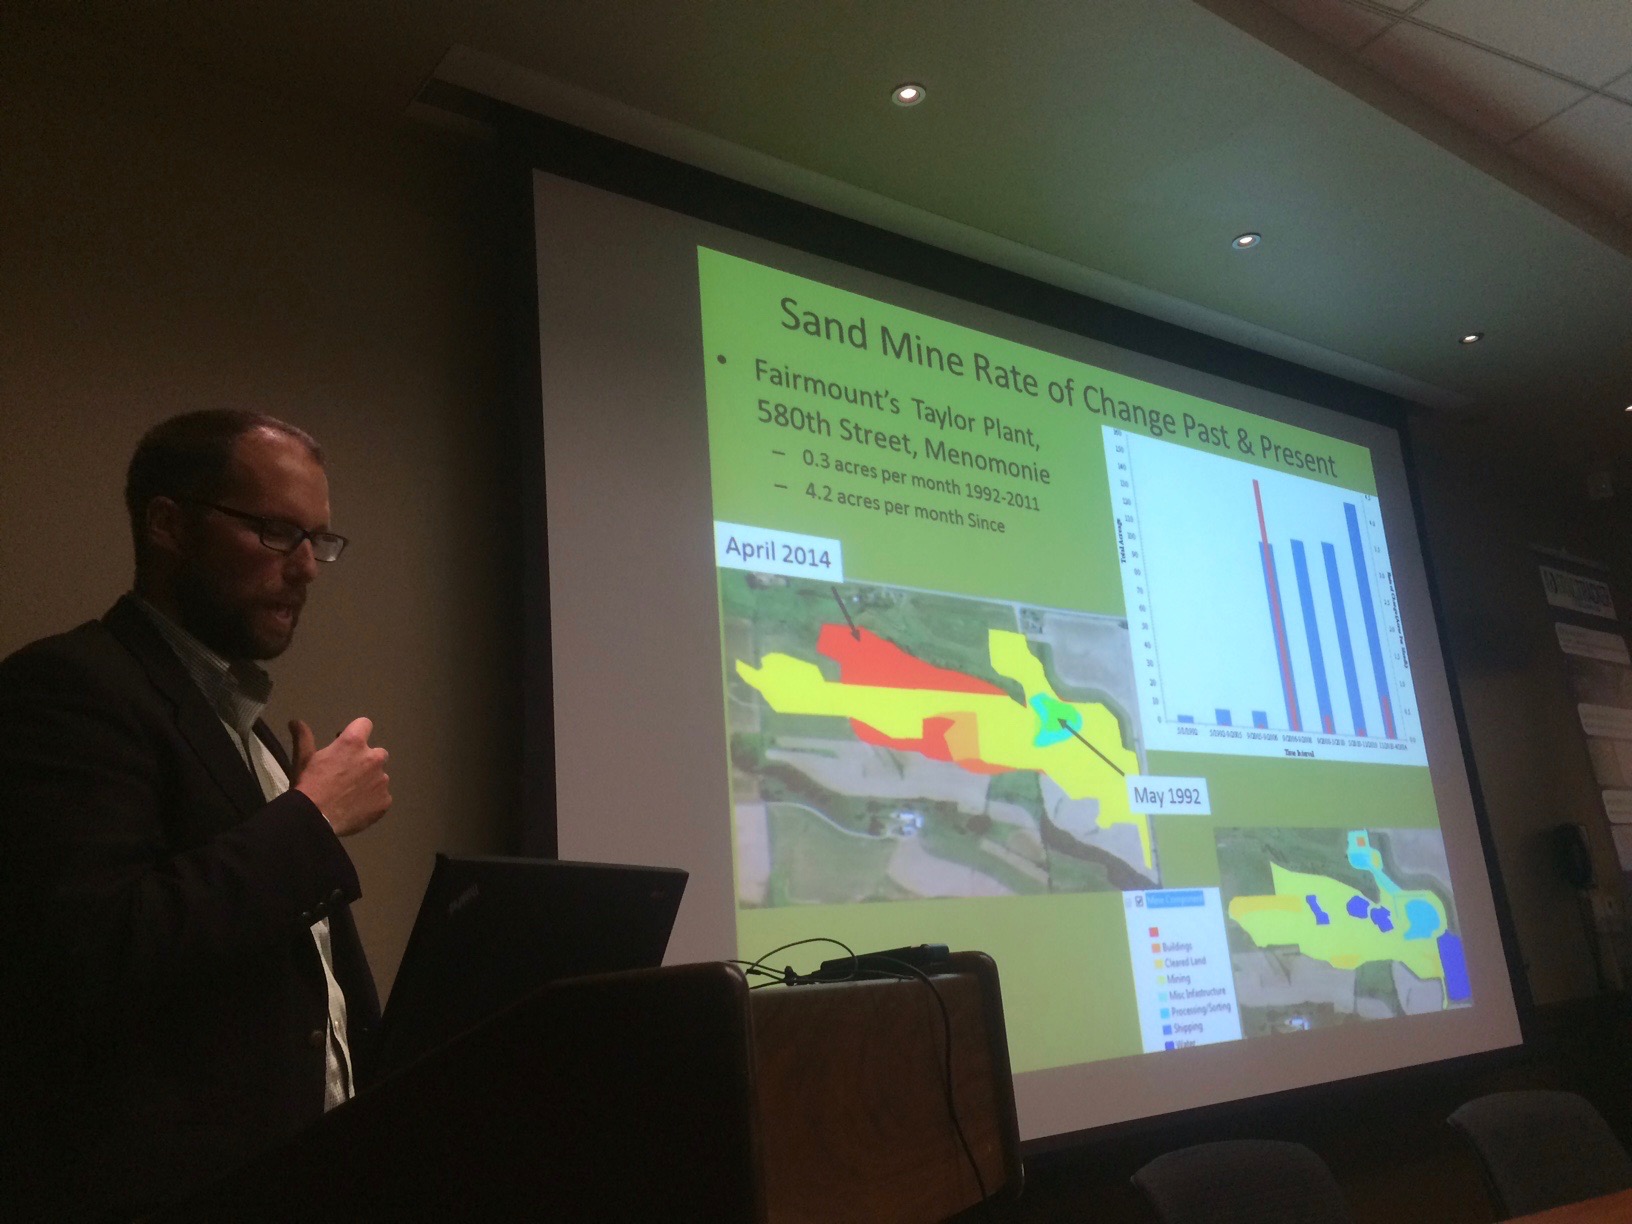
Dr. Auch presenting in Wisconsin on frac sand mining issues
I joined my colleague, Dr. Ted Auch, on an informative cross-state tour that started in Milwaukee. We were presenters at the Great Lakes Water Conservation Conference where representatives from breweries around the region and across the country came together to discuss their most precious commodity: clean and abundant water. Extraction affects both the quantity and quality of water – and our insights opened many eyes. Businesses like microbreweries with a focus on sustainability and a strong environmental ethic recognize the urgency and benefit of the renewable energy transformation.
From Milwaukee, we headed west to Madison and the University of Wisconsin where Caitlin Williamson of the Wisconsin Chapter of the Society for Conservation Biology organized the first of two forums entitled “Sifting the Future: The Ecological, Agricultural, and Health Effects of Frac Sand Mining in Wisconsin.” We were joined by Kimberlee Wright of Midwest Environmental Advocates to address an engaged audience of 35 people from the campus and greater community. Thanks to Wisconsin Eye, a public affairs network, the entire program was videotaped.
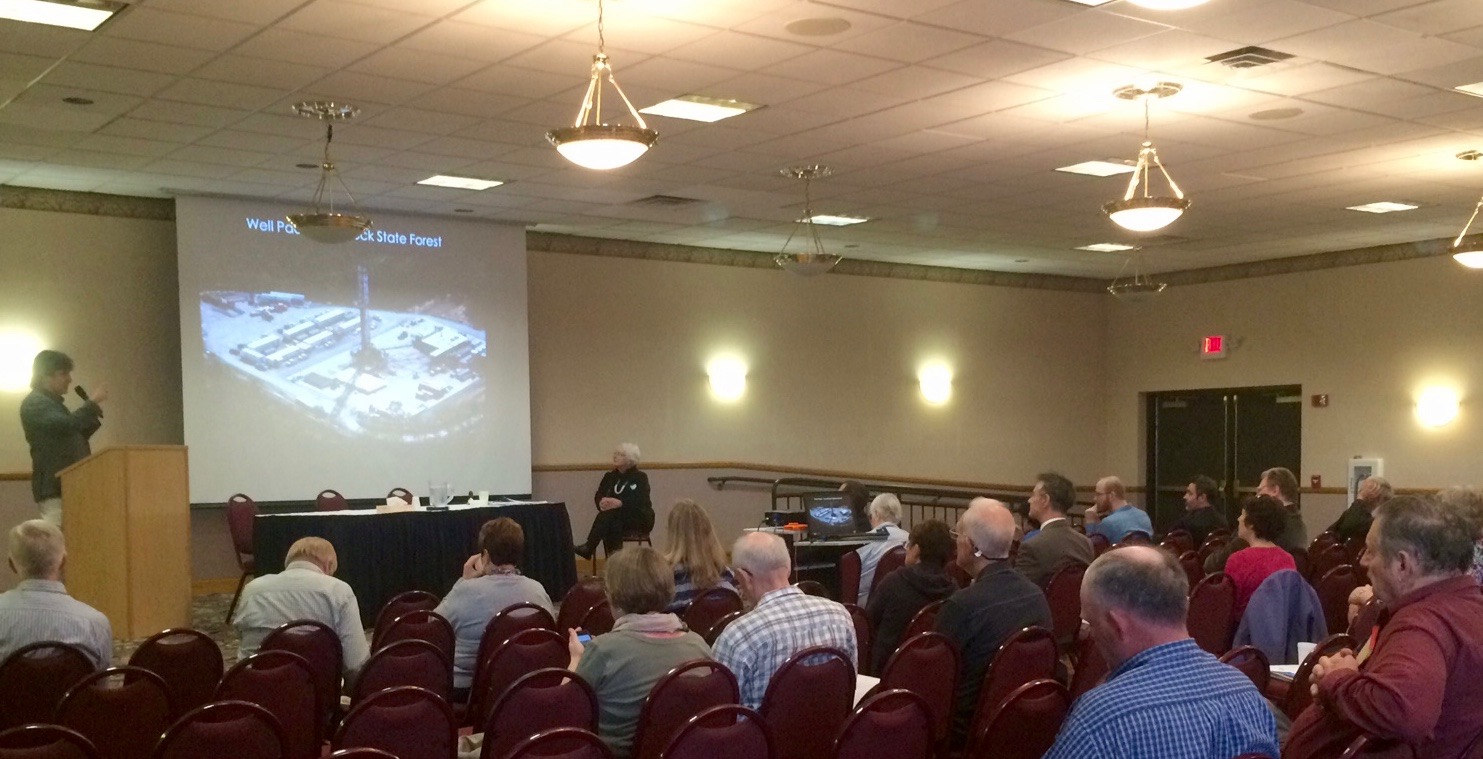
Brook Lenker presenting at Sifting the Future event in Wisconsin
A long drive to Eau Claire revealed rolling farmland, wooded hills, and prodigious wetlands home to waterfowl and the largest cranberry industry in the nation. At the Plaza Hotel, we met Cheryl Miller of the Save the Hills Alliance, the grantor enabling us to study the regional footprint of sand mining, and Pat Popple, advocate extraordinaire and our host for the second “Sifting the Future” event. The good folks at Public Lab were also in town to facilitate citizen monitoring of silica dust from the mining process, including a free workshop and training that weekend.
The evening program attracted 50 people from as far away as Iowa and Minnesota. Their interest in and knowledge of sand mining issues was impressive, and many were heavily involved in fighting local mines. Dr. Crispin Pierce spoke of his research about airborne particulates around frac sand operations, complementing both FracTracker presentations – mine emphasizing the broad array of environmental and public health perils related to oil and gas extraction and Ted’s examining the scale and scope of sand mining, demand for proppant, and the toll of the industry on agricultural productivity, forests and the carbon cycle.
Mining Photos
During the five day trip, sand mines were visited and documented, their incongruent and expanding presence marring the countryside. Some of them can be seen in this photo gallery:
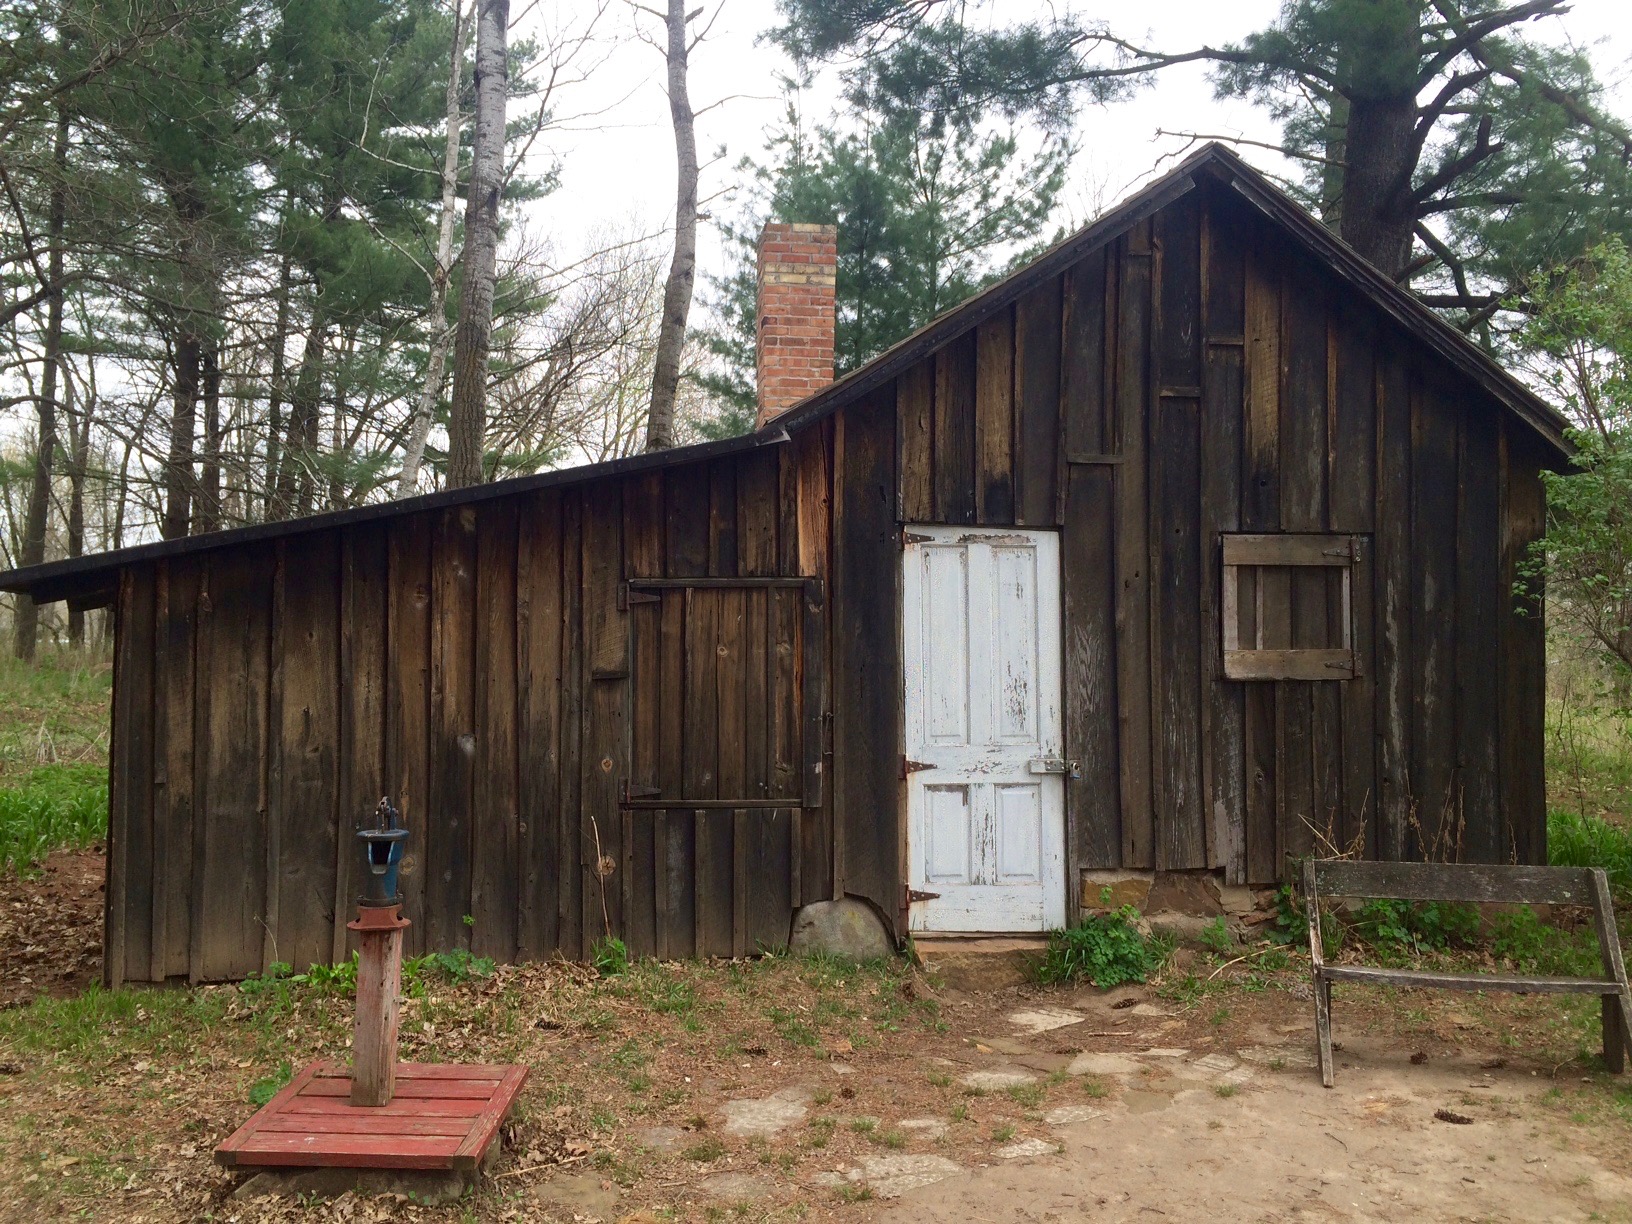
On Earth Day, while driving east to return to Milwaukee, Sandhill cranes, a timeless symbol of the Wisconsin wild, poked the rich prairie soils searching for food. Joined by Autumn Sabo, a botanist and researcher who assisted our Wisconsin work, we detoured to the nearby Aldo Leopold Center visiting the simple shack that inspired Mr. Leopold to write Sand County Almanac. Considering the reason for my travel, the irony was thick. Ecological consciousness has come a long way, but more evangelism is sorely needed.
Aldo Leopold Center, Wisconsin
https://www.fractracker.org/a5ej20sjfwe/wp-content/uploads/2016/05/WITour-Feature.jpg400900Guest Authorhttps://www.fractracker.org/a5ej20sjfwe/wp-content/uploads/2021/04/2021-FracTracker-logo-horizontal.pngGuest Author2016-05-05 15:36:252020-03-11 17:07:10Earth Week in Wisconsin
By Brook Lenker, Executive Director, FracTracker Alliance
The understanding of fracking’s harms has grown dramatically in the last decade, especially since FracTracker’s formation in 2010. Across the country and around the world, environmental and human health impacts of oil and gas development have been well documented. Every day brings new cause for concern.
During this same period, scientific and public awareness about the consequences and causation of climate change has accelerated and we watch with trepidation as profound changes grip our planet. Atmospheric carbon dioxide levels have eclipsed 400 ppm. Temperature records are repeatedly broken. Weather extremes have become routine.
These tragic realities aren’t acceptable. Nationally and internationally, hundreds – if not thousands – of organizations are working on these issues and speaking out for transparency, accountability, and progress. Progress means informed populations, responsible policies, and an aggressive shift to renewable energy while embracing efficiency. Great things are happening. The future demands boldness.
FracTracker has always been a data-driven resource for all – to educate, empower, and catalyze positive change. The Alliance in our name underscores that we are an ally with the multitudes in that quest, but the weight of the times requires us to revisit our mission statement (below) and sharpen our message to better convey what we do and why we do it. A new logo and tagline reinforce our pronouncement.
FracTracker Alliance studies, maps, and communicates the risks of oil and gas development to protect the planet and support the renewable energy transformation.
So, welcome to the freshened words and appearance of the FracTracker Alliance. We’re the same trusted organization but striving to be bolder, to make a bigger difference for us all. The future is now.
If you have questions about these organizational changes, please email us at info@fractracker.org, or call +1 202-630-6426.
https://www.fractracker.org/a5ej20sjfwe/wp-content/uploads/2016/05/NewLogo-Feature.png400900Guest Authorhttps://www.fractracker.org/a5ej20sjfwe/wp-content/uploads/2021/04/2021-FracTracker-logo-horizontal.pngGuest Author2016-05-02 13:18:192020-03-05 13:15:26Welcome to FracTracker Alliance 2.0