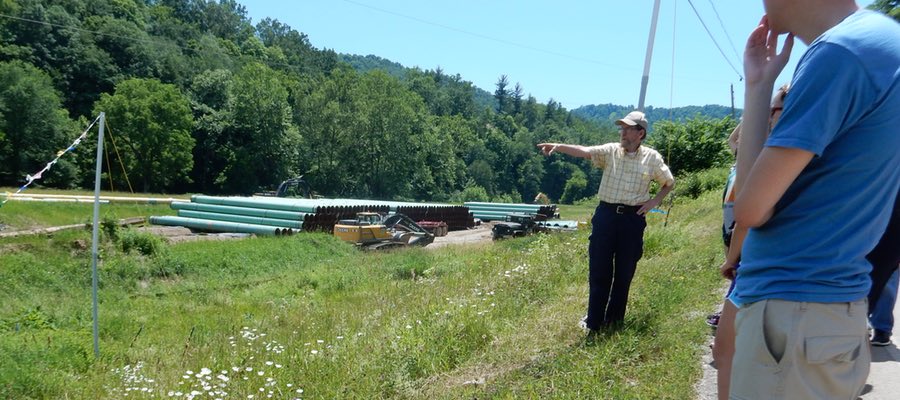
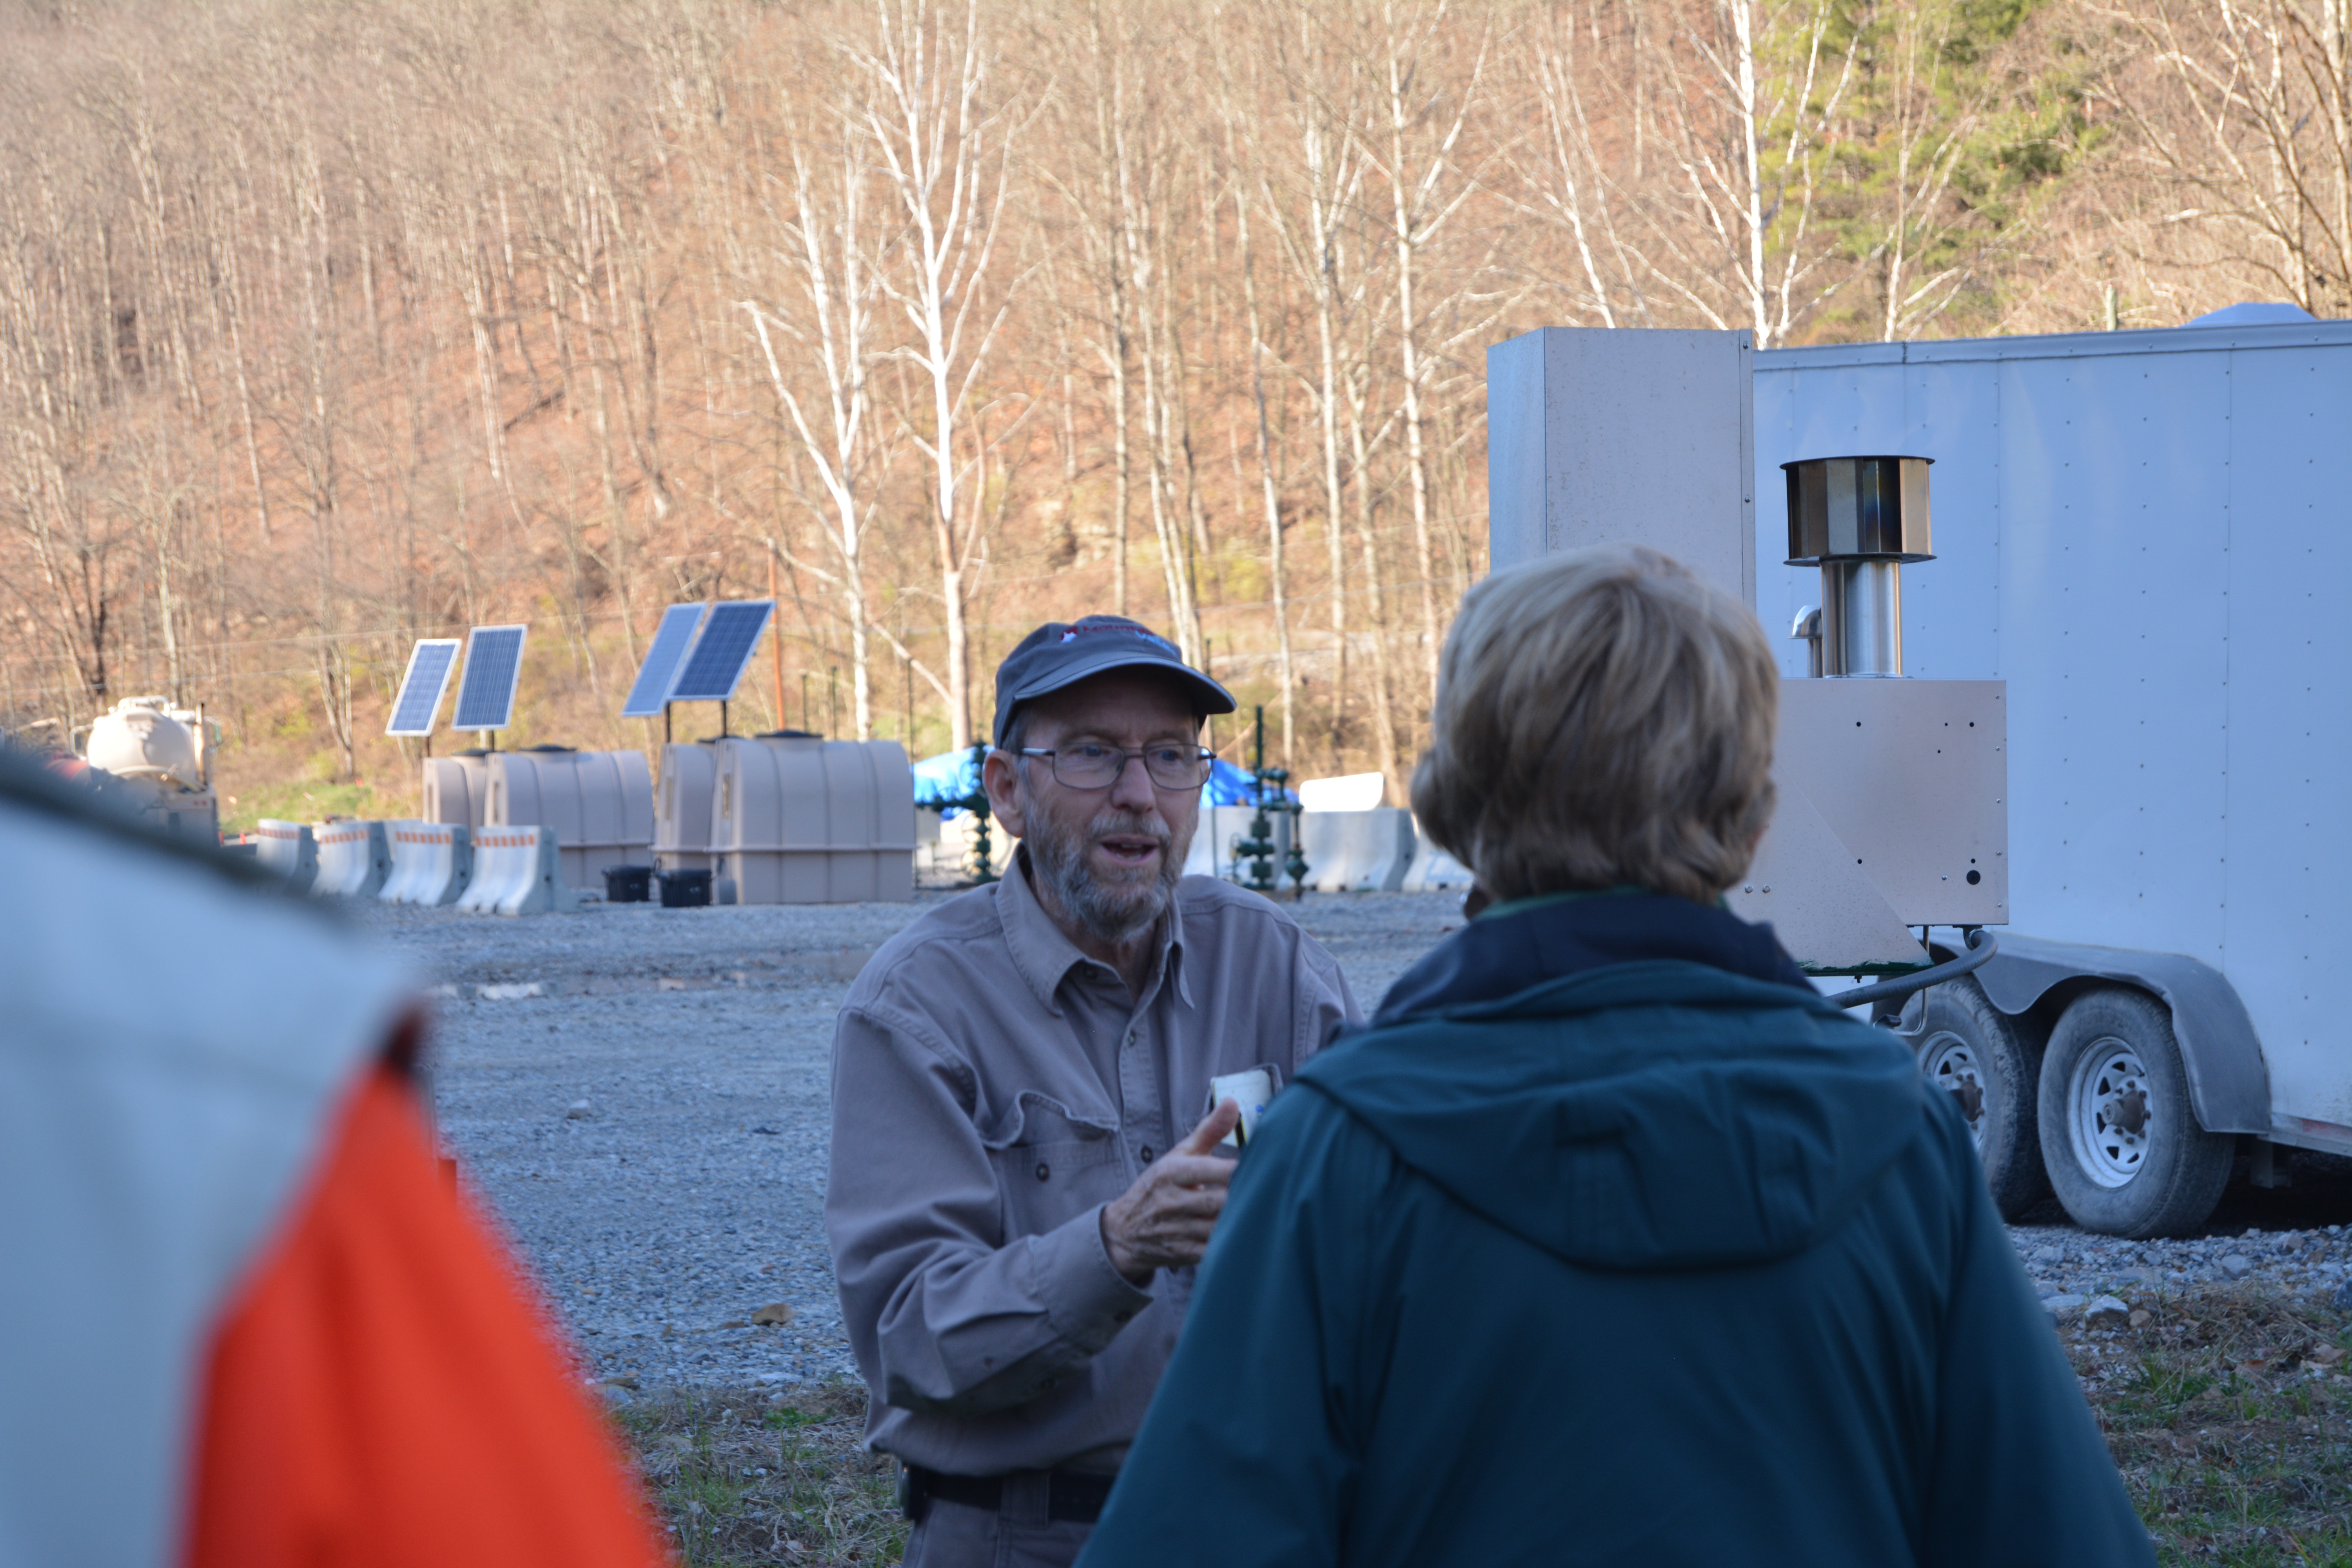
As many of you know, educating the public is a FracTracker Alliance core value – a passion, in fact. In addition to our maps and resources, we help to provide hands-on education, as well. The extraordinary Bill Hughes is a FracTracker partner who has spent decades “in the trenches” in West Virginia documenting fracking, well pad construction, water withdrawals, pipeline construction, accidents, spills, leaks, and various practices of the oil and gas industry. He regularly leads tours for college students, reporters, and other interested parties, showing them first-hand what these sites look, smell, and sound like.
While most of us have heard of fracking, few of us have seen it in action or how it has changed communities. The tours that Bill provides allow students and the like to experience in person what this kind of extraction means for the environment and for the residents who live near it.
Biking to Support FracTracker and Bill Hughes
Dave Weyant at the start of his cross-country Pedal for the Planet bike trip
In the classic spirit of non-profit organizations, we work in partnership with others whenever possible. Right now, as you read this posting, another extraordinary Friend of FracTracker, Dave Weyant (a high school teacher in San Mateo, CA), is finishing his cross-country cycling tour – from Virginia to Oregon in 70 days.
Dave believes strongly in the power of teaching to reach the hearts of students and shape their thinking about complicated issues. As such, he has dedicated his journey to raising money for FracTracker. He set up a GoFundMe campaign in conjunction with his epic adventure, and he will donate whatever he raises toward Bill’s educational tours.
Help us celebrate Dave Weyant’s courage, vision, and generosity – and support Bill Hughes’s tireless efforts to open eyes, evoke awareness, and foster communication about fracking – by visiting Dave’s GoFundMe page and making a donation. Every gift of any size is most welcome and deeply appreciated.
100% of the funds raised from this campaign will go to support Bill’s oil and gas tours in West Virginia. FracTracker Alliance is a registered 501(c)3 organization. Your contribution is tax deductible.
And to those of you who have already donated, thank you very much for your support!
https://www.fractracker.org/a5ej20sjfwe/wp-content/uploads/2016/07/Hughes-Tour-Feature.jpg400900Guest Authorhttps://www.fractracker.org/a5ej20sjfwe/wp-content/uploads/2021/04/2021-FracTracker-logo-horizontal.pngGuest Author2016-07-27 10:30:012020-03-11 16:48:40A Cross-Country Ride to Support Oil and Gas Tours in West Virginia
Over 38,000 oil and gas wells have likely been hydraulically fractured in California. The last permitted hydraulic fracturing operation in CA was approved in June 2015. Additionally, new aquifer exemption proposals will make it easier for operators to obtain hydraulic fracturing permits. One of the most interesting and troubling issues we found when analyzing the data on violations is that operators with the highest number of new well permits are also responsible for the majority of violations. In this article, we provide a look at these and other the trends of unconventional drilling in CA.
Updated CA Shale Viewer
First of all, the CA Shale Viewer has been updated! New data has been uploaded into the map about unconventional drilling in California, and new data resources have been used to identify shale gas activity (Fig. 1). Recent reports in CA have exposed what many researchers expected – hydraulic fracturing has been occurring in the state without any oversight or documentation for a long time.
In this presentation of the Updated CA Shale Viewer we showcase an analysis of these new data sources that better describe unconventional drilling in CA. We then look to new well permitting data to see what current spatial trends may mean for future oil and gas development. We also look at a sample of operator violations issued by the state regulatory agency to tell us a bit about who the bad actors may be.
Figure 1. CA Shale Viewer – Location of well stimulation & other unconventional oil & gas activity
Fracking in California has been put on hold at the moment as a result of low oil prices combined with the new permitting requirements for groundwater monitoring. In 2015, the CA Council on Science and Technology (CCST) released a report on hydraulic fracturing, as required by State Bill 4, proposed by Senator Pavley. The legislation required the Division of Oil, Gas and Geothermal Resources to create regulations for hydraulic fracturing and other stimulation activities such as acidizing. The report highlighted the necessity of protecting California’s groundwater resources. As another requirement of SB4, the state water resources control board adopted Model Criteria for Groundwater Monitoring in areas of Oil and Gas Well Stimulation, which includes three main components:
Area-specific required groundwater monitoring near stimulation wells by operators
Requirements for designated contractor sampling and testing
Regional scale groundwater monitoring to be implemented by the State Water Board
With these requirements in place to protect groundwater, using hydraulic fracturing and other “extreme” high energy input techniques to extract oil is not currently economical in California. Operators have not submitted a permit application for hydraulic fracturing in CA since June 2015.
This status may change in the near future, though, as DOGGR has proposed groundwater monitoring exemptions for 3 large aquifer systems in Kern and Arroyo Grande counties. Such a proposal would mean that operators would not have to monitor for groundwater contamination in these areas when using hydraulic fracturing or other stimulation technologies like acidizing.
Previous Fracking Activity
One outcome of the aforementioned CCST report on hydraulic fracturing was a review of stimulation activity that has occurred in CA but went undocumented. Researchers at Lawrence Berkeley National Laboratory (LBNL) screened thousands of oil and gas well logs and records to calculate the extent to which hydraulic fracturing was actually being used in California’s oil fields. LBNL derived “Well Stimulation Treatment” probabilities based on the number of well records that reported utilizing hydraulic fracturing.
Probabilities were then derived for each pool, which is a geographically isolated formation within an oil field. Using these probabilities, FracTracker calculated a conservative estimate for the number of stimulated wells in the state at over 38,000. There are 228,010 unique Well ID’s listed in the DOGGR database. This puts the proportion of hydraulically fractured wells in California at 16.7% of the total 228,090 wells known.
New Wells
Whereas many other states break down their oil and gas data to show in what phase of development a well may be, CA identifies all wells between the permitted and producing/injecting phase as “new.” In Figure 2 below you can see the wells identified in 2016 as “new.” The DOGGR dataset shows there are currently 6,561 new wells in California as of July 2016. Counts of new well permits were calculated for individual operators and are listed below in Table 1.
Table 1. Top 10 operators according to new well permit counts in California, along with the number of new well permits currently active, the percent those permits represent of total new well permits in the state, and the percentage of violations the operator is responsible in the DOGGR dataset provided to FracTracker Alliance.
Order
Operator
Permit Count
Permit %
Violations %
1
Aera Energy LLC
2012
30.67%
22.34%
2
Chevron U.S.A. Inc.
968
14.75%
20.35%
3
California Resources Production Corporation
768
11.70%
5.89%
4
Linn Operating, Inc.
574
8.75%
12.04%
5
E & B Natural Resources Management Corporation
572
8.71%
1%
6
California Resources Elk Hills, LLC
374
5.70%
5.52%
7
Seneca Resources Corporation
185
2.82%
2.83%
8
Freeport-McMoRan Oil & Gas LLC
164
2.50%
15.22%
9
Vaquero Energy, Inc.
154
2.35%
0.22%
10
Macpherson Oil Company
116
1.77%
2.09%
There are 68 fields in CA that have added new wells in the new DOGGR dataset published in July 2016. The top 10 fields are listed in Table 2 below.
Table 2. Top 10 Oil Fields by Permit (New Well) Count
Order
Oil Field
Well Count
1
Belridge, South
1518
2
Midway-Sunset
903
3
Poso Creek
553
4
Lost Hills
488
5
Cymric
336
6
Kern River
294
7
Elk Hills
276
8
Kern Front
233
9
McKittrick
186
10
Belridge, North
174
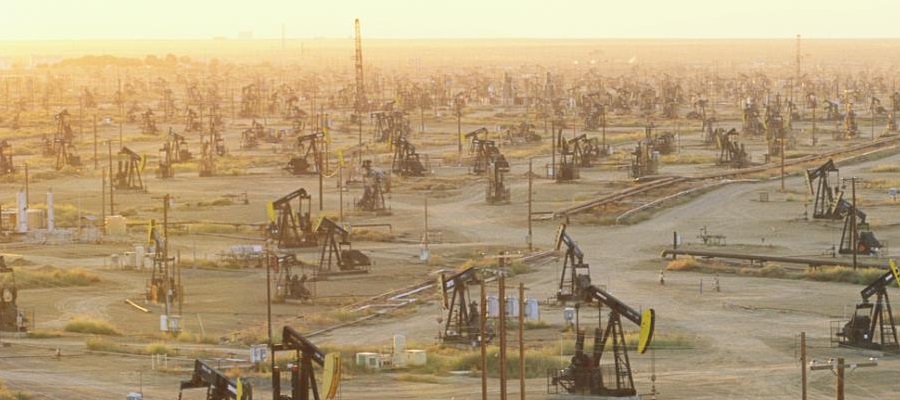
In Figure 2 below, the counts of new wells in fields are shown in shades of yellow/red. The fields with the highest number of new wells are located in the Central Valley. The top 10 operators’ wells are also identified. The majority of new well permits are located in the South Belridge oil field, and the majority of those wells are operated by Aera Energy. As can be seen in the map, most new wells are located in fields in Kern county, but Santa Barbara and Fresno, and even Salinas counties have fields with 40 or more new well permits.
Figure 2. New Well Permitting Map of Unconventional Drilling in California
In most states with heavy oil and gas drilling, data on violations is collected by the state regulatory agency, aggregated in datasets and spreadsheets, and made available to the public. FracTracker has done analyses with such data in the past.
In Pennsylvania for instance, a 2011 look at the data showed us that as the number of inspectors on the ground in the Marcellus Shale fields increases, the number of violations/well actually decrease. This was important information that challenged the cynical hypothesis: that more inspectors mean additional eyes on the ground to identify more violations during inspections. In reality, more inspectors actually mean that operators are held to higher standards, and further best management practices (BMPs) are employed. This trend at least seemed to be the case in Pennsylvania. As a regulatory agency, such knowledge is incredibly important, and even validates increased spending and budgets for more personnel.
In California, the issue of publishing violations data is again met with a similar response from the Division of Oil Gas and Geothermal Resources (DOGGR), specifically the “Oh, is that my job?” question.
How is it shared?
At FracTracker, we spent time working with regulatory officials at DOGGR to get some data on violations. We were informed that at some point in the future, the data may be aggregated and available digitally. Until then, however, a request for the data would have to be made to each of the six district offices individually and would take approximately a year to pull together scanned copies of violations notices in PDF format. Unfortunately, we at FracTracker do not have the capacity to process such files. Instead we asked for anything DOGGR had digitally available, and we were provided with a sample subset of 2,825 violations dating mostly from 2013 and 2014 and only in District 2, the Los Angeles Basin.
What does CA violations data look like?
Looking at the sample of data in Table 2, we see that the majority of violations are caused by the operators that also have the most new well permits. Aera Energy, in particular, is responsible for over 1/5 of all violations in our sample set. Limiting factors and sampling bias of the sample set of violations may impact this analysis, though, as all violations are limited to Los Angeles County. Operators that mostly operate in the Central Valley will be under represented in the violations count. When more violations data becomes available we will be sure to expand this analysis.
Bans and Regulations on Unconventional Drilling in California
Although every state regulatory agency lambasts that they have the most comprehensive and conservative set of oil and gas extraction regulations, California regulators may actually be right. That is, save for New York which has banned hydraulic fracturing outright.
As the price of oil rebounds closer to $100/barrel, there will be more interest by operators to increase unconventional drilling in California. The addition of new aquifer exemptions will make it all the more appealing. These local movements are therefore incredibly important to ensure that “extreme” extraction methods like fracking don’t expand in the future.
Feature Photo: South Belridge field by Sarah Leen, National Geographic
https://www.fractracker.org/a5ej20sjfwe/wp-content/uploads/2016/07/southbelridge_NatGeo_re.jpg400900Kyle Ferrar, MPHhttps://www.fractracker.org/a5ej20sjfwe/wp-content/uploads/2021/04/2021-FracTracker-logo-horizontal.pngKyle Ferrar, MPH2016-07-26 04:35:192020-03-12 17:18:14Trends in California’s Oil and Gas Development
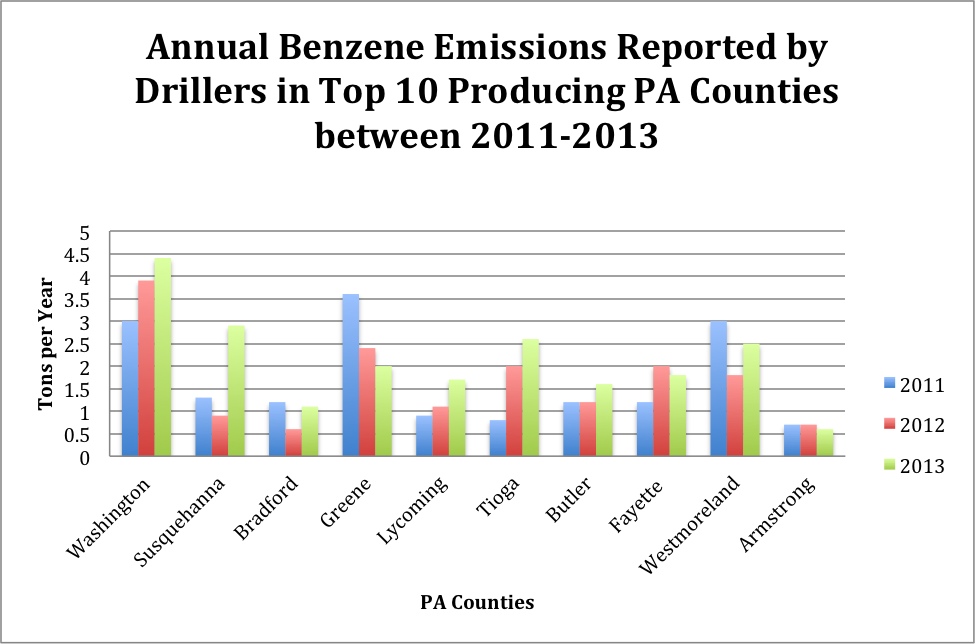
From 2011-2013, the PA Department of Environmental Protection (DEP) required air emission data to be conducted and reported by oil and gas drillers in Pennsylvania. We have tried to look at this data in aggregate to give you a sense of the types and quantities of different pollutants. Corresponding to their degree of oil and gas drilling activity, Washington, Susquehanna, Bradford, Greene, and Lycoming counties are the highest emitters of overall pollutants between the specified years. Despite the department’s attempt to increase transparency, the data submitted by the operators severely underestimates the actual amount of pollutants released, especially with regard to methane emissions. Furthermore, gaps such as inconsistent monitoring systems, missing data, and a lack of a verification process of the self-reported data weaken the integrity and reliability of the submitted data. This article explores the data submitted and its implications in further detail.
Why Emissions Are Reported
The U.S. Energy Information Administration (EIA) estimates that U.S. natural gas production will increase from 23 trillion cubic feet in 2011 to over 33 trillion cubic feet in 2040.Pennsylvania, in particular, is one of the states with the highest amount of drilling activity at present. This statistic can be attributed to resource-rich geologic formations such as the Marcellus Shale, which extends throughout much of Appalachia. While New York has banned drilling using high-volume hydraulic fracturing (fracking), Pennsylvania continues to expand its operations with 9,775 active unconventional wells as of June 10, 2016.
Between 2000-2016, drillers in Pennsylvania incurred 5,773 violations and $47.2 million in fines. The PA DEP, which oversees drilling permits and citations, has undergone criticism for their lack of action with complaints related to oil and gas drilling, as well aspoor communication to the public*. In order to increase transparency and to monitor air emissions from wells, the DEP now requires unconventional natural gas operators to submit air emission data each year. The data submitted by operators are intended to be publicly accessible and downloadable by county, emission, or well operator.
* Interestingly, PA scored the highest when we rated states on a variety of data transparency metrics in a study published in 2015.
Importance of Data Collected
PA’s continual growth in oil and gas drilling activity is concerning for the environment and public health. Pollutants such as methane, carbon dioxide (CO2), and nitrous oxides (NOx) are all major contributors to climate change, and these are among the more common emissions found near oil and gas activities. Long-term exposure to benzene, also commonly associated with drilling sites, can result in harmful effects on the bone marrow and the decrease in red blood cells. Vomiting, convulsions, dizziness, and even death can occur within minutes to several hours with high levels of benzene.
With such risks, it is crucial for residents to understand how many wells are within their vicinity, and the levels of these pollutants emitted.
Air Monitoring Data Findings & Gaps
Although the DEP collects emission data on other important pollutants such as sulfur oxides (SOx), particulate matter (PM10 and PM2.5), and toluene, this article focuses only on a few select pollutants that have shown the highest emission levels from natural gas activity. The following graphs illustrate emissions of methane, carbon dioxide (CO2), carbon monoxide (CO), nitrogen oxides (NOx), benzene, and volatile organic compounds (VOCs) for the top 10 counties with the highest amounts of natural gas activity. PA wells drilled data (often called SPUD data) will also be referenced throughout the article. Data source: PA SPUD Data.
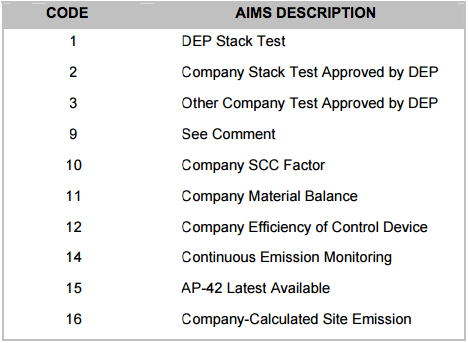
PA DEP’s Calculation Methods Codes for Emissions
Well operators self-report an estimate of total emissions in tons per year through either an online or paper reporting system. They must also indicate the method they used to generate this estimate with the Calculation Methods Codes for Emissions (table shown right).
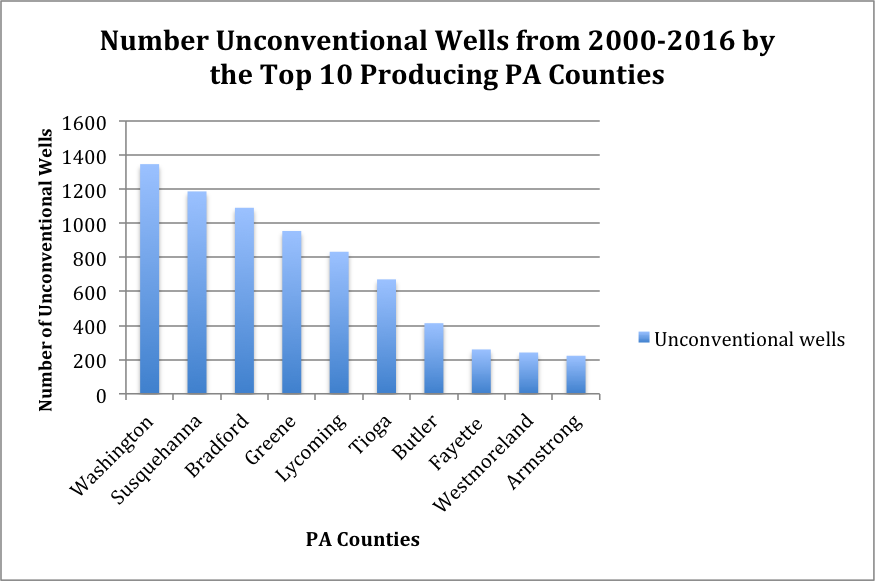
Overall, Washington, Susquehanna, Bradford, Greene, and Lycoming counties were the main emitters of all selected pollutants (methane, CO2, CO, NOx, VOCs, and benzene) throughout Pennsylvania based on tons per year (Fig 1). This trend may be correlated to the amount of natural gas activity that exists within each state as shown in the graph above. Thetop three Pennsylvania counties with the highest amount of oil and gas activity since 2000 are Washington, Susquehanna, and Bradford with 1,347; 1,187; and 1,091 unconventional active wells, respectively.
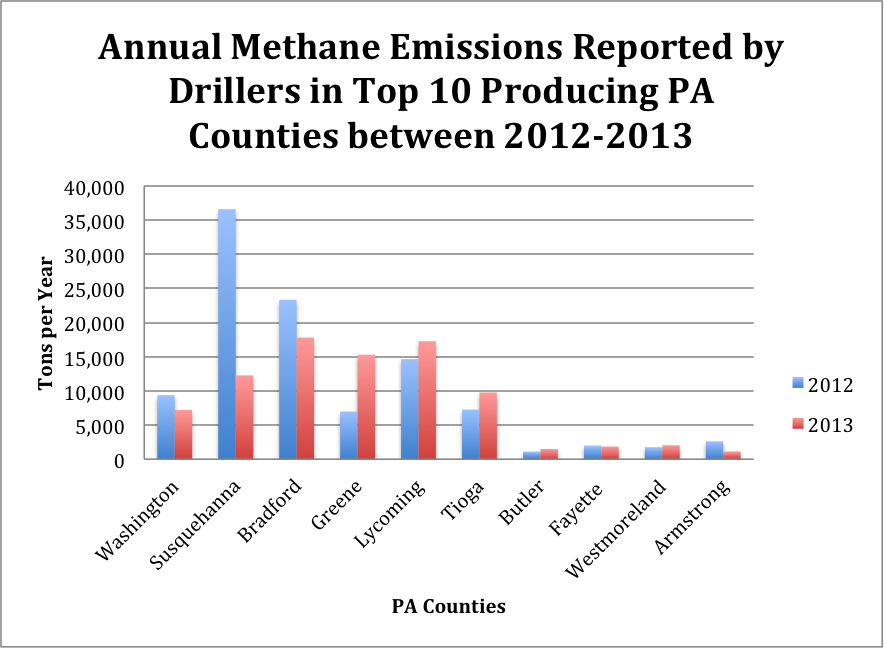
Methane Emissions
Figure 2
In 2012, Susquehanna, Bradford, and Lycoming counties reported the highest amount of methane released with levels at 36,607, 23,350, and 14,648 tons, respectively (Fig 2). In 2013, Bradford, Lycoming, and Greene counties reported the highest amount of methane released with levels at 17,805, 17,265, and 15,296 tons, respectively.
Although the overall trend of methane emission declines from 2012 to 2013, there is an unusual drop in Susquehanna County’s methane emissions from 2012 to 2013. Susquehanna’s levels went from 36,607 tons to 12,269 tons in that timeframe. However, the DEP SPUD data recorded an increase of 190 active wells to 214 active wells from 2012 to 2013 in that same county. Though the well operators did not provide details for this shift, possible reasons may be because of improved methods of preventing methane leaks over the year, well equipment may be less robust as it once was, operators may have had less of a reason to monitor for leaky wells, or operators themselves could have changed.
Lackawanna and Luzerne counties reported zero tons of methane released during the year of 2012 (not shown on graph). There are two possible reasons for this: both counties did not have any unconventional wells recorded in the 2012 SPUD data, which may explain why the two counties reported zero tons for methane emissions, or the levels submitted are a significant underestimation of the actual methane level in the counties. (While there were no new wells, there are existing wells in production in those counties.)
Considering that methane is the primary component of natural gas activity, the non-existent level of methane reported seem highly implausible even with inactive wells on site. Typically, an old or inactive gas well can either be abandoned, orphaned, or plugged. By definition, abandoned wells have been inactive for more than a year, and orphaned wells were abandoned prior to 1985. (Because of this distinction, however, no unconventional wells can be considered “orphaned.”) To plug a well, cement plugs are used to cover up wellbores in order to cease all flow of gas. The act of physically plugging up the wells paints an illusion that it is no longer functioning and has ceased all emissions.
Because of this flawed impression, systematic monitoring of air emissions is often not conducted and the wells are often ignored. Several studies have shown even abandoned and plugged wells are still spewing out small and at times large quantities of methane and CO2. One study published in 2014 in particular measured 19 abandoned wells throughout Pennsylvania, and concluded that abandoned wells were significant contributors to methane emissions – contributing 4-7% of total anthropogenic (man-made) methane emissions in PA.
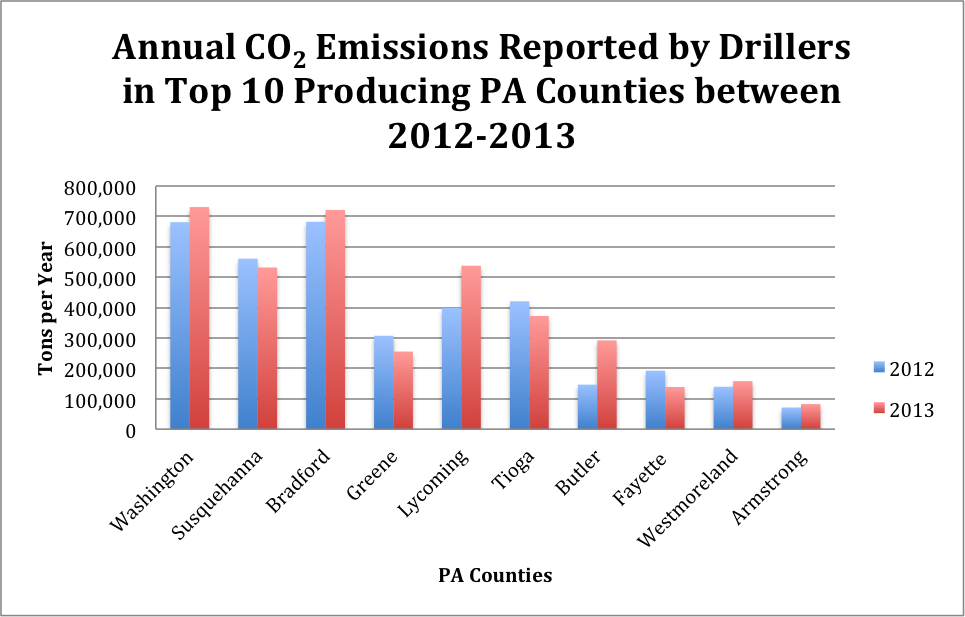
In 2012, Bradford County reported 682,302 tons of CO2 emitted; Washington County reported 680,979 tons; and Susquehanna reported 560,881 tons (Fig. 3). In 2013, Washington continued to lead with 730,674 tons, Bradford at 721,274 tons, and Lycoming with 537,585 tons of CO2 emitted.
What’s intriguing is according to SPUD data, Armstrong, Westmoreland, and Fayette also had considerable natural gas activity between the two years as shown on the map. Yet, their levels of CO2 emission are significantly lower compared to Lycoming or Susquehanna Counties. Greene County, in particular, had lower levels of CO2 reported. Yet, they had 106 active wells in 2012 and 117 in 2013. What is even more unusual is that Bradford County had 9 more wells than Greene County in 2013, yet, Greene County still had significantly higher CO2 levels reported.
Reasons for this difference may be that Greene County lacked the staff or resources to accurately monitor for CO2, the county may have forgotten to record emissions from compressor stations or other fugitive emission sources, or the method of monitoring may have differed between counties. Whatever the reason is, it is evident that the levels reported by Greene County may not actually be an accurate depiction of the true level of CO2 emitted.
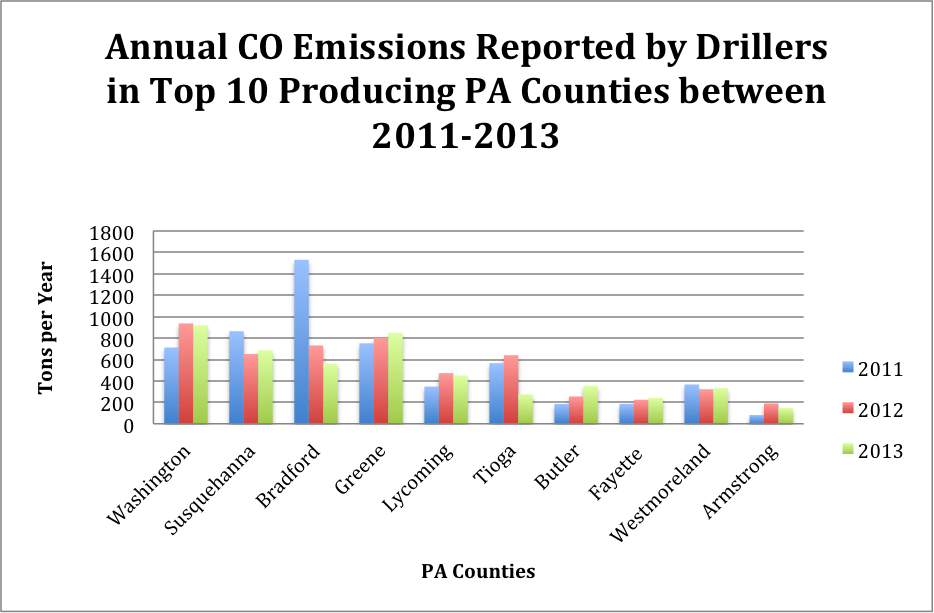
Spudded wells in PA with reported CO emissions by county 2011-13
Figure 4
According to the PA SPUD data, the number of new wells drilled in Bradford County dropped from 389 in 2011 to 163 in 2012 to 108 to 2013. The diminishing number of newly drilled wells in this particular county may explain the noticeable outlier in CO emission as seen on the graph (Fig 4).
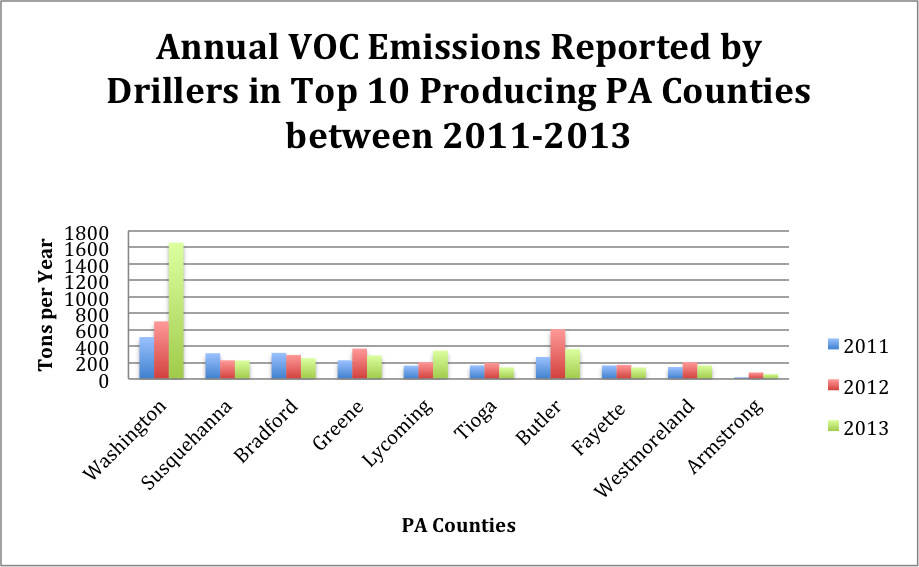
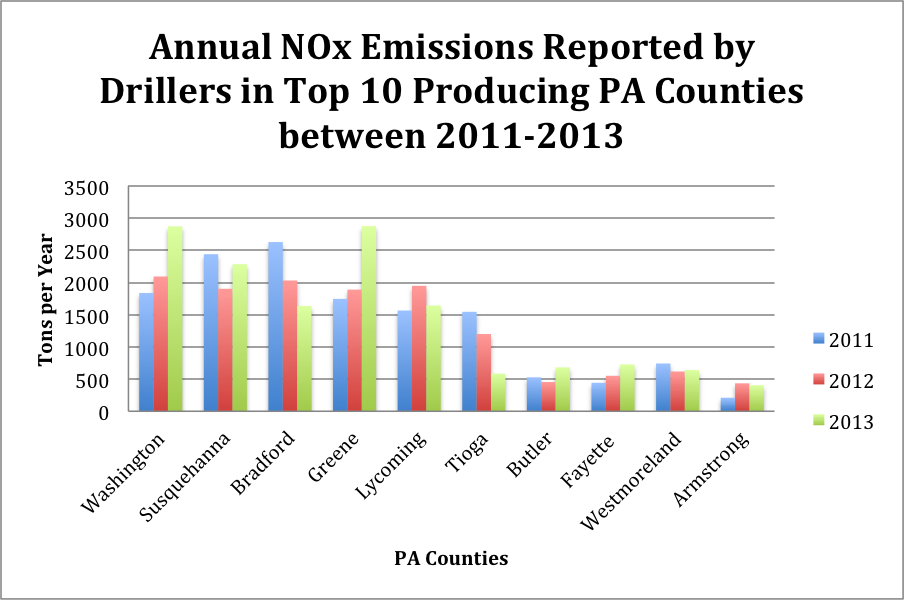
Compressor stations are also known to emit VOC, NOx, and various greenhouse gases; they run 24/7 and serve multiple wells. Compressor stations are necessary to move the natural gas along the pipelines, and thus, may still be required to function even after some wells have ceased operation. Furthermore, there can be multiple compressor stations in a region because they are installed at intervals of about 40 to 100 miles. This suggests that in addition to drilled wells, compressor stations provide additional avenues for NOx or VOC to leak into the air.
Spudded wells in PA with reported benzene emissions by county 2011-13
Figure 7
The levels of benzene emitted varied the most when compared to the other pollutants presented previously. Generally, the high levels of methane, CO2, and NOx emitted correlate with the high amount of natural gas activity recorded for each county’s number of drilled unconventional wells. However, it is interesting that both Westmoreland and Fayette counties had fewer active wells than Bradford County, yet, still reported higher levels of benzene (Fig 1, Fig 7).
An explanation for this may be the different monitoring techniques, the equipment used on each site which may vary by contractor or well access, or that there are other external sources of benzene captured in the monitoring process.
Although the collection and monitoring of air emission from wells is a step in the right direction, the data itself reveals several gaps that render the information questionable.
The DEP did not require operators to report methane, carbon dioxide, and nitrous oxide in 2011. Considering that all three components are potent greenhouse gases and that methane is the primary component in natural gas production, the data could have been more reliable and robust if the amount of the highest pollutants were provided from the start.
Systematic air monitoring around abandoned, orphaned, and plugged wells should still be conducted and data reported because of their significant impact to air quality. The DEP estimates there are approximately 200,000 wells that have been abandoned and unaccounted for. This figure includes older, abandoned wells that had outdated methods of plugging, such as wood plugs, wood well casings, or no plug at all. Without a consistent monitoring system for fugitive air emissions, the public’s true risk of the exposure to air pollutants will remain ambiguous.
All emissions submitted to the DEP are self-reported data from the operators. The DEP lacks a proper verification process to confirm whether the submitted data from operators are accurate.
The finalized data for 2014 has yet to be released despite the DEP’s April 2016 deadline. The DEP inadvertently posted the reports in March 2016, but quickly removed them without any notification or explanation as to why this information was removed. When we inquired about the release date, a DEP representative stated the data should be uploaded within the next couple of weeks. We will provide updates to this post when that data is posted but the DEP.
Overall, PA DEP’s valiant attempt to collect air data from operators and to increase transparency is constrained by the inconsistency and inaccuracy of the dataset. The gaps in the data strongly suggest that the department’s collection process and/or the industry’s reporting protocol still require major improvements in order to better monitor and communicate this information to the public.
August 23, 2016 Update
The 2014 air emissions data are now available on PA DEP’s website.
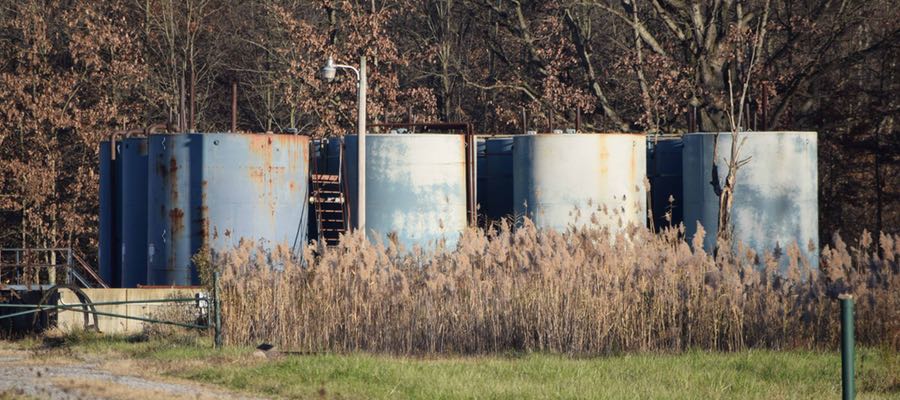
https://www.fractracker.org/a5ej20sjfwe/wp-content/uploads/2016/07/Air-Wellpad-Feature.jpg400900FracTracker Alliancehttps://www.fractracker.org/a5ej20sjfwe/wp-content/uploads/2021/04/2021-FracTracker-logo-horizontal.pngFracTracker Alliance2016-07-25 14:20:552020-03-12 17:18:42A Review of Oil and Gas Emissions Data in Pennsylvania
By Ted Auch, PhD – Great Lakes Program Coordinator
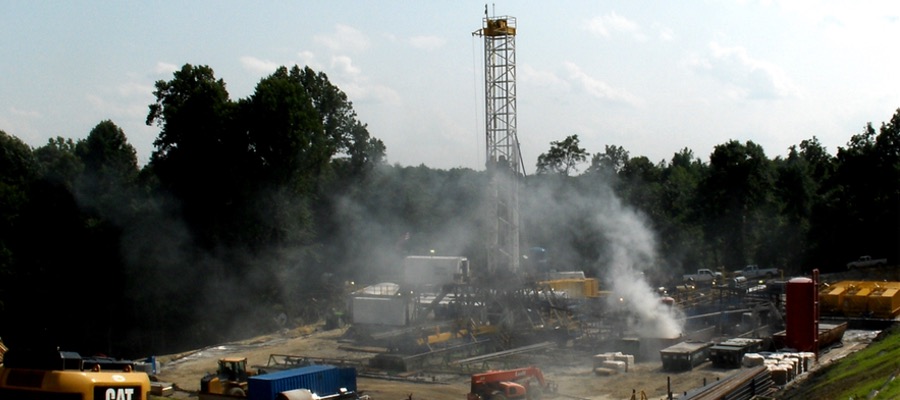
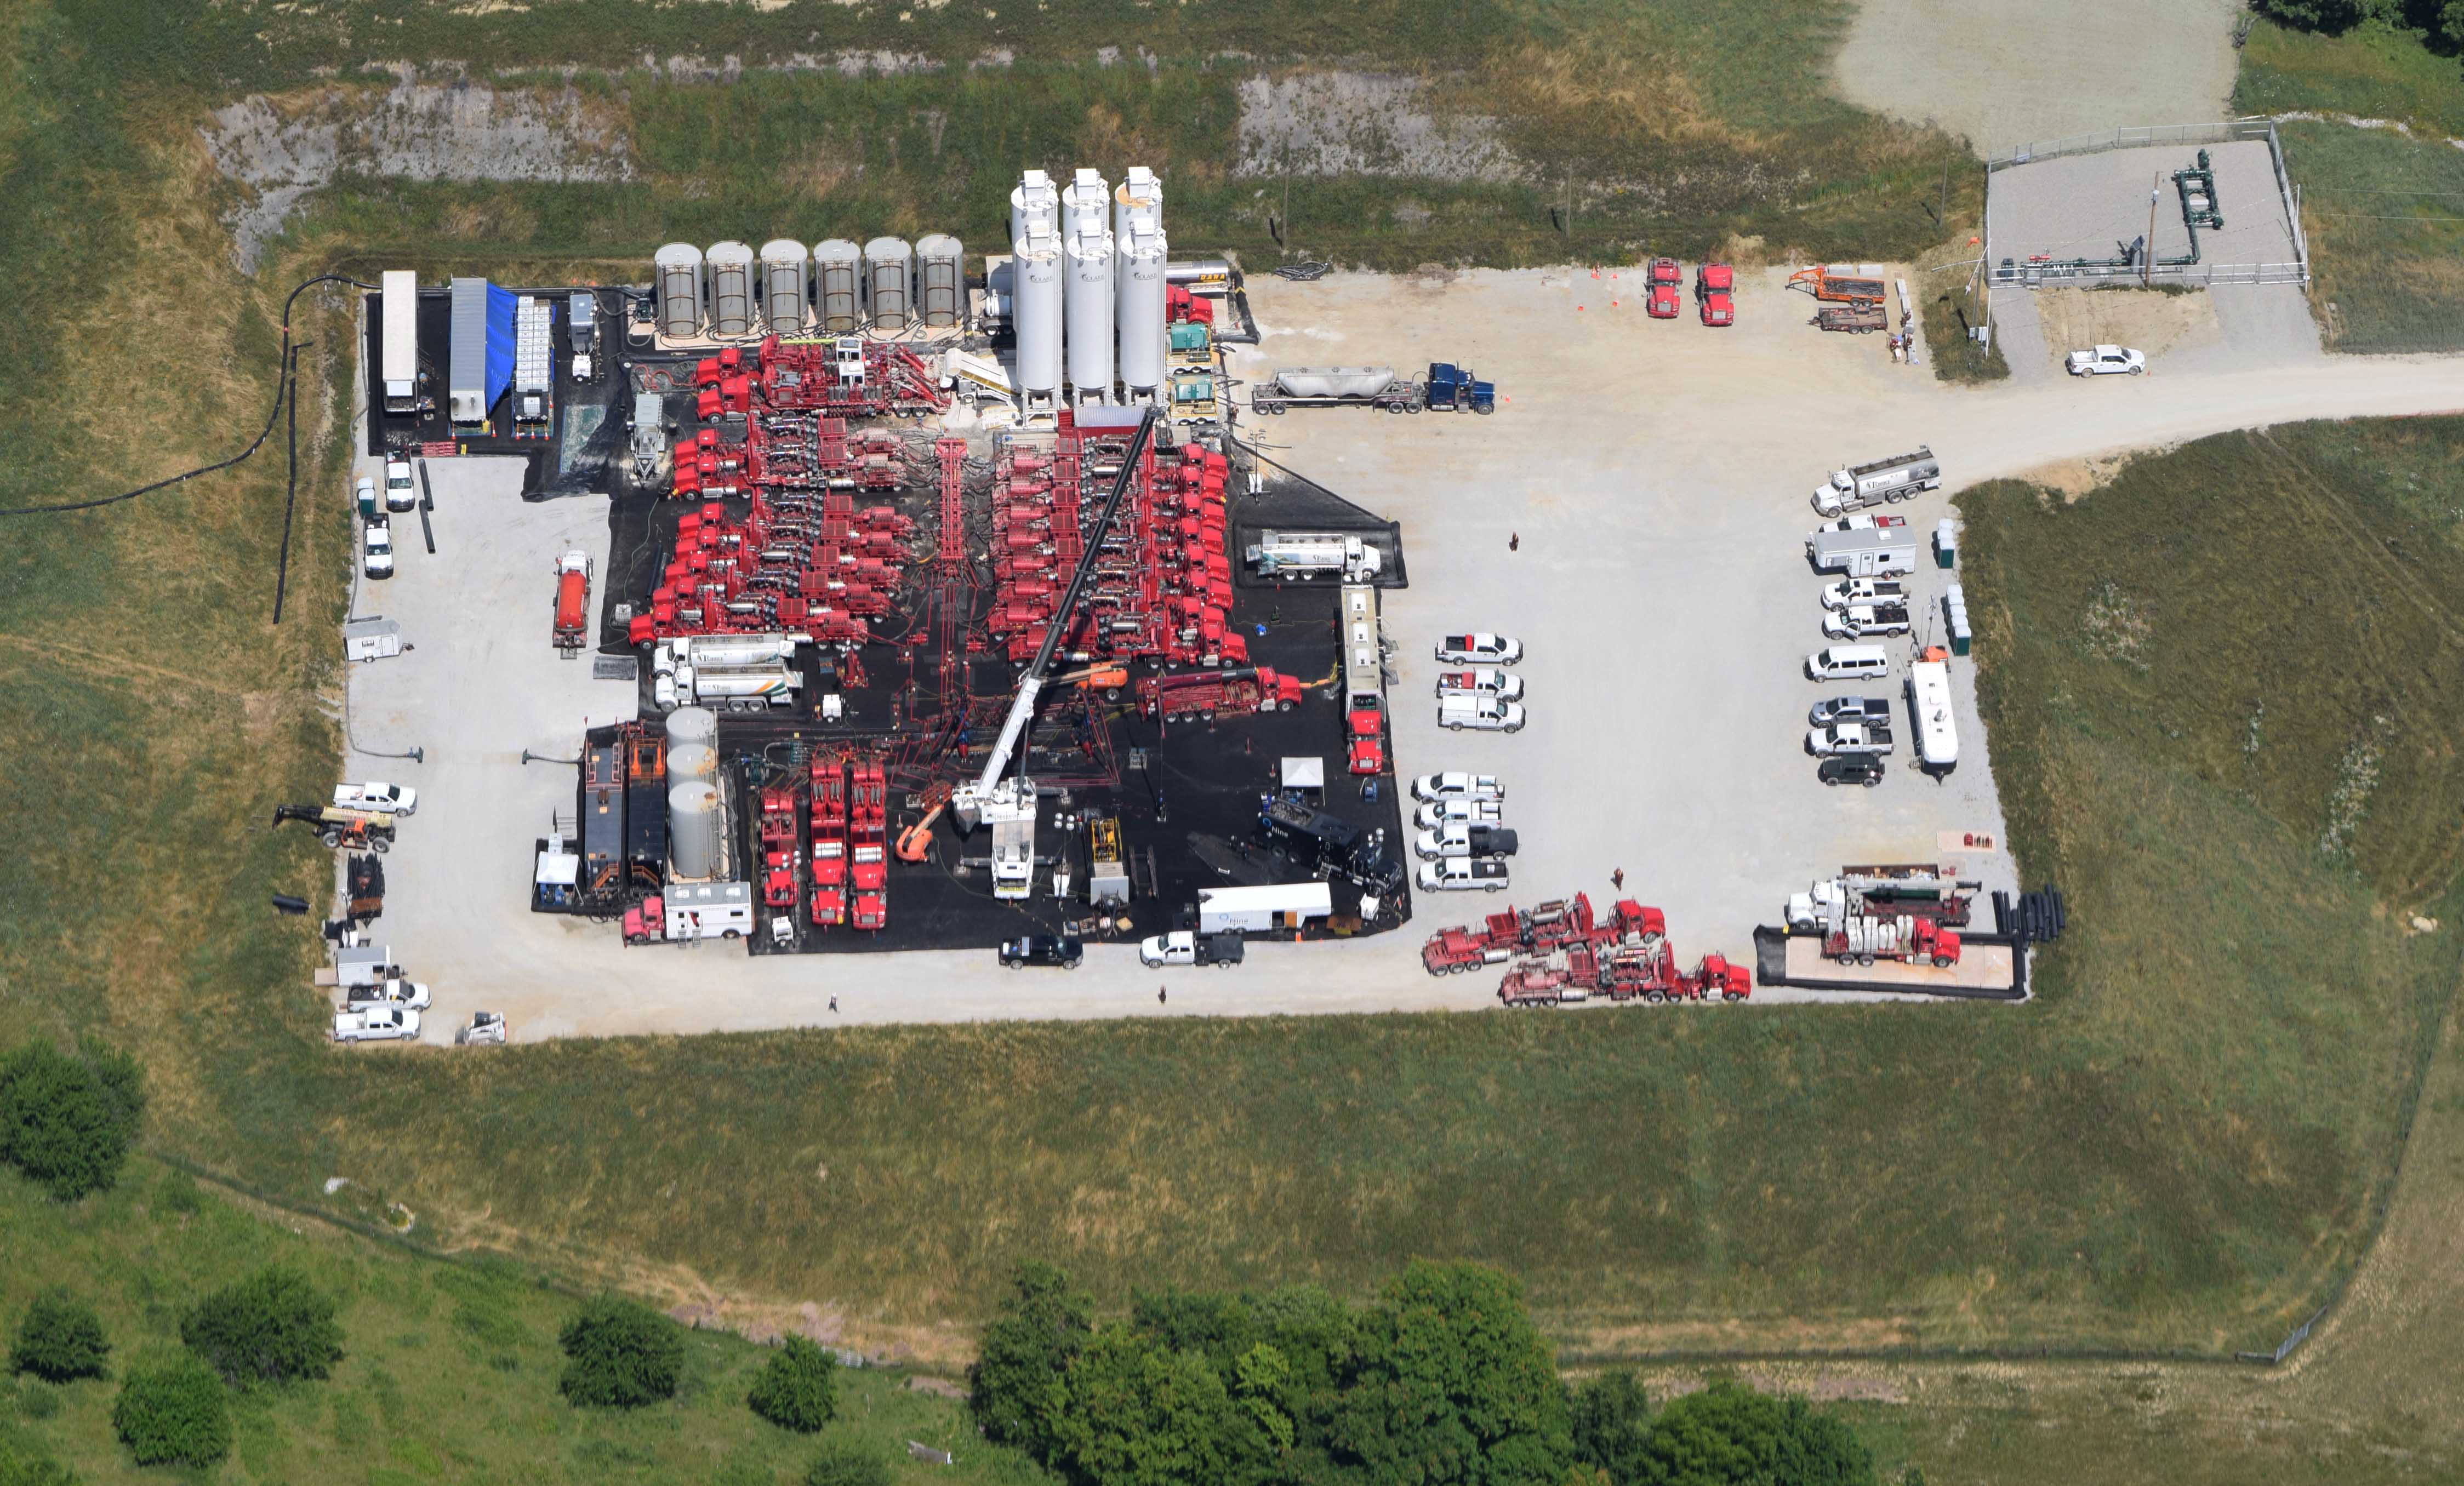
Hydraulic Fracturing “Fracking” at a well-pad outside Barnesville, Ohio operated by Halliburton
The industrial practice of disposing of oil and gas drilling waste into Class II injection wells causes a lot of strife for people on both sides of the fracking debate. This process has exposed many “hidden [geologic] faults” across the US as a result of induced seismicity. It has been linked in recent months and years with increases in earthquake activity in states like Arkansas, Kansas, Texas, and Ohio.
Locally, there is growing evidence in counties – from Ashtabula to Washington – that Ohio Class II injection well volumes and quarterly rates of change are related to upticks in seismic activity (Figs. 1-3). But exactly how much waste are these sites receiving, and where is it coming from? Since it has been a little over a year since last we looked at the injection well landscape here in Ohio, we decided to revisit the issue here.
Figures 1-3. Ohio Class II Injection Well disposal during Q3-2010, Q2-2012, and Q2-2015
The Class II Landscape in Ohio
In Ohio 245+ Class II Salt Water Disposal (SWD) Disposal Wells are permitted to accept unconventional oil and gas waste. Their disposal capacity and number of wells served is by far the most of any state across the Marcellus and Utica Shale plays.
Ohio’s Class II Injection wells have accepted an average of 22,750 barrels per quarter per well (BPQPW) (662,632 gallons) of oil and gas wastewater over the last year. In comparison, our last analysis uncovered a higher quarterly average (29,571 BPQPW) between the initiation of frack waste injection in 2010 and Q2-2015 (Fig. 4). This shift is likely due to the significant decrease in overall drilling activity from 2012 to 2015. Between Q3-2010 and Q1-2016, however, OH’s Class II injection wells saw an exponential increase in injection activity. In total, 109.4 million barrels (3.8-4.6 billion gallons) of waste was disposed in Ohio. From a financial perspective this waste has generated $3.4 million in revenue for the state or 00.014% of the average state budget (Note: 2.5% of ODNR’s annual budget).
The more important point is that even in slow times (i.e., Q2-2015 to the present) the trend continues to migrate from the bottom-left to the top-right, with each of Ohio’s Class II injection wells seeing quarterly demand increases of 972 BPQPW (34,017-40,821 gallons). This means that the total volume coming into our Class II Wells is increasing at a rate of 8.2-9.8 MGs per year, or the equivalent to the water demand of several high volume hydraulically fractured wells.
With respect to the source of this waste, the story isn’t as clear as we had once thought. Slightly more than half the waste came from out-of-state during the first two years for which we have data, but this statistic plummeted to as low as 32% in the last year-to-date (Fig. 5). This change is likely do to the high levels of brine being produced in Ohio as the industry migrates towards the perimeter of the Utica Shale.
Figures 4 and 5
Freshwater Demand and Brine Production
Map of Ohio Utica Brine Production and Class II Injection Well Disposal
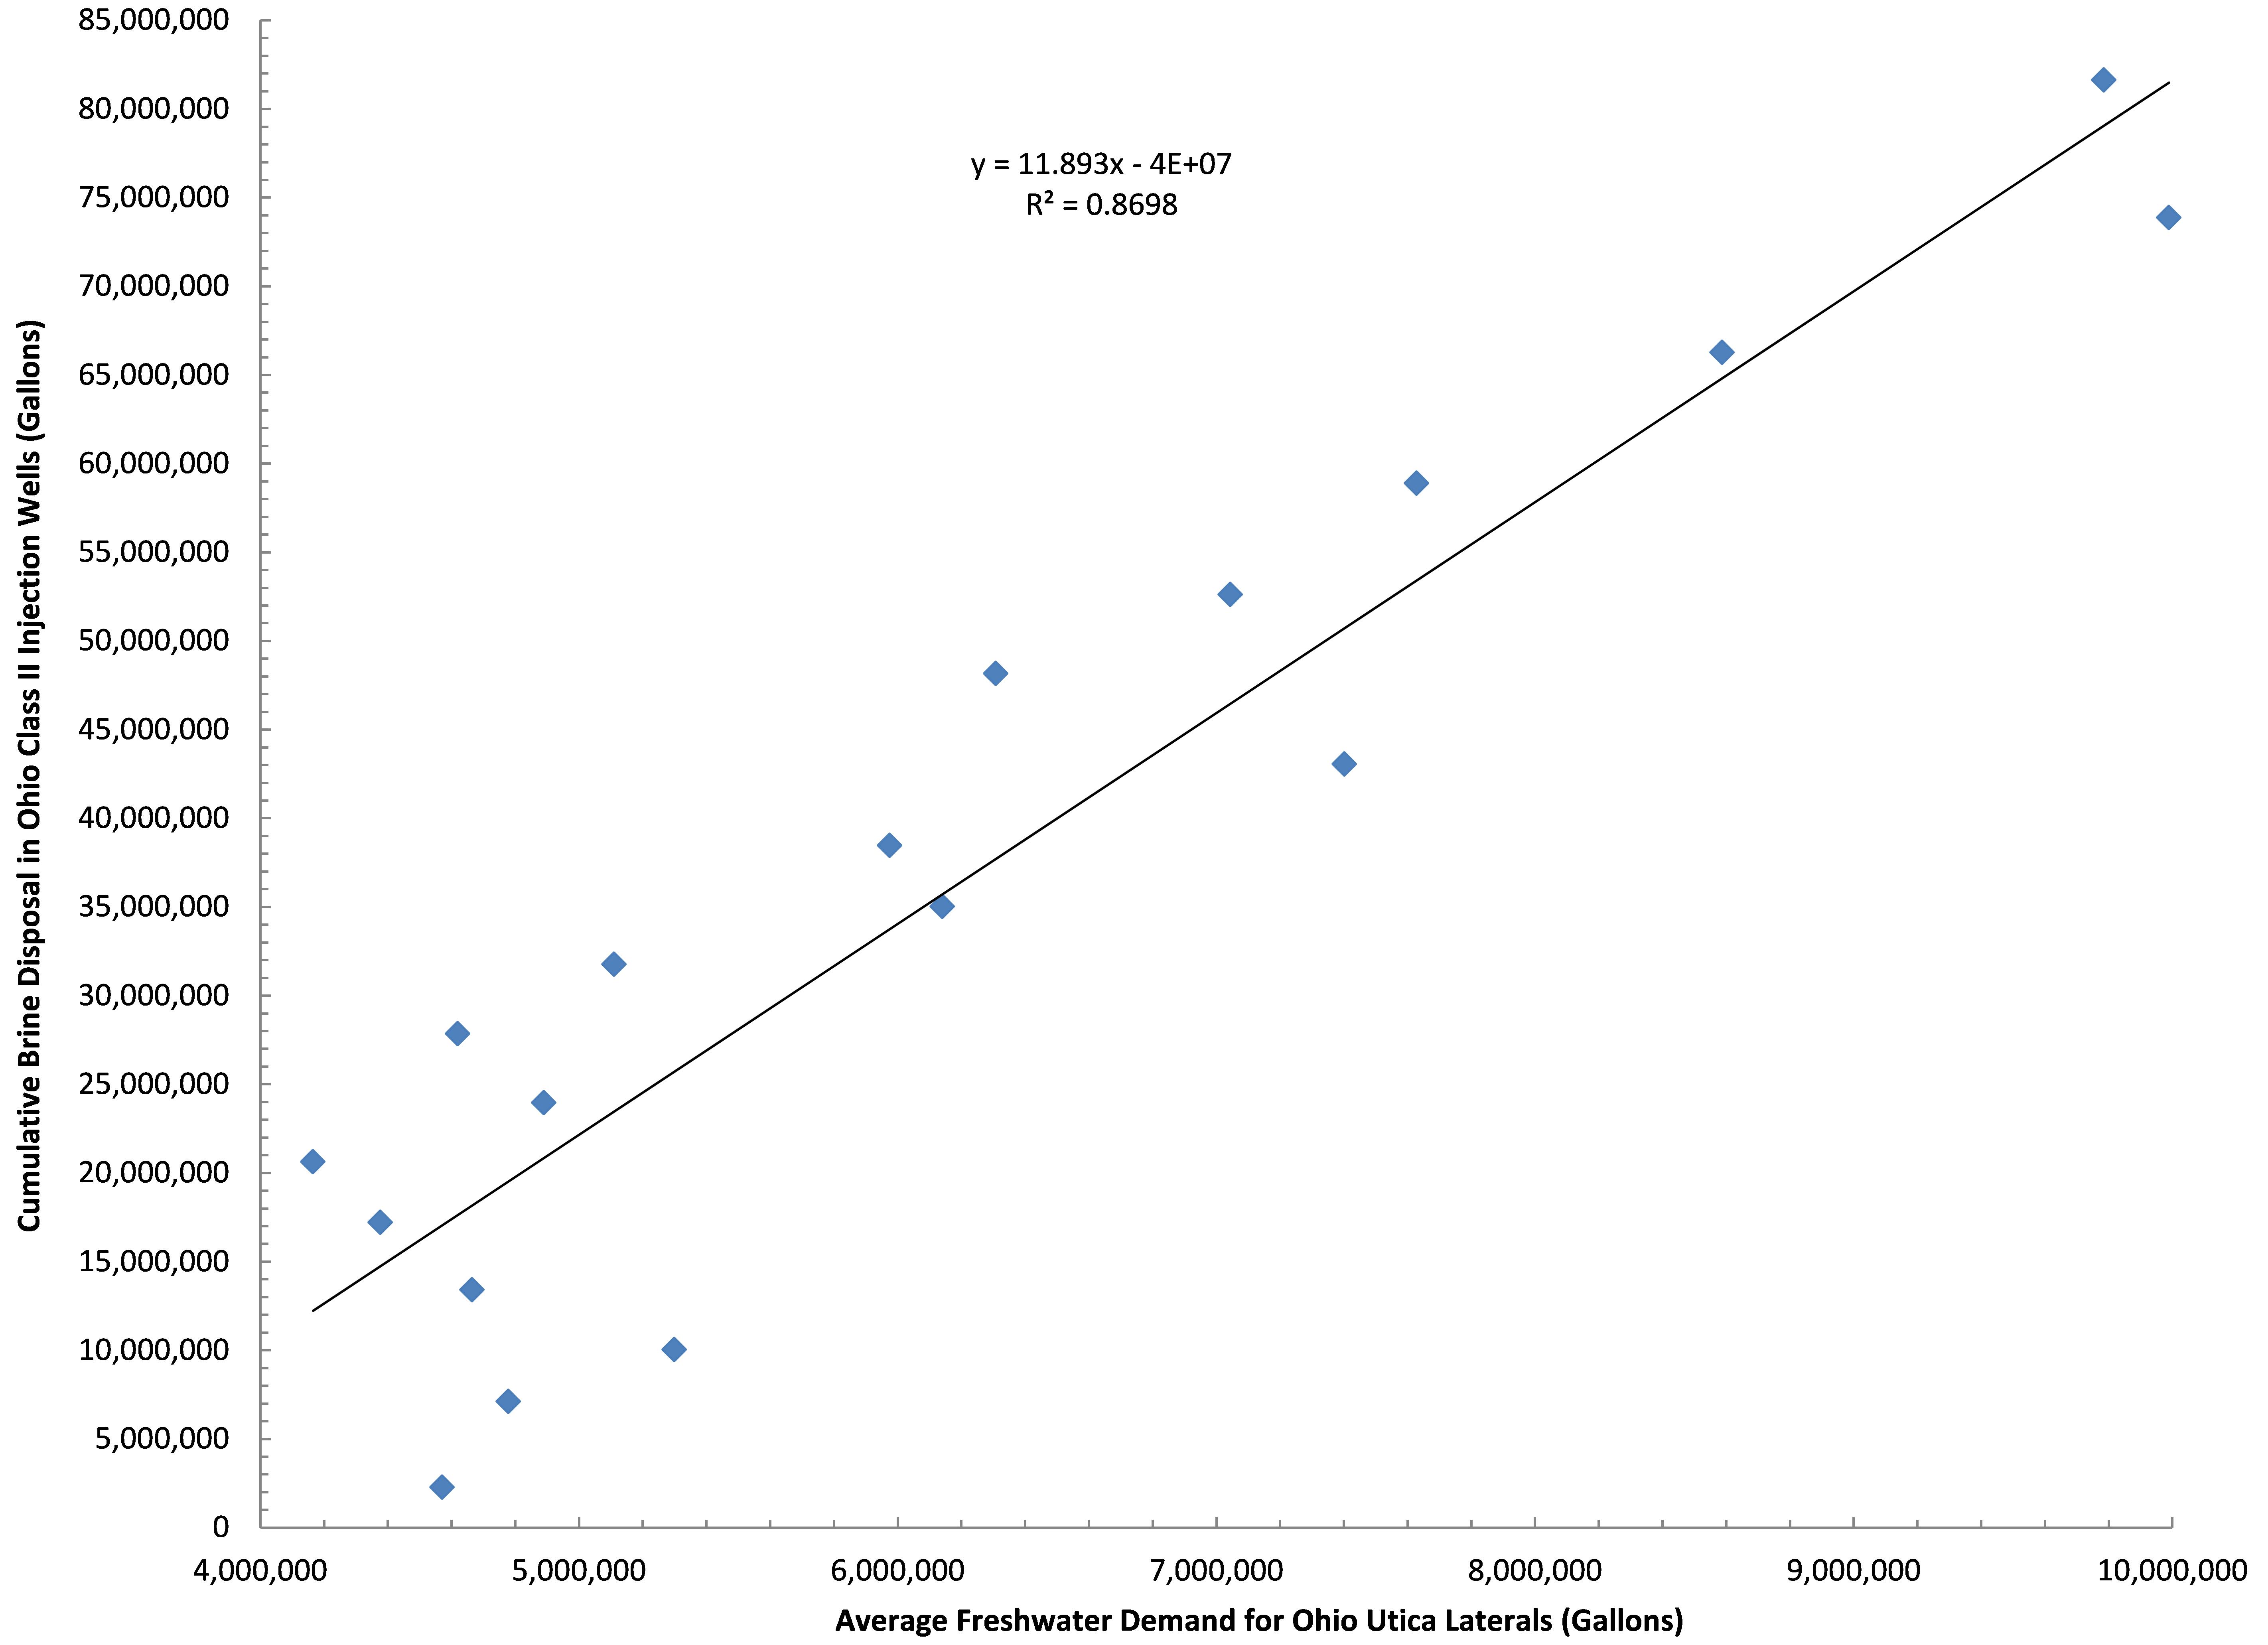
Figure 6. Ohio Class II Injection Well disposal as a function of freshwater demand by the shale industry in Ohio between Q3-2010 and Q1-2015
To gain a more comprehensive understanding of what’s going on with Class II wastewater disposal in Ohio, it’s important to look into the relationship between brine and freshwater demand by the hydraulic fracturing industry. The average freshwater demand during the fracking process, accounts for 87% of the trend in brine disposal in Ohio (Fig. 6).
As we mentioned, demand for freshwater is growing to the tune of 405-410,000 gallons PQPW in Ohio, which means brine production is growing by roughly 12,000 gallons PQPW. This says nothing for the 450,000 gallons of freshwater PQPW increase in West Virginia and their likely demand for injection sites that can accommodate their 13,500 gallons PQPW increase.
Conclusion
Essentially, the seismic center of Ohio has migrated eastward in recent years; originally it was focused on Western counties like Shelby, Logan, Auglaize, Darke, and Miami on the Indiana border, but it has recently moved to injection well hotbed counties like Ashtabula, Trumbull, and Washington along the Pennsylvania and West Virginia borders. This growth in “induced seismicity” resulting from the uptick in frack waste disposal puts Ohio in the company of Oklahoma, Arkansas, Colorado, Kansas, New Mexico, and Texas. Each of those states have reported ≥4.0 magnitude “man-made” quakes since 2008. Between 1973 and 2008 an average of 21 earthquakes of ≥M3 were reported in the Central/Eastern US. This number jumped to 99 between 2009 and 2013, with 659 of M3+ in 2014 alone according to the USGS and Virginia Tech Seismological Observatory (VTSO). This “hockey stick moment” is exemplified in the below figure from a recent USGS publication (Fig. 7). Figure 8 illustrates the spatial relationship between recent seismic activity and Class II Injection well volumes here in Ohio. The USGS even went so far as to declare the following:
An unprecedented increase in earthquakes in the U.S. mid-continent began in 2009. Many of these earthquakes have been documented as induced by wastewater injection…We find that the entire increase in earthquake rate is associated with fluid injection wells. High-rate injection wells (>300,000 barrels per month) are much more likely to be associated with earthquakes than lower-rate wells.
– From USGS Report High-rate injection is associated with the increase in U.S. mid-continent seismicity
Figures 7 and 8
The sentiment here in Ohio regarding Class II Injection wells is best summed up by Dr. Ray Beiersdorfer, Distinguished Professor of Geology, Youngstown State University and his wife geologist Susie Beiersdorfer who jointly submitted the following quote regarding the North Star (SWIW #10) Class II Injection Well in Mahoning County, which processed 555,030 barrels (21,368,655 gallons) of fracking waste between Q4-2010 and Q4-2011[1].
The operator, D&L, and the ODNR denied the correlation in space and time between the injection of toxic fracking fluids into the well and earthquakes for over eight months in 2011. The well was shut down on December 30 and the largest seismic event, a 4.0 happened at 3:04 p.m. on December 31, 2011. Though the rules say that a “shut-in” well must be plugged after 60 days, this well is still “open” after 1656 days (July 12, 2016). This well must be plugged [and abandoned] to prevent further risks to the health and safety of the Youngstown community… According to Rick Simmers, the only thing holding this up is bankruptcy procedures. It was drilled into a fault, triggered over five hundred earthquakes, including a Magnitude 4.0 that caused damage to homes. [It is likely] that any other use of this well would trigger additional hazardous earthquakes.
Images From Across Ohio
Click on the images below to explore visual documentation and volumes disposed (as of Q1-2016) into Class II Injection wells in Ohio.
https://www.fractracker.org/a5ej20sjfwe/wp-content/uploads/2016/07/ClassIIOhio-Feature.jpg400900Ted Auch, PhDhttps://www.fractracker.org/a5ej20sjfwe/wp-content/uploads/2021/04/2021-FracTracker-logo-horizontal.pngTed Auch, PhD2016-07-15 14:03:162020-03-12 17:19:05OH Class II Injection Wells – Waste Disposal Trends and Images From Around Ohio


 Class II Injection Well, Ashtabula County, Ohio")
 Class II Injection Well, Ashtabula County, Ohio")
 Class II Injection Well, Lake County, Ohio")
 Class II Injection Well, Lake County, Ohio")


, Knox County, Ohio")

 Class II Injection Well in Mahoning County, Ohio")


