OH Class II Injection Wells – Waste Disposal Trends and Images From Around Ohio
By Ted Auch, PhD – Great Lakes Program Coordinator
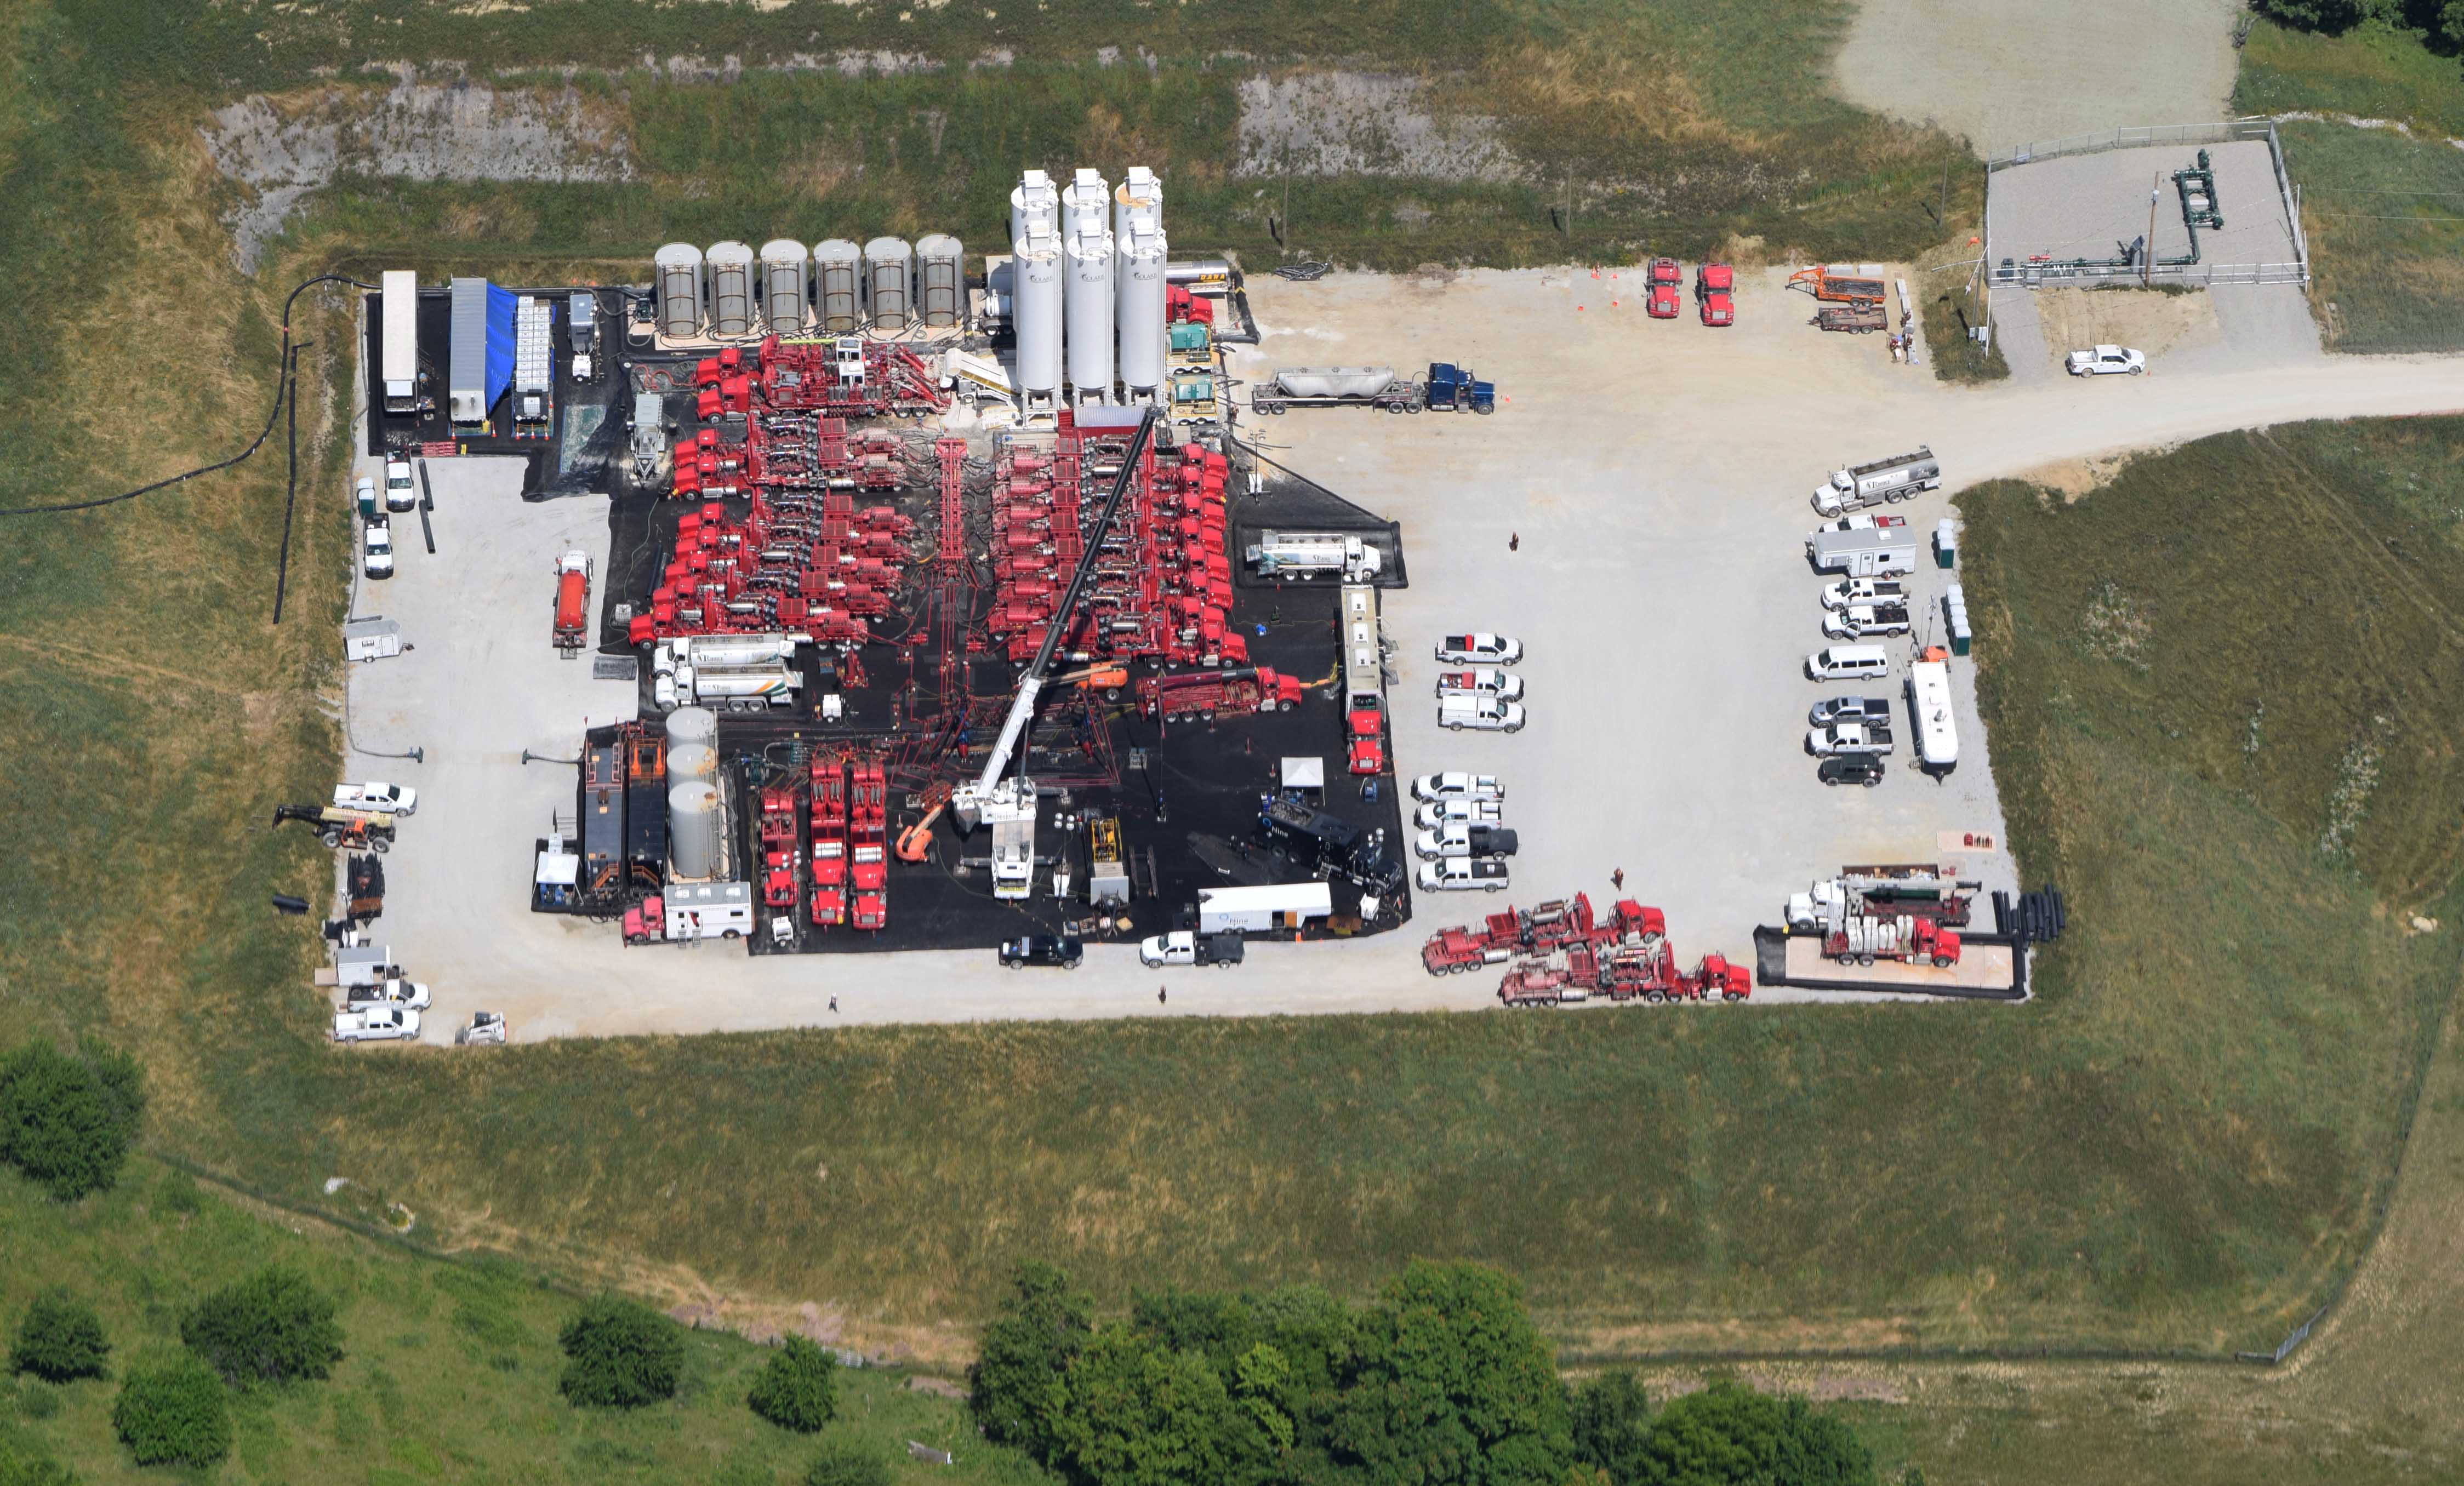
Hydraulic Fracturing “Fracking” at a well-pad outside Barnesville, Ohio operated by Halliburton
The industrial practice of disposing of oil and gas drilling waste into Class II injection wells causes a lot of strife for people on both sides of the fracking debate. This process has exposed many “hidden [geologic] faults” across the US as a result of induced seismicity. It has been linked in recent months and years with increases in earthquake activity in states like Arkansas, Kansas, Texas, and Ohio.
Locally, there is growing evidence in counties – from Ashtabula to Washington – that Ohio Class II injection well volumes and quarterly rates of change are related to upticks in seismic activity (Figs. 1-3). But exactly how much waste are these sites receiving, and where is it coming from? Since it has been a little over a year since last we looked at the injection well landscape here in Ohio, we decided to revisit the issue here.
Figures 1-3. Ohio Class II Injection Well disposal during Q3-2010, Q2-2012, and Q2-2015


The Class II Landscape in Ohio
In Ohio 245+ Class II Salt Water Disposal (SWD) Disposal Wells are permitted to accept unconventional oil and gas waste. Their disposal capacity and number of wells served is by far the most of any state across the Marcellus and Utica Shale plays.
Ohio’s Class II Injection wells have accepted an average of 22,750 barrels per quarter per well (BPQPW) (662,632 gallons) of oil and gas wastewater over the last year. In comparison, our last analysis uncovered a higher quarterly average (29,571 BPQPW) between the initiation of frack waste injection in 2010 and Q2-2015 (Fig. 4). This shift is likely due to the significant decrease in overall drilling activity from 2012 to 2015. Between Q3-2010 and Q1-2016, however, OH’s Class II injection wells saw an exponential increase in injection activity. In total, 109.4 million barrels (3.8-4.6 billion gallons) of waste was disposed in Ohio. From a financial perspective this waste has generated $3.4 million in revenue for the state or 00.014% of the average state budget (Note: 2.5% of ODNR’s annual budget).
The more important point is that even in slow times (i.e., Q2-2015 to the present) the trend continues to migrate from the bottom-left to the top-right, with each of Ohio’s Class II injection wells seeing quarterly demand increases of 972 BPQPW (34,017-40,821 gallons). This means that the total volume coming into our Class II Wells is increasing at a rate of 8.2-9.8 MGs per year, or the equivalent to the water demand of several high volume hydraulically fractured wells.
With respect to the source of this waste, the story isn’t as clear as we had once thought. Slightly more than half the waste came from out-of-state during the first two years for which we have data, but this statistic plummeted to as low as 32% in the last year-to-date (Fig. 5). This change is likely do to the high levels of brine being produced in Ohio as the industry migrates towards the perimeter of the Utica Shale.
Figures 4 and 5


Freshwater Demand and Brine Production
Map of Ohio Utica Brine Production and Class II Injection Well Disposal
View map fullscreen | How FracTracker maps work | Download map data | Related OH Shale Gas Viewer
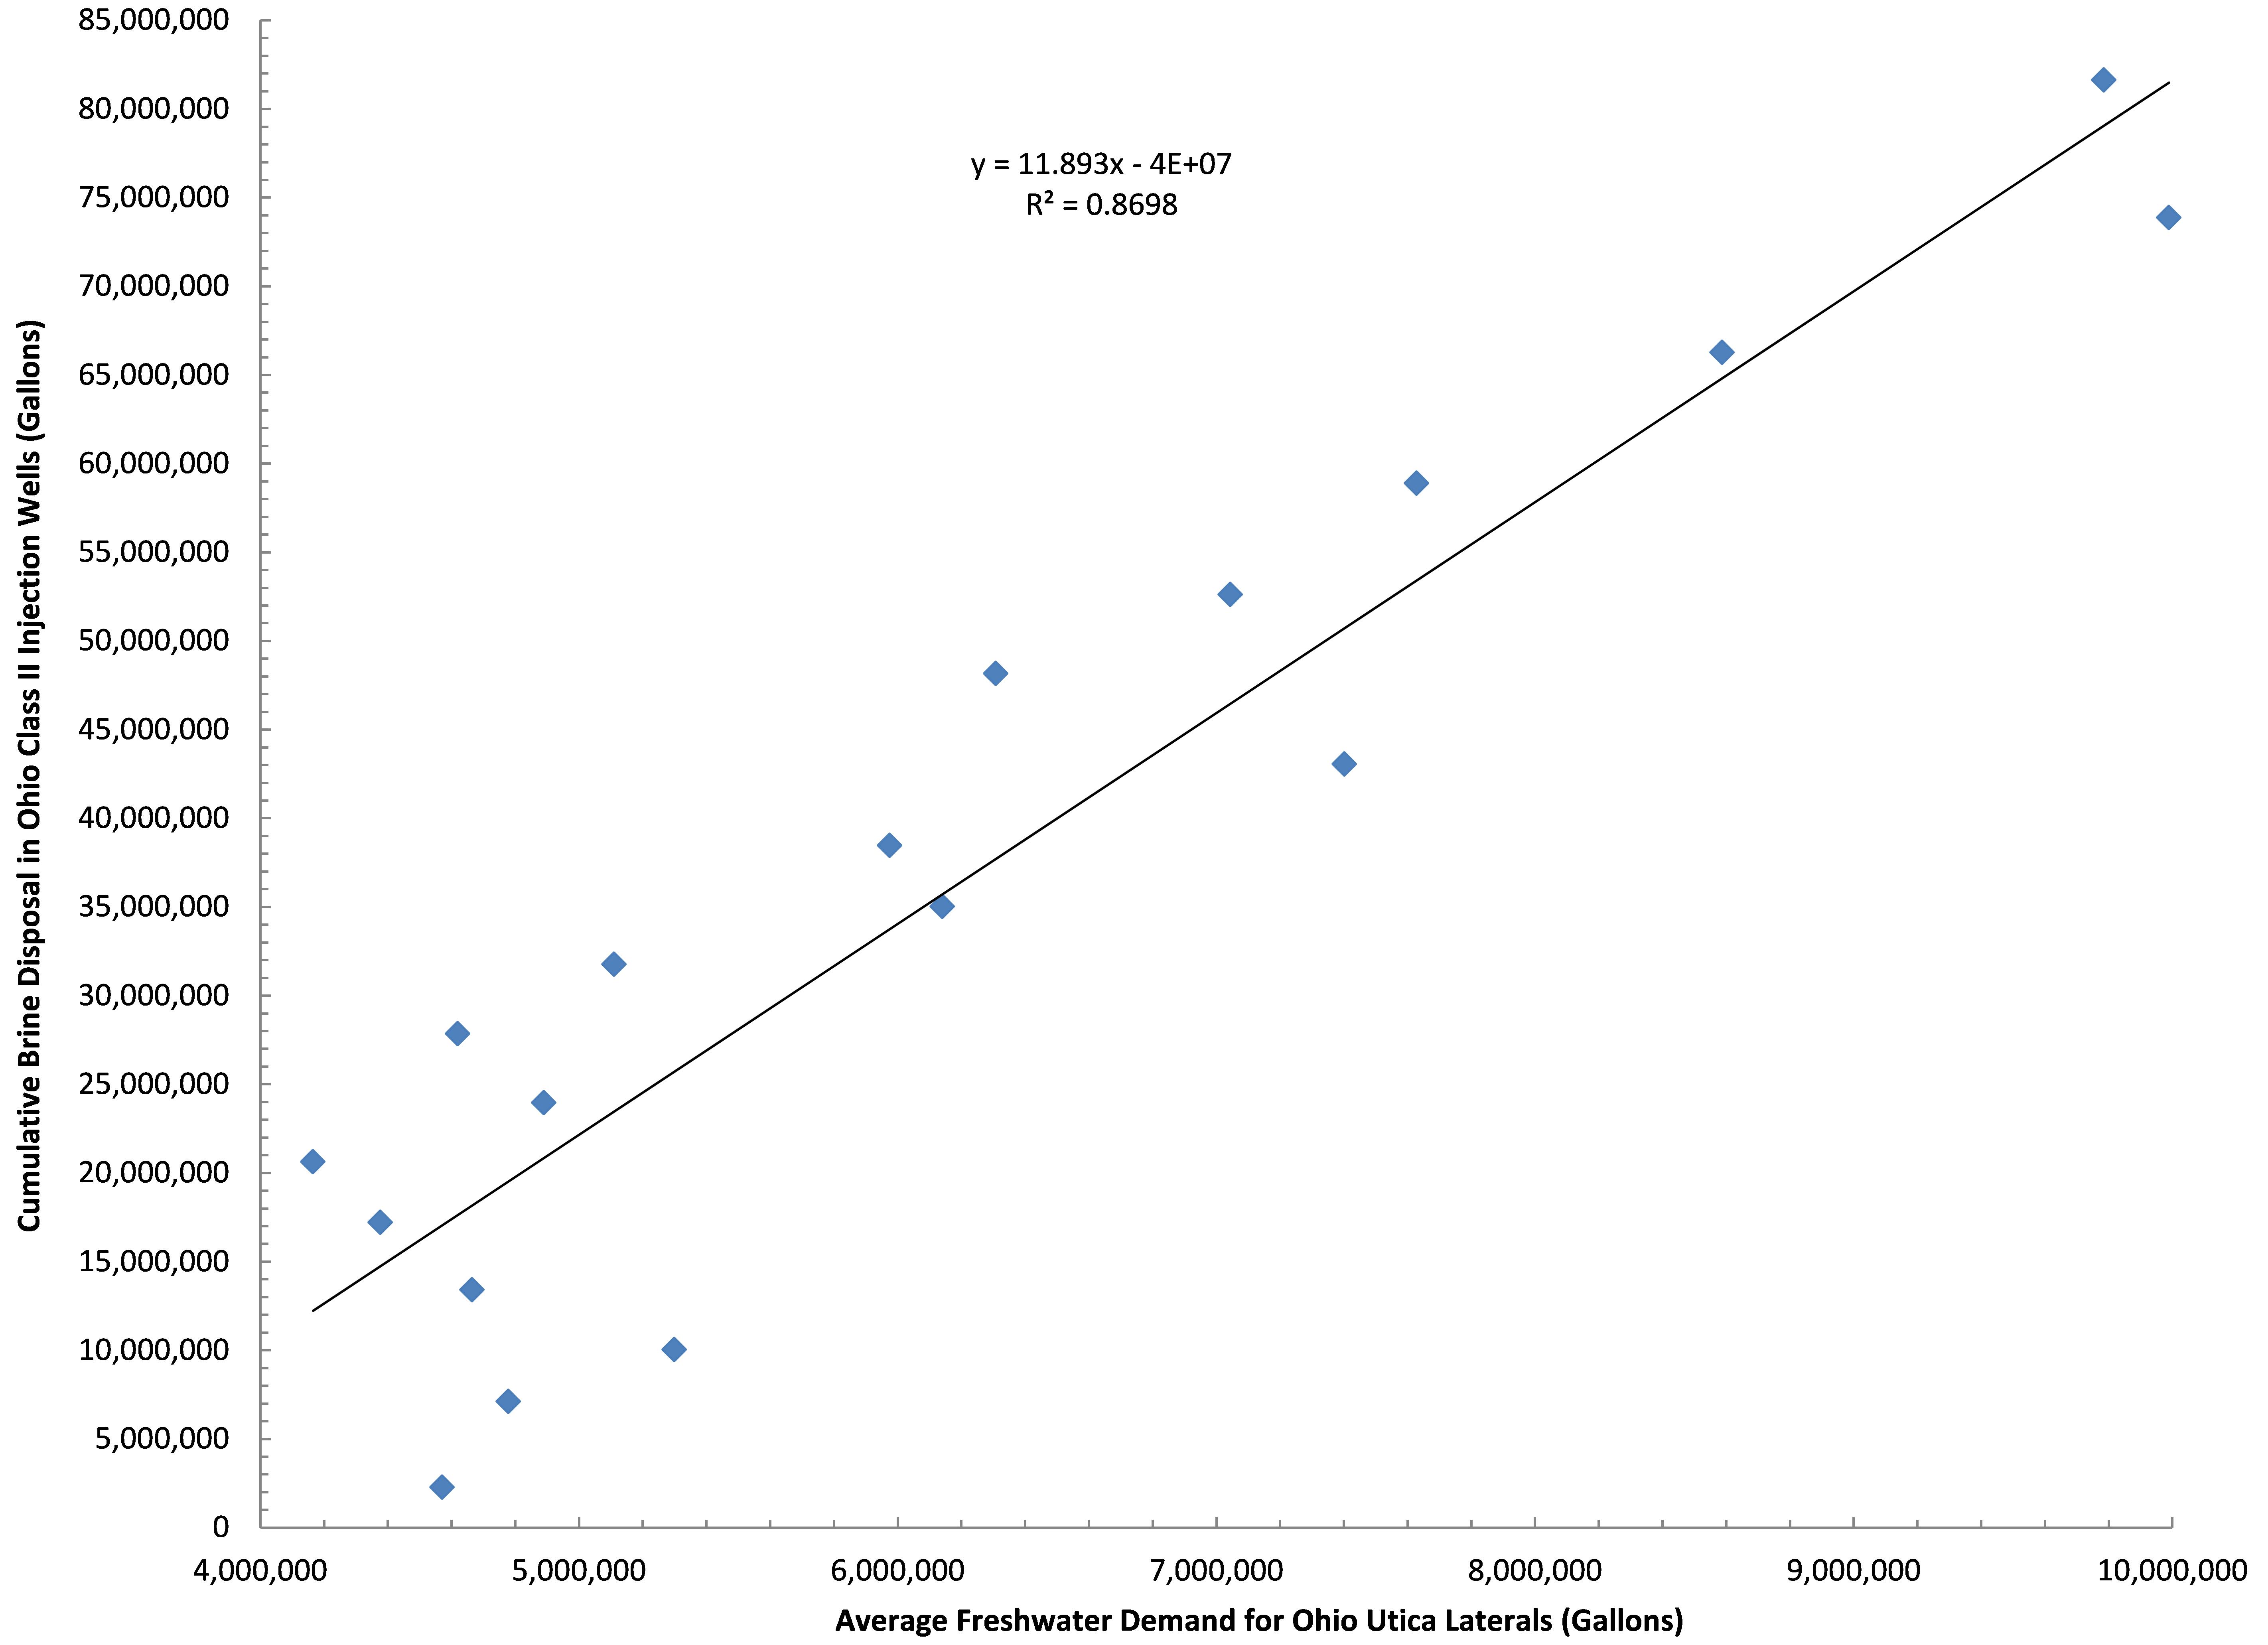
Figure 6. Ohio Class II Injection Well disposal as a function of freshwater demand by the shale industry in Ohio between Q3-2010 and Q1-2015
To gain a more comprehensive understanding of what’s going on with Class II wastewater disposal in Ohio, it’s important to look into the relationship between brine and freshwater demand by the hydraulic fracturing industry. The average freshwater demand during the fracking process, accounts for 87% of the trend in brine disposal in Ohio (Fig. 6).
As we mentioned, demand for freshwater is growing to the tune of 405-410,000 gallons PQPW in Ohio, which means brine production is growing by roughly 12,000 gallons PQPW. This says nothing for the 450,000 gallons of freshwater PQPW increase in West Virginia and their likely demand for injection sites that can accommodate their 13,500 gallons PQPW increase.
Conclusion
Essentially, the seismic center of Ohio has migrated eastward in recent years; originally it was focused on Western counties like Shelby, Logan, Auglaize, Darke, and Miami on the Indiana border, but it has recently moved to injection well hotbed counties like Ashtabula, Trumbull, and Washington along the Pennsylvania and West Virginia borders. This growth in “induced seismicity” resulting from the uptick in frack waste disposal puts Ohio in the company of Oklahoma, Arkansas, Colorado, Kansas, New Mexico, and Texas. Each of those states have reported ≥4.0 magnitude “man-made” quakes since 2008. Between 1973 and 2008 an average of 21 earthquakes of ≥M3 were reported in the Central/Eastern US. This number jumped to 99 between 2009 and 2013, with 659 of M3+ in 2014 alone according to the USGS and Virginia Tech Seismological Observatory (VTSO). This “hockey stick moment” is exemplified in the below figure from a recent USGS publication (Fig. 7). Figure 8 illustrates the spatial relationship between recent seismic activity and Class II Injection well volumes here in Ohio. The USGS even went so far as to declare the following:
An unprecedented increase in earthquakes in the U.S. mid-continent began in 2009. Many of these earthquakes have been documented as induced by wastewater injection…We find that the entire increase in earthquake rate is associated with fluid injection wells. High-rate injection wells (>300,000 barrels per month) are much more likely to be associated with earthquakes than lower-rate wells.
– From USGS Report High-rate injection is associated with the increase in U.S. mid-continent seismicity
Figures 7 and 8


The sentiment here in Ohio regarding Class II Injection wells is best summed up by Dr. Ray Beiersdorfer, Distinguished Professor of Geology, Youngstown State University and his wife geologist Susie Beiersdorfer who jointly submitted the following quote regarding the North Star (SWIW #10) Class II Injection Well in Mahoning County, which processed 555,030 barrels (21,368,655 gallons) of fracking waste between Q4-2010 and Q4-2011[1].
The operator, D&L, and the ODNR denied the correlation in space and time between the injection of toxic fracking fluids into the well and earthquakes for over eight months in 2011. The well was shut down on December 30 and the largest seismic event, a 4.0 happened at 3:04 p.m. on December 31, 2011. Though the rules say that a “shut-in” well must be plugged after 60 days, this well is still “open” after 1656 days (July 12, 2016). This well must be plugged [and abandoned] to prevent further risks to the health and safety of the Youngstown community… According to Rick Simmers, the only thing holding this up is bankruptcy procedures. It was drilled into a fault, triggered over five hundred earthquakes, including a Magnitude 4.0 that caused damage to homes. [It is likely] that any other use of this well would trigger additional hazardous earthquakes.
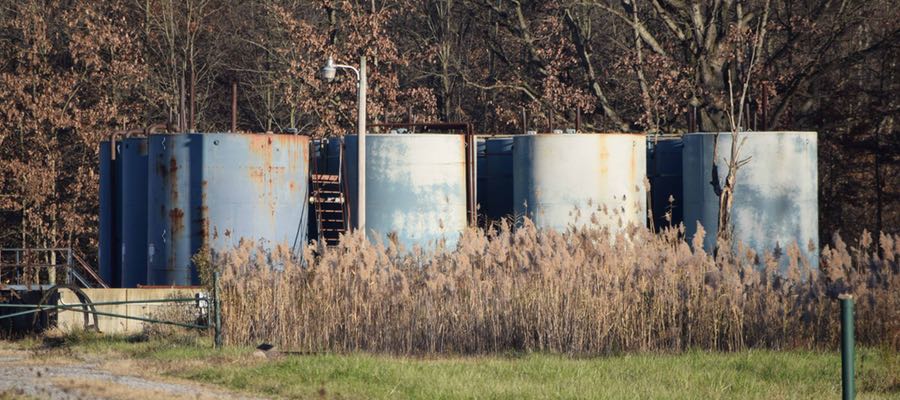
Images From Across Ohio
Click on the images below to explore visual documentation and volumes disposed (as of Q1-2016) into Class II Injection wells in Ohio.
 Class II Injection Well, Ashtabula County, Ohio")
 Class II Injection Well, Ashtabula County, Ohio")
 Class II Injection Well, Lake County, Ohio")
 Class II Injection Well, Lake County, Ohio")


, Knox County, Ohio")

 Class II Injection Well in Mahoning County, Ohio")


Footnote
- This is the infamous Lupo well which was linked to 109 tremors in Youngstown by researchers at the Lamont-Doherty Earth Observatory at Columbia University back in the Summer of 2013. The owner of the well Ben W. Lupo was subsequently charged with violating the Clean water Act.
Trackbacks & Pingbacks
[…] Class II injection Well, Wyles Howard, Holmes County, Ohio, with 181,513 barrels of fracking waste having been processed between Q3-2010 and Q1-2015. Photo courtesy of FracTracker. […]
Comments are closed.