That’s one way to describe climate change. It proceeds ahead of schedule, threatening to wreak havoc on the world we know. No longer merely flirting with disaster, we’re tangled in a frenetic dance to save ourselves. Our friends at Years of Living Dangerously have vividly captured the scale of what’s at stake.
Meanwhile, a laundry list of deplorable measures by President Trump ignores or outright dismantles America’s capacity to respond. Federal investment in clean energy is forsaken. Retro economics reigns replete with dystopian impacts on people and the planet. It could be 1950 all over again. Then, we were blinded by the future – fooled that oil and ingenuity would win the day. Today we are sobered by it. Only wholesale change can get us to tomorrow.
The technologies and bright ideas are ready for broader deployment. They’re propelled by information, action, and unbridled hope. Hope feeds exponentially on the hope of others. The organism grows more powerful and adept through colonial enrichment.
Saturday’s Climate March, the People’s Climate Movement, is the feast of a lifetime, a chance to nurture our souls and make a statement for the generations. By bike, rail, bus or carpool, head to Washington, DC or a satellite March site on April 29th. Put on your earth shoes, walk in solidarity, and make the deniers shake in their sole-less shoes.
And don’t for a second think this will be the last word. When you’re choking Mother Earth, it’s a fight to the finish. Cooler heads prevail.
By Brook Lenker, Executive Director, FracTracker Alliance
https://www.fractracker.org/a5ej20sjfwe/wp-content/uploads/2017/04/Earth-Shoes-March-Feature.jpg400900Guest Authorhttps://www.fractracker.org/a5ej20sjfwe/wp-content/uploads/2021/04/2021-FracTracker-logo-horizontal.pngGuest Author2017-04-25 14:49:082021-04-15 15:03:09Put on Your Earth Shoes
By Alison Grass, Senior Researcher at Food & Water Watch
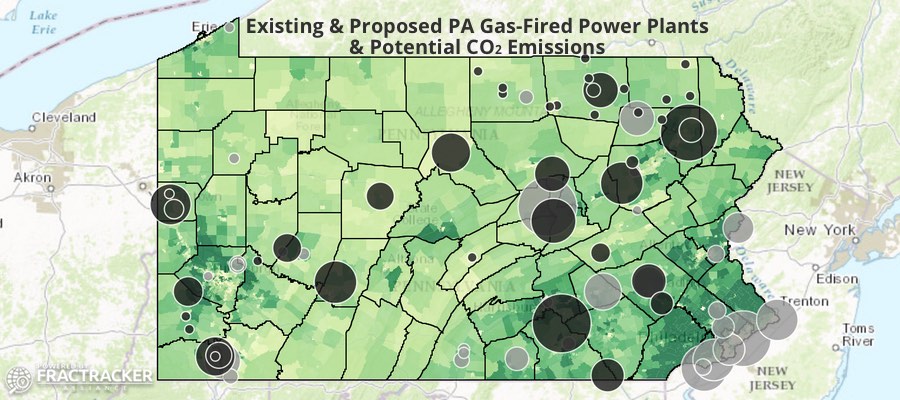
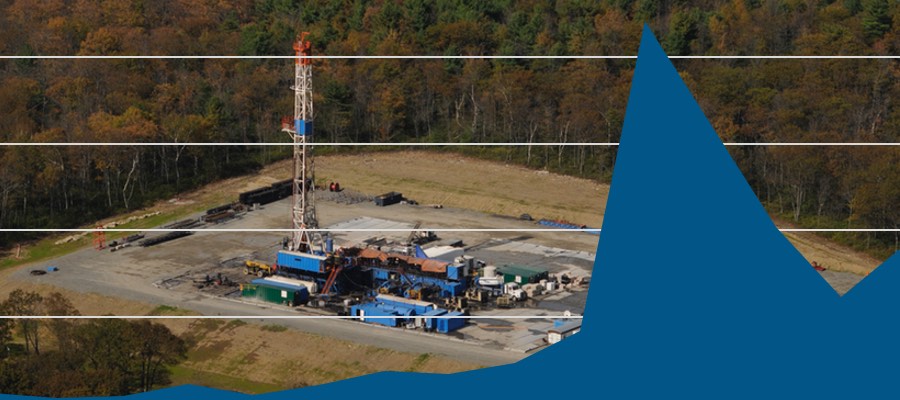
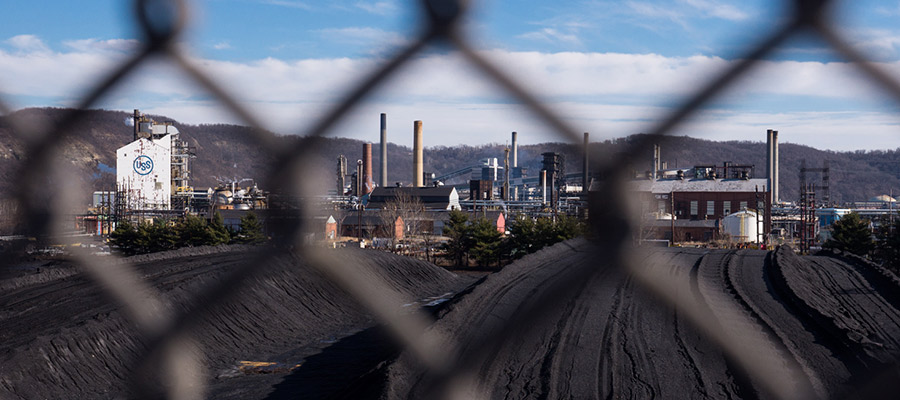
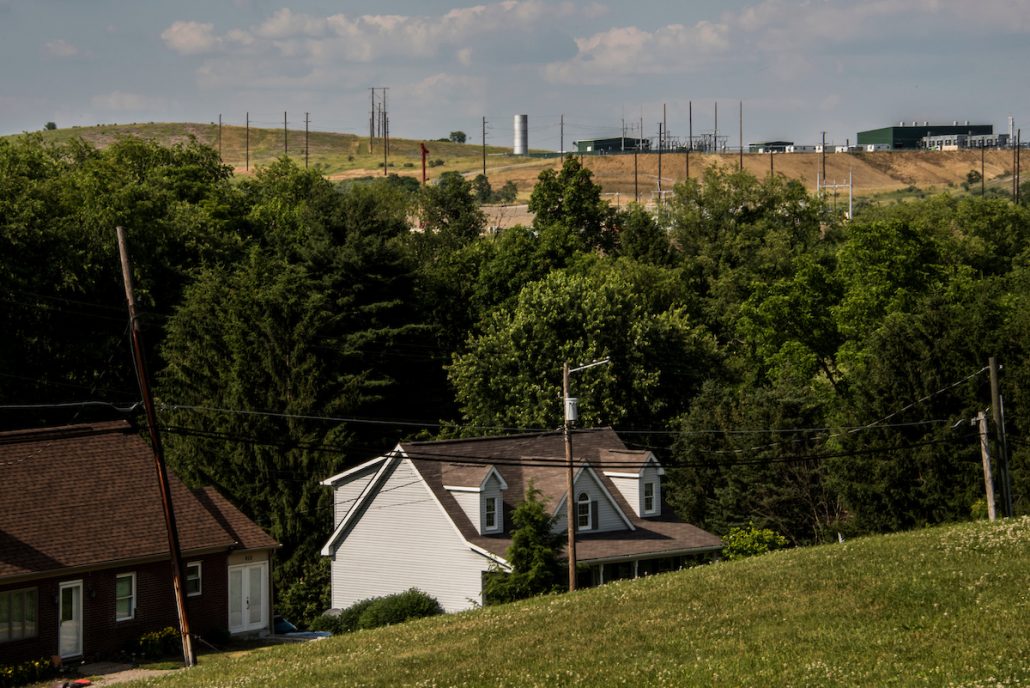
Over the past decade, the natural gas industry has experienced a renaissance that has been a boon to energy company profits. But it has altered the quality of life for the rural communities where most new gas wells have been drilled. Now, fracking is fueling a gas-fired power plant boom in Pennsylvania, with 47 new facilities. Most have already been approved, with a handful in commercial operation (see map below).
New research by Pennsylvanians Against Fracking shows, in vivid detail, the scale of this buildout, and the impacts it will have on Pennsylvania communities.
Current & Potential PA Gas-Fired Power Plants & their Emissions
Approximately half of the new gas power plants are located in northeastern region of Pennsylvania, a part of the state already overburdened by the lingering environmental maladies of coal mining and the more recent dangers associated with fracking. These rural communities may see increased drilling, fracking and pipeline construction to support the power plants — and the siting could be strategic. In a StateImpact Pennsylvania article about the first Marcellus shale gas power plant, for example, a company representative admitted that the location was chosen specifically due to its convenient access to shale gas. “This plant was sited precisely where it is because of its access to the abundant, high-quality natural gas that’s found a mile to two miles beneath our feet.”
Drilling Trends
The first modern Marcellus well was drilled in Pennsylvania by Range Resources in 2003, and commercial production began in 2005. Although fracking expanded rapidly in several areas across the country, Pennsylvania has been ground zero of the fracking boom, with just over 10,000 shale gas wells drilled between 2005 and 2016. Since then, however, there has been a rapid downturn in new wells drilled. After the early and dramatic increase in drilling – from 9 shale wells in 2005 to 1,957 shale wells in 2011 – the number dropped to 504 in 2016.
According to Natural Gas Intelligence, natural gas from the Appalachian Basin “…hit a roadblock in 2016, as pipeline projects struggled to move forward and a storage glut slowed the region’s previously rapid production growth.” Thus, it appears that in order to maintain fracking’s profitability, the gas industry is relying on new gas-fired power plants to alleviate the storage glut, while potentially increasing demand for shale gas (which could propagate more drilling and fracking).
Gas-Fired Power Plant Siting
The siting of these power plants also enables companies to use Pennsylvanian fracked gas to generate power for larger regional markets. This is because northeastern Pennsylvania is close to dense populations, including New York City. In Luzerne County, for instance, the new Caithness Moxie Freedom Generating Station gas-fired power plant will supply electricity to not just Pennsylvania residents, but also to New Jersey and New York State. And in the more central region of the state in Snyder County, the Panda Hummel Station will send “much of its power to the New York City market.”
Siting gas-fired power plants in the northeast may also increase drilling and fracking in the region, where gas is predominantly “dry” and less profitable than the “wet” gas found in southwest PA. This trend is largely due to a resurgence in North American petrochemical markets and increased ethane exports that rely on wet gas. (Dry natural gas contains primarily methane and smaller amounts of other hydrocarbons, while wet natural gas has higher concentrations of natural gas liquids. Natural gas liquids — predominantly ethane but also propane, butane, isobutane and pentanes — are the raw materials for manufacturing petrochemicals.)
Well Integrity and Other Risks
However, increased drilling and fracking mean more pollution for the Marcellus shale region of Pennsylvania, where shale gas wells have proven to be more prone to well construction “impairments” and well integrity problems, compared to conventional wells. This risk is especially true in the northeastern part of the state, where over nine percent of shale gas wells have indications of compromised well integrity.
Overall, fracking causes many public health and environmental problems. Methane, fracking fluids, and wastewater can pollute water supplies and imperil the livelihoods of farmers, who rely on clean water. Increased truck traffic and drilling emissions reduce air quality, and methane leaks contribute to global warming. Meanwhile, the proliferation of natural gas derricks and associated infrastructure destroys pristine landscapes (and related tourism and recreation industries).
The last thing that Pennsylvanians need is another way for the oil and gas industry to capitalize on shale at the expense of residents’ health and well-being.
https://www.fractracker.org/a5ej20sjfwe/wp-content/uploads/2017/03/Power-Plants-PA-Feature.jpg400900Guest Authorhttps://www.fractracker.org/a5ej20sjfwe/wp-content/uploads/2021/04/2021-FracTracker-logo-horizontal.pngGuest Author2017-04-21 13:34:192021-04-15 15:03:09Wanted: More Places to Burn Natural Gas
In 4th grade, every Wisconsin student learns about their state. Topics pertaining to Wisconsin’s economy, geography, and history along with ethnicity and traditions are introduced and explored. State facts and anecdotes are discussed and naturally memorized. The one that stood out to me the most was how Wisconsin became known as the “Badger State.”
The origin of the badger nickname is from mining. The 4th grade story I remember was that miners were too busy to build houses so they moved into abandoned mineshafts and/or dug their own burrows. These men became known as “badgers.” The 4th grade version of myself thought that was real impressive. I pictured strong, hard working men fiercely toiling away in the earth like mythical creatures, helping make Wisconsin what it is today.
It made for a great story.
Back to Reality
The reality and documentation of the times suggests something different. Most miners lived in cabins or other structures above ground. There most certainly were a few outliers on the fringe of mining society who burrowed their own holes or lived in abandoned underground mines, but the adult version of myself has a hard time imagining that the term used to describe such men – badgers – was used as a compliment.
Either way, the result is the same. Word spread and eventually Wisconsin became known as the Badger State. The state may be known worldwide for its cheese and agriculture, but there was mining in Wisconsin long before the first dairy cow. While the state was earning its nickname, mining was a prominent reason for the early success of the region.
Dairy Farming in WI
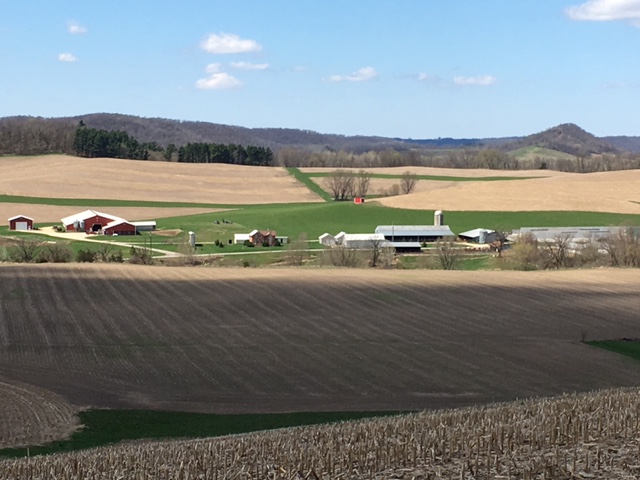
The 700 acre Jereczek Homestead Dairy in Dodge Township, Trempealeau County, Wisconsin first established in 1873 and now being operated by the 6th generation of Jereczeks.
Our farm is in Trempealeau County, Wisconsin – a driftless area – meaning the land was not covered by glaciers during the last ice age. The terrain is hilly and uneven, with tree-topped bluffs and hills overlooking valleys. The valleys, ranging from deep and narrow to wide and shallow, bump and flow into each other. Over the years, our farm has received its fair share of breaker rock, crushed rock, and gravel from the prevalent rock quarries. Sandstone deposits are huge and close to the surface. As a kid, there was a ledge in the cow pasture, where I hunted through chunks of sandstone for fossils.
As with everything else in the world, dairy farming continues to change. Most barns sit derelict and hold only memories of cows as they fade into the landscape. Small farms that clung to the valley walls have been sold to bigger operations, sit vacant, or have been built over. A lot of once prime farmland has been converted into houses with ridiculously large lawns. In 1990, Wisconsin had over 34,000 licensed dairy herds. Now there are just over 9,000.
We are the last dairy farm in our valley. Parallel to the trend, my childhood herd of 40 cows has turned to 200, which is about an average-sized herd. Margins are tighter than ever. Consistent help is hard to find. Milk prices are a terrible rollercoaster ride – it seems to take forever for them to go up, but when they fall, it’s fast and sickening. In the dairy business world, survival is a measure of success.
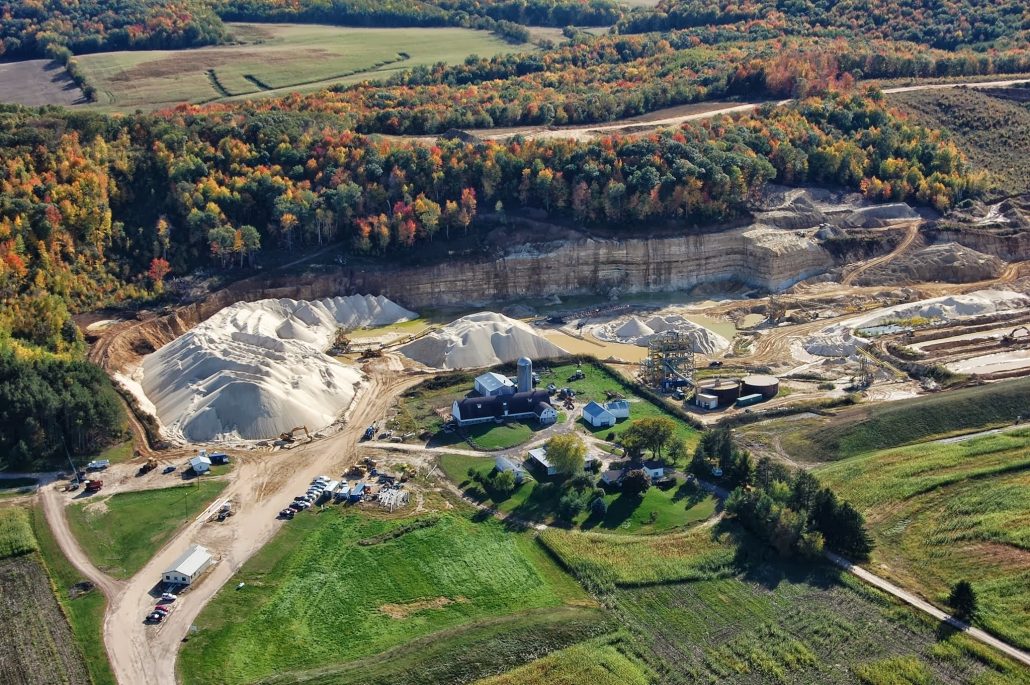
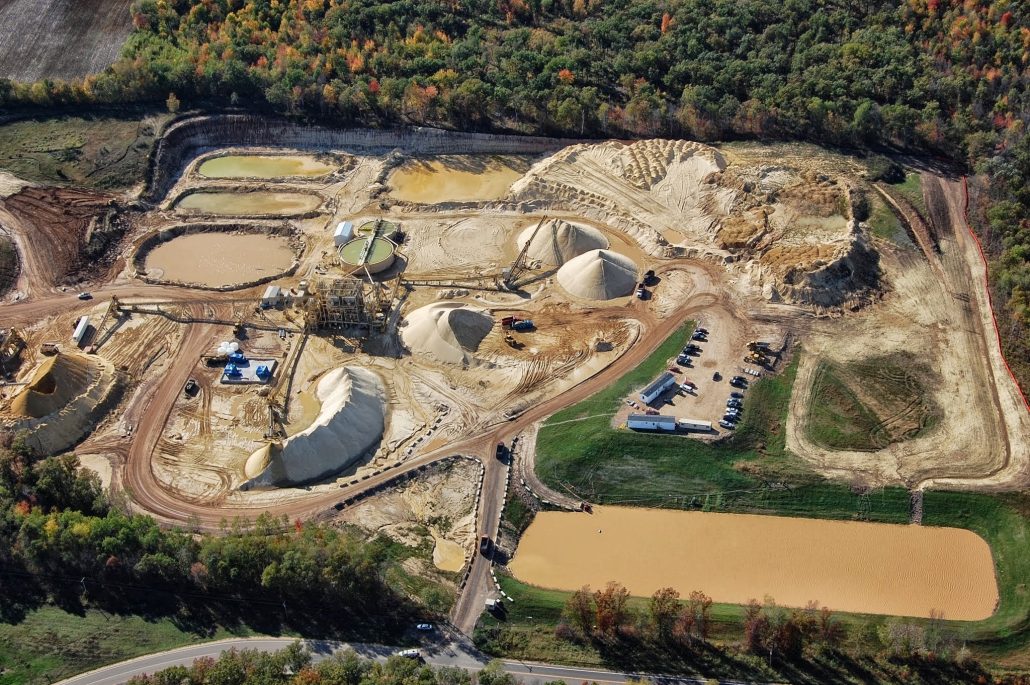
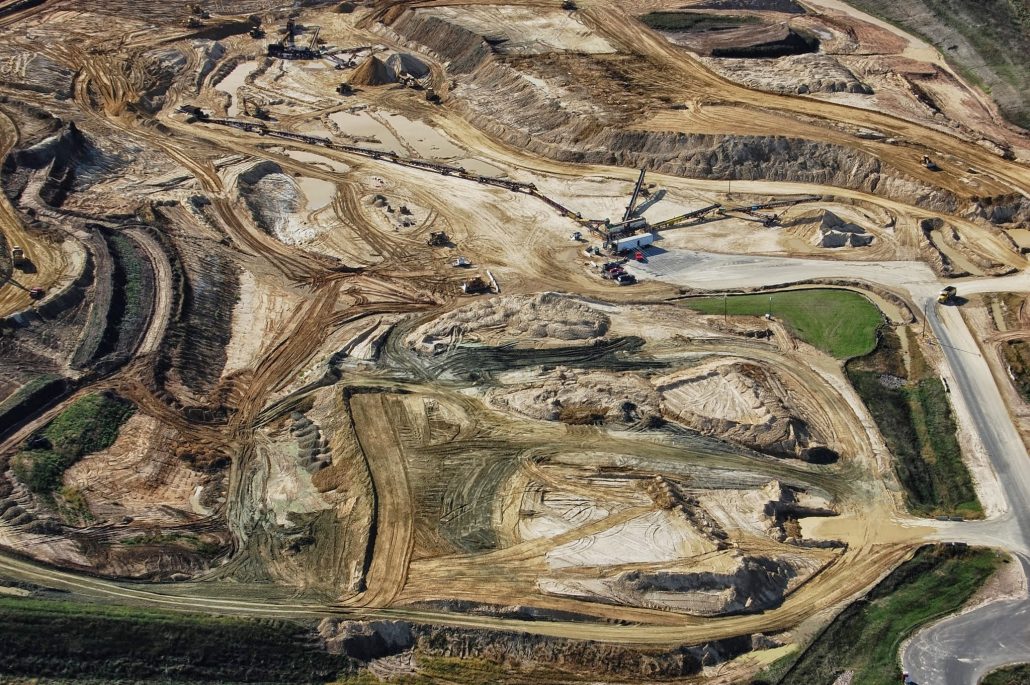
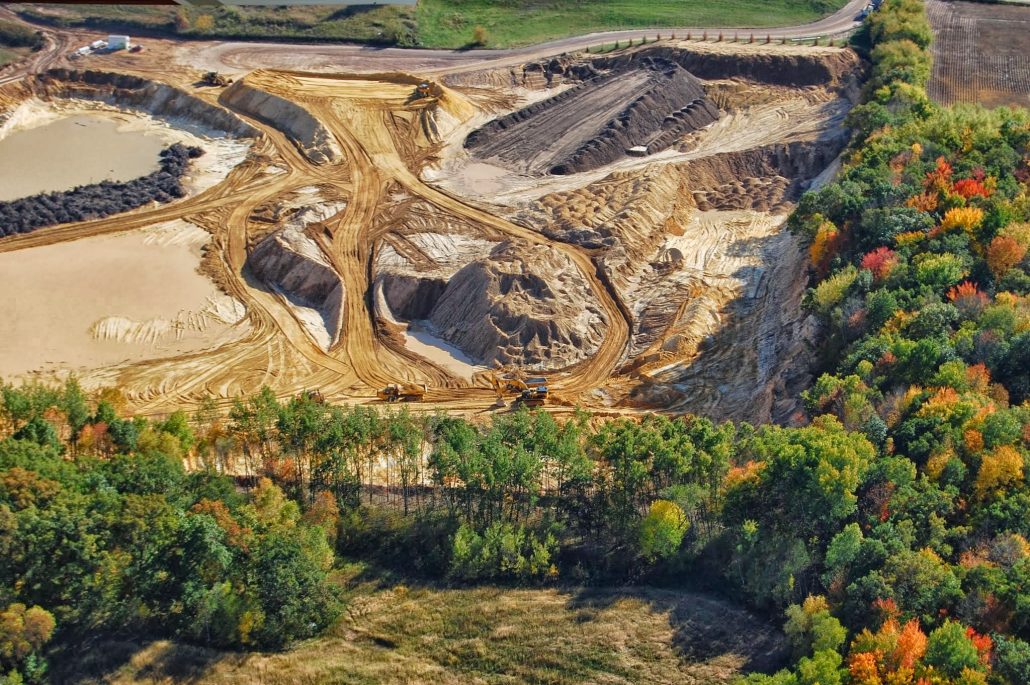
Frac Sand Mining Perceptions
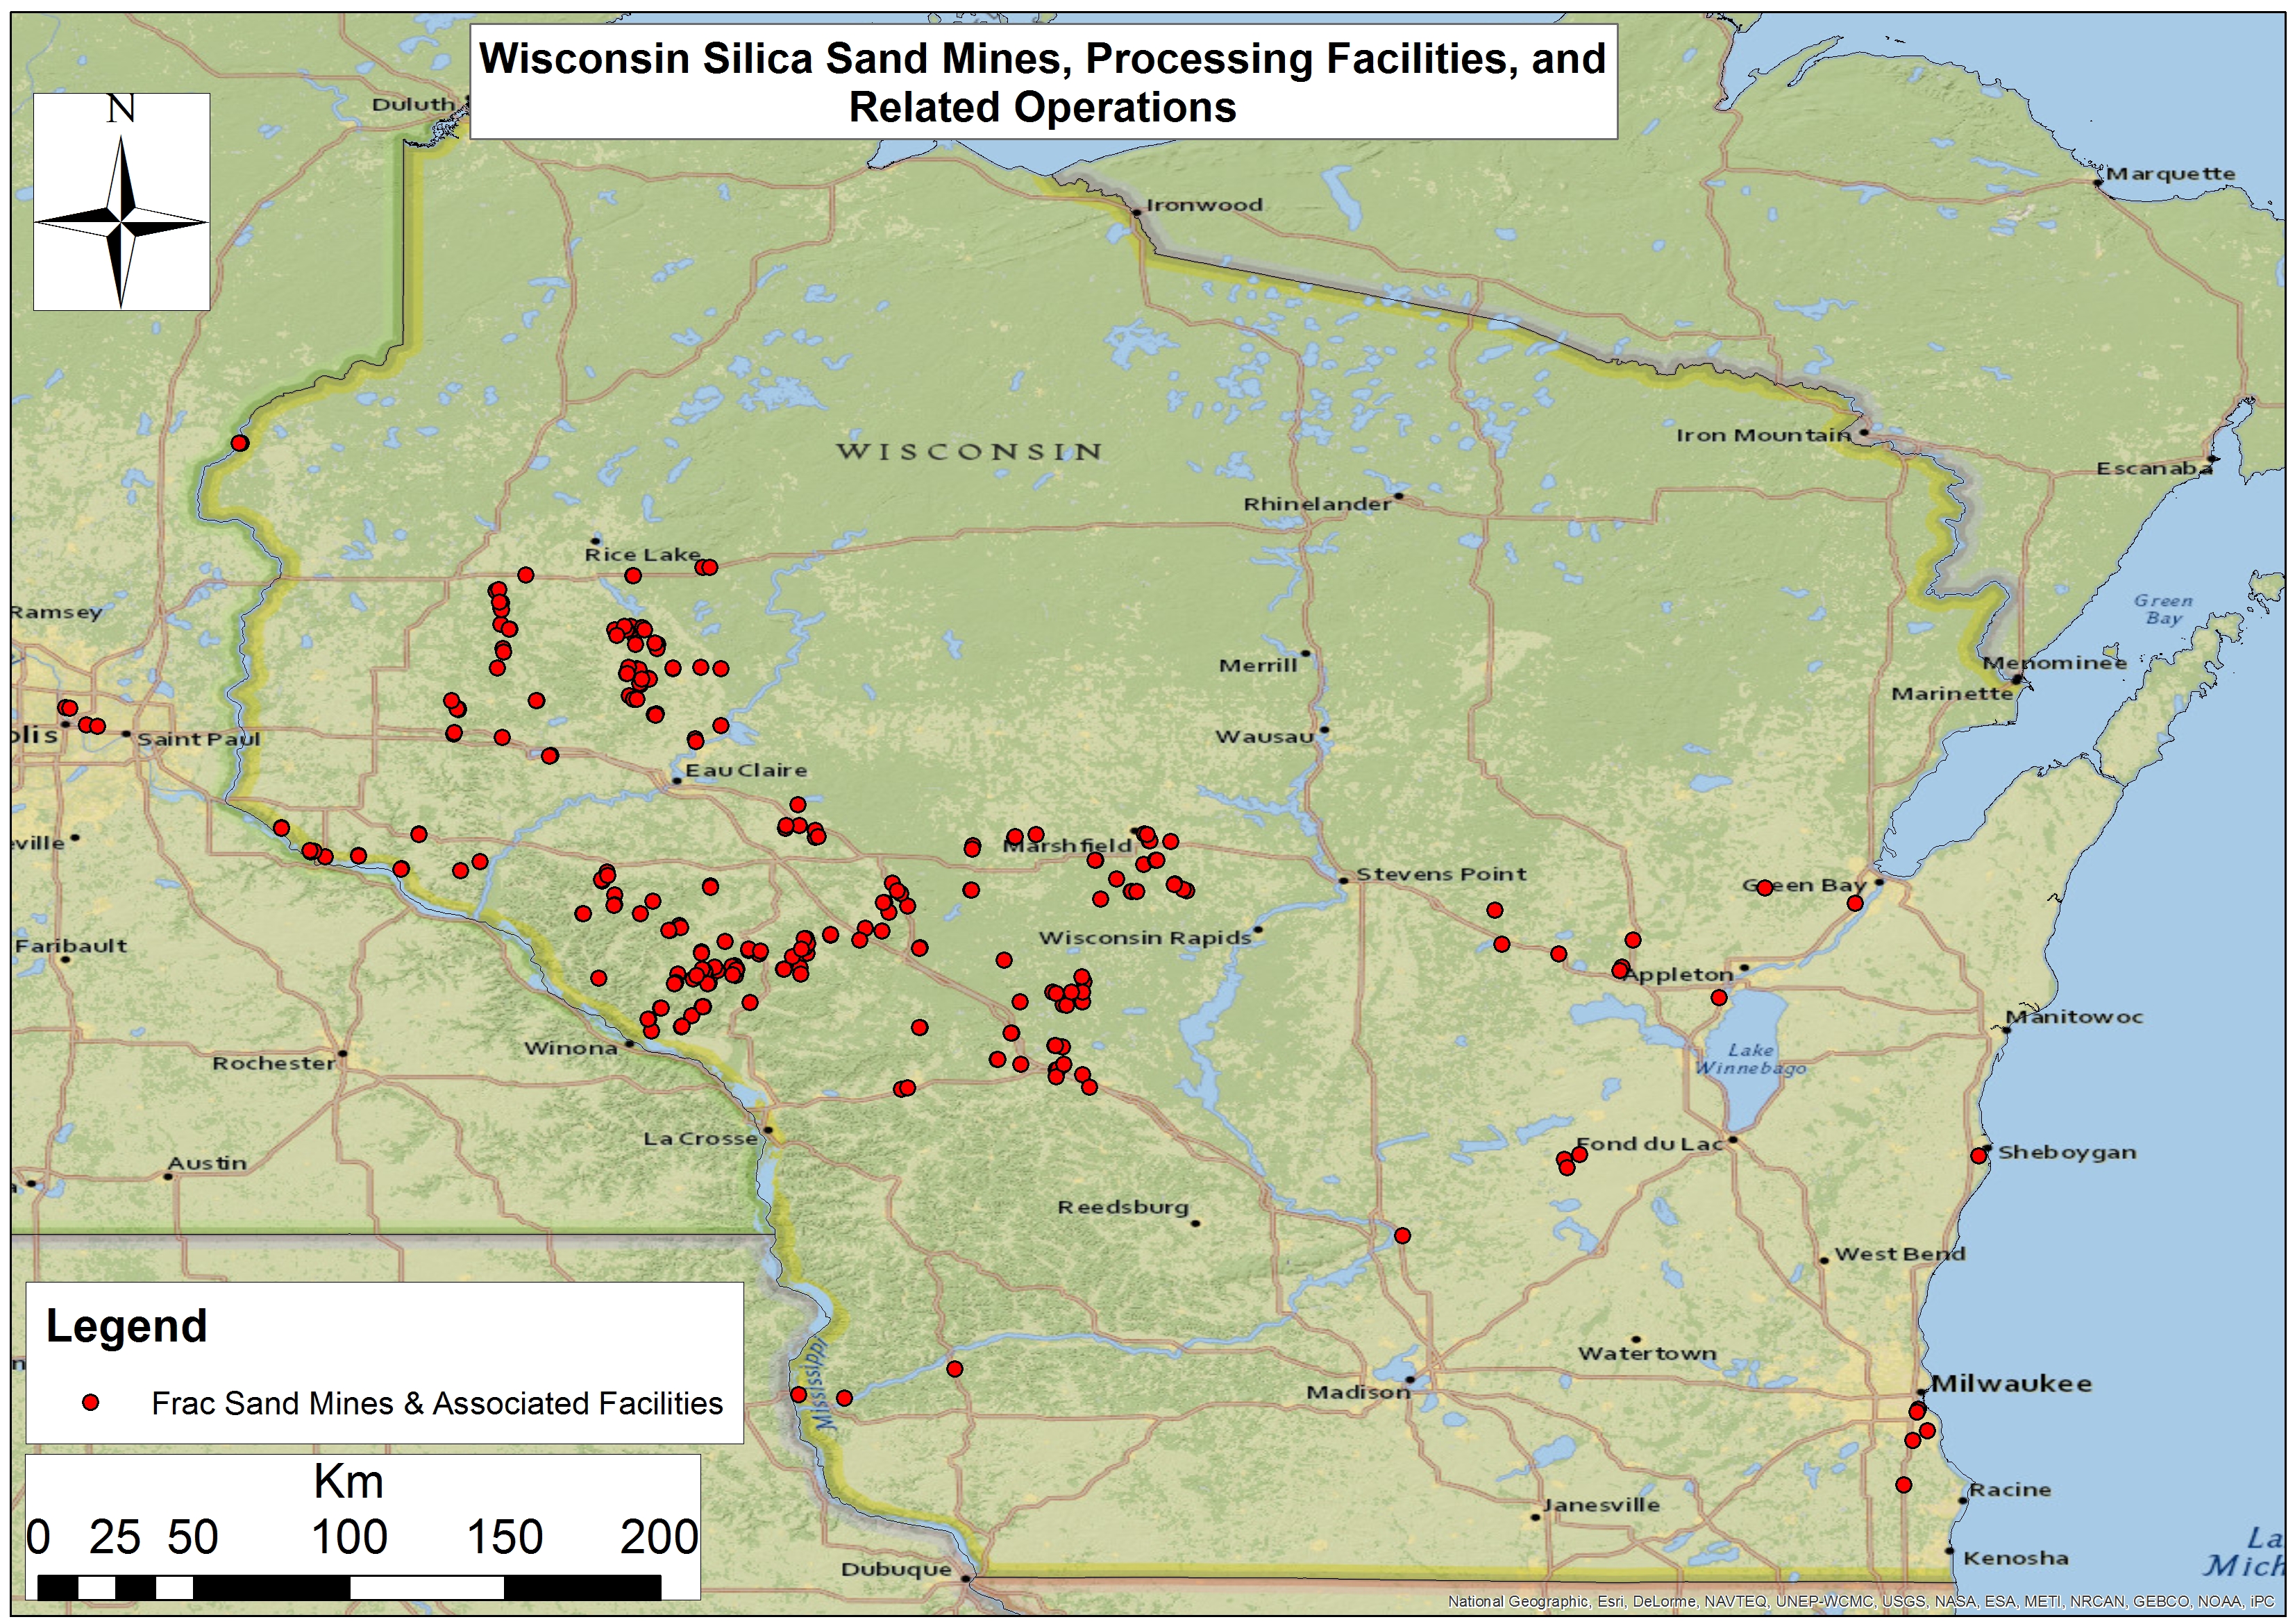
Wisconsin Frac Sand Mines, Processing Facilities, and Related Operations
The term frac sand is relatively new to me. I always assumed sand was sand and had given the word sand a negative connotation. Sand’s large particles don’t hold moisture or nutrients well, so sandy fields tend to perform poorly. But what if that sand has value for something else? What if there is a market for this sand much like a market for corn or soybeans?
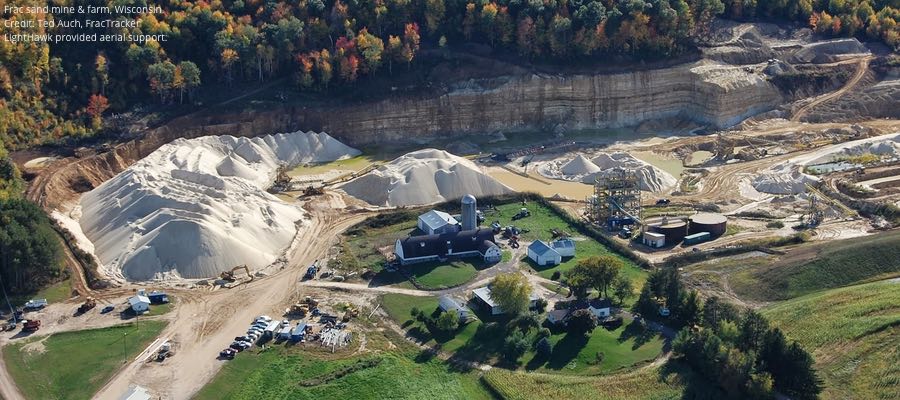
Farmers tend to be resourceful. Every asset is scrutinized and employed to the fullest. Every acre is pushed. But what about what may lie beneath the soil? Sand mining has been going on in Wisconsin for well over a hundred years, but the recent surge in fracking has created an enormous demand for frac sand – and there are many people and companies set to take advantage of the boom.
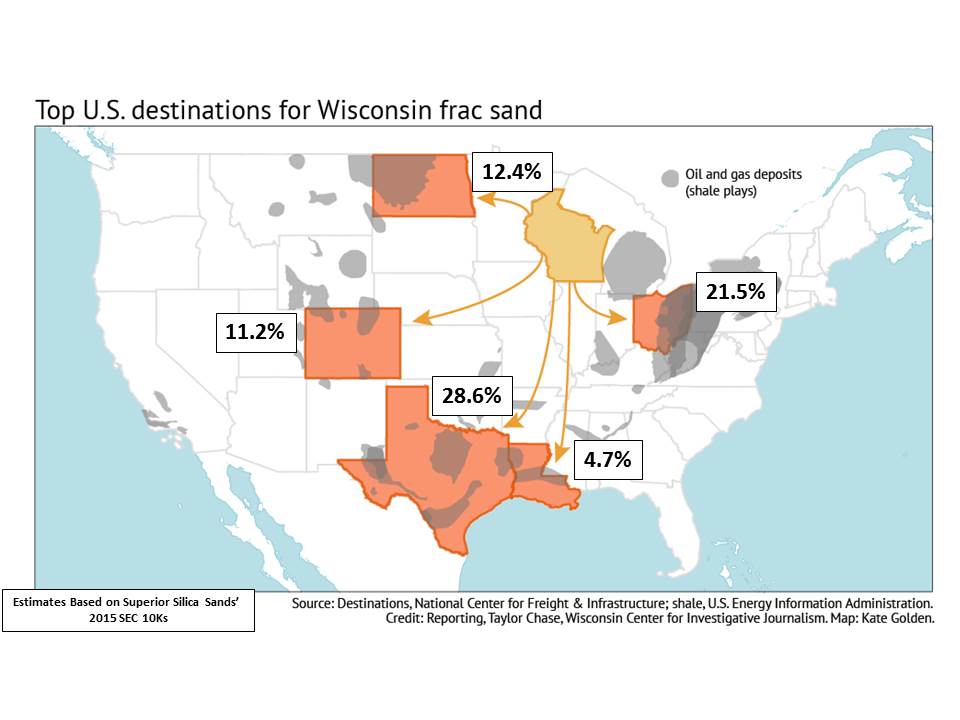
Top U.S. Destinations for Wisconsin’s Frac Sands Estimated from Superior Silica Sands’ 2015 SEC 10Ks
Trempealeau County has zoning and planning ordinances to protect its industries and way of life. These aggressive ordinances allow more citizen input than other county’s ordinances. Public hearings are required, and orderly processes are enforced. With the economics involved with frac sand mining, citizens got educated very quickly. Much like abortion or immigration, frac sand has become a polarizing subject. Strong emotions built up by personal ideologies have pushed this topic to a boiling point. The for and against groups trade barbs without much convincing being done on either side. Frac sand mining editorials are common in local papers with those against appearing to be the most vocal and emotional.
New Player, New Approach
One such editorial detailed the approach a sand company took to obtaining a property. A local farmer had a sand mine company representative approach him with an oversized check written out to him for a sizable amount of money for his land. It was as though the sand rep was taking a page out of the Publishers Clearing House’s playbook. The farmer turned down the check. The sand rep left and returned a short time later with a significantly larger offer. The farmer was equally surprised and insulted. He found out later a few neighbors turned down similar proposals.
So what’s the deal with such a brazen approach? Intentions from this company may well have been good. Many people believed the sand mines were a win-win opportunity. Companies were selling hype – there was no way for anything but success. Extreme optimism. Sand mines were going to increase the tax base, fund schools and roads. Concerns were minimized, and residents were told what they wanted to hear. Such talk produced plenty of skeptics.
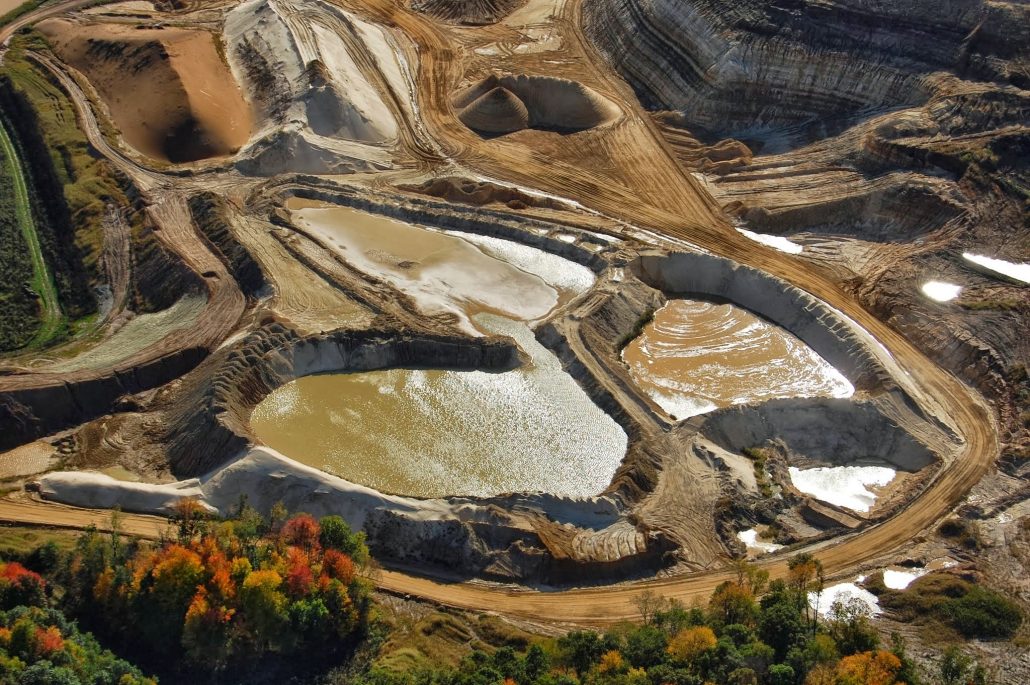
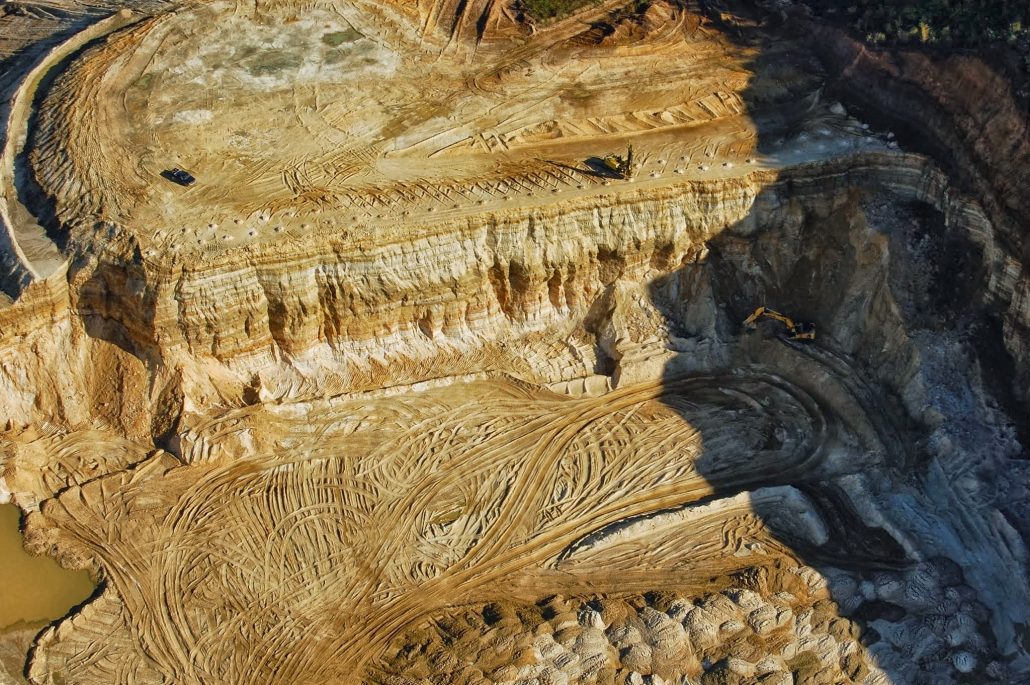
Environmental Costs of Frac Sand Mining
With both dairying and fracking, there is an environmental cost. Whether you milk 10, 100, or 1,000 cows – there are environmental pressures. With sand mining, the environmental effects are well documented. It is important, if not just practical, to measure these with the fiscal rewards. And where does this money go and who benefits the most? But, most importantly, who must deal with the consequences?
The risks of sand mines can be mitigated if proper regulations are taken seriously. With the extra scrutiny, a magnifying glass was placed over the sand mines, and what was found only proved the skeptics right. Trapping or pooling storm water seemed to be a learning process for sand mine companies; reported in 2012, every operating sand mine in Trempealeau County had storm water runoff violations. In 2014, over half of the sand mines in all of Wisconsin had violated environmental regulations imposed by the Department of Natural Resources. Add to this loss of surrounding property values, damage to roads, and a damper on quality of life – and you’ll create a substantial amount of public backlash.
As was mentioned earlier, mining Is not new to the state. There are many multi-generational mining companies who have the experience, tradition, and financial network to abide by current standards and environmental regulations. Nobody likes to be told what to do. No industry is out there begging for more regulations. Often, the rules are in place to protect – not hinder – those that use environmentally safe and humane practices. Dairying has its own unique regulations – some are good, some not so much, and some downright stupid. Yet, overall it can be argued that these regulations protect the industry and the environment.
One heated topic in the dairy industry involves the sale of raw (unpasteurized) milk. It is illegal for any dairy in the state to sell raw milk. I have been drinking raw milk straight from the bulk tank since before I can remember. Our whole family did. Now, I still drink it and so do all my children from the age of a year and a half on up. None of us has ever had trouble with it. However, I am in complete agreement that the sale of raw milk should be illegal. All it takes is for one child to get terribly sick (which most certainly would happen) and for that kid lying on a hospital bed being blasted by every news network in the nation. These images create strong negative emotions that reverberate throughout society. The potential costs far outweigh the economic benefits from such a sale. Sure, some people are upset, but the greater good is maintained by taking away a risky practice.
The same principle works for mining. Rules and regulations get negative press and reaction, but who stands to lose the most from environmental catastrophes related to mining – the company in business 90-some years or the startup mining ventures trying to capture lightning in a bottle? Some companies have built years of trust and compatibility and support for their local communities. These are businesses that will remain after the sand rush has fizzled.
Booms and Busts, Ups and Downs
The frac sand industry is going through the same economic cycle as the dairy industry. The sand companies are getting better at what they do and increase their production capacity. Like milk, sand is a commodity. As the price of sand decreased, production increased to maintain profits. The dairy industry does the same thing, by expanding and improving efficiency to get more milk to catch those dollars slipping away. However, when the market is flush with milk or bombed with sand, they’re just doing more damage to themselves. This is a simplified take on the industry, as there are many global factors that come into play, but the overall pattern tends to remain. As the dairy industry can attest, this fluctuating cycle is not sustainable for all producers.
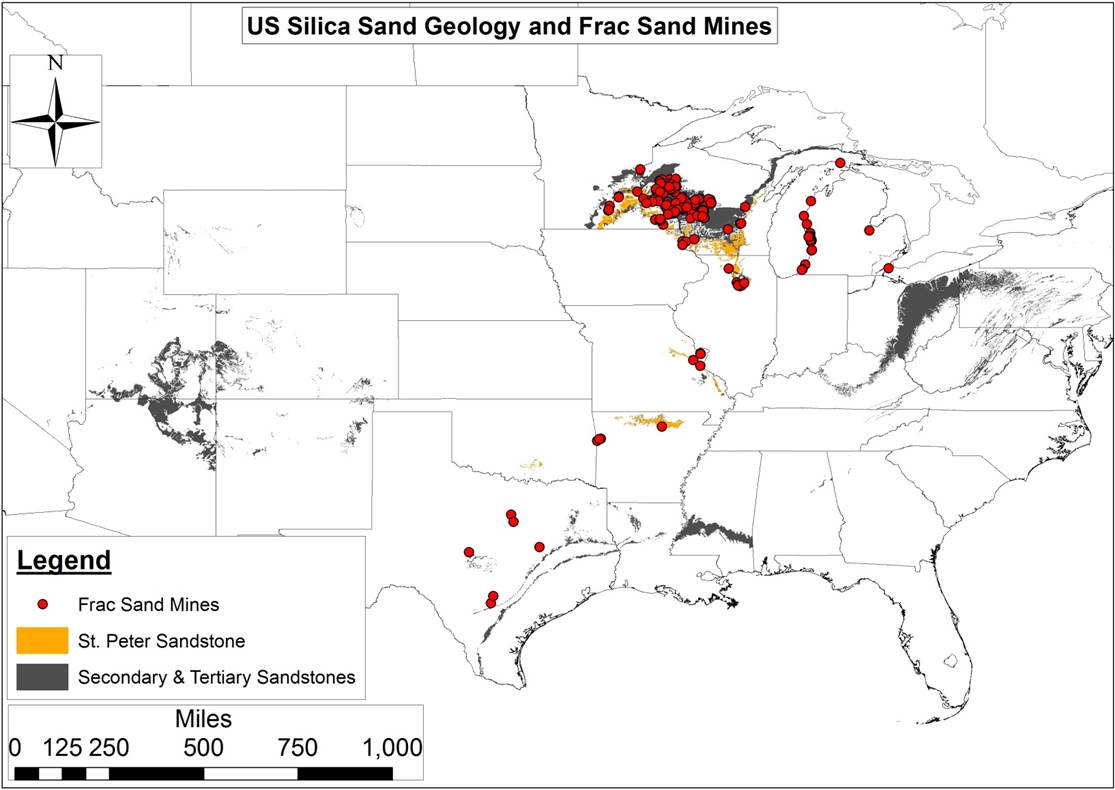
Primary and Secondary US Silica Sand Geologies and Existing Frac Sand Mines
Worse yet for the sand industry, this cycle has occurred in hyper speed. At first, just the small mines cut production. Outcompeted by larger operations, production at smaller mines was no longer profitable. Soon, the larger mines cut production due to the weakening demand. Many mines in the permit or early production phases never got started. Unlike the dairy industry, there was no rollercoaster effect because prices have yet to return to prior levels. The bubble, it seems, had popped.
With any kind of new mine developed comes the environmental impacts. Yet, I find the fervent negative reaction to such practices directly related to the end result. Fracking. Fracking isn’t magic. They’re not just mixing water with this sand and forcing oil and gas out of the ground. Harmful chemicals are being added to the mix. Worst yet, the quantity and potency of such chemicals is kept secret, closely guarded from the public. Harmful chemicals are being legally pumped into the ground. All the short-term gains will have long-term consequences. This is where I believe a significant backlash for new mines comes from. The end result. Can you imagine what the public’s perception of dairy farms would be if milk was mixed with chemicals and pumped into the ground?
The Future of Dairy Farming in Wisconsin
The 2016 presidential election has breathed some life into the frac sand industry. The new president promises to cut regulations interfering with business, and thus far has kept those promises. The environment will not be a detriment to his goals. Sand companies are returning with ads in the local papers, looking for qualified applicants and offering great salaries. In contrast, the dairy industry is stuck in a rollercoaster spiral. Milk prices have been too low for far too long. The dairy dispersal continues with some very good cows being sold and very good dairymen and women calling it quits. Naturally, some land will be sold. To what end remains to be seen. But it is a safe bet, the frac sand mining ride has not ended.
https://www.fractracker.org/a5ej20sjfwe/wp-content/uploads/2017/04/Frac-sand-mine-WI-Feature.jpg400900Guest Authorhttps://www.fractracker.org/a5ej20sjfwe/wp-content/uploads/2021/04/2021-FracTracker-logo-horizontal.pngGuest Author2017-04-19 16:22:422021-04-15 15:03:09Fracking in Dairy Country
In March 2017, FracTracker Alliance conducted a review of the available Pennsylvania oil and gas fine data released publicly by the PA Department of Environmental Protection (DEP) to identify trends in industry-related fines over time and by particular operators. In total, the DEP has assessed nearly $36 million in fines to oil and gas extraction and pipeline operators since January 1, 2000. Such fines are associated with over 42,000 violations issued1 by DEP in that time frame, covering 204,000 known oil and gas locations,2 as well as 91,000 miles of pipelines3 within the Commonwealth.
Understanding the Data Structure
The amount of money that the Pennsylvania Department of Environmental Protection (DEP) fines oil and gas (O&G) operations is included in the DEP’s compliance report published on their website. Even though fines data are made available, they are not necessarily straight-forward, and caution must be taken not to over-estimate the total number of assessed fines.
Records of fines are associated with enforcement identification codes on the compliance report. A single fine is often applied to numerous violations, and the full amount of the fine is listed on every record in this subset. Therefore, the total dollar amount of fines assessed to O&G companies appears overstated. For example, if a $400,000 fine were assessed to settle a group of 10 violations, that figure will appear on the report 10 times, for an apparent aggregate of $4,000,000 in fines. To get an accurate representation of fines assessed, we need to isolate fines associated with particular enforcement ID numbers, which are used administratively to resolve the fines.
This process is further complicated by the fact that, on occasion, such enforcement ID numbers are associated with more than one operator. This issue could result from a change in the well’s operator (or a change of the operator’s name), a group of wells in close proximity that are run by different operators, or it might point to an energy extraction company and a midstream company sharing responsibility for an incident. Sometimes, the second operator listed under an enforcement ID is in fact “not assigned.” The result is that we cannot first summarize by operator and then aggregate those subtotals without overstating the total amount of the assessed fines. In all, 62 of the enforcement ID numbers apply to more than one operator, but this figure amounts to less than one percent of the nearly 15,000 distinct enforcement ID numbers issued by DEP.
Conventional & Unconventional Violations & Fines
Oil and gas wells in Pennsylvania are categorized as either conventional or unconventional, with the latter category intended to represent the modern, industrial-scaled operations that are commonly referred to as “fracking wells.” Contrastingly, conventional wells are supposed to be the more traditional O&G wells that have been present in Pennsylvania since 1859. The actual definition of these wells leaves some blurring of this distinction, however, as almost all O&G wells now drilled in Pennsylvania are stimulated with hydraulic fracturing to some degree, and some of the conventional wells are even drilled horizontally – just not into formations that are technically defined as unconventional. For the most part, however, unconventional remains a useful distinction indicating the significant scale of operations.
Table 1. Summary of oil and gas wells, violations, and fines in Pennsylvania
Category
Conventional
Unconventional
(blank)
Total
Wells
193,655
10,291
0
203,946
Violations
27,223
6,126
9,026
42,375
Fines
$7,000,203
$13,689,032
$21,563,722
$35,949,495*
Fines per Violation
257
2,235
2,389
848
Fines per Well
36
1330
–
176.27
Violations per Well
0.14
0.60
–
0.21
Wells per Violation
7.11
1.68
–
4.81
* The total fine amount issued is not a summary of the three preceding categories, as some of the fines appear in multiple categories
Ninety-five (95)% of the state’s 204,000 O&G wells are classified as conventional, so it should not be surprising to see that this category of wells accounts for a majority of violations issued by the department. However, fines associated with these violations are less frequent, and often less harsh; the $7 million in fines for this category accounts for only 19% of the total assessed penalties. In contrast, the total penalties that have been assessed to unconventional wells in the state are nearly twice that of conventional wells, despite accounting for just 5% of the state’s well inventory
On the 54,412 records on the compliance report, 10,518 (19%) do not indicate whether or not it is an unconventional well. The list of operators includes some well-known conventional and unconventional drilling operators, and hundreds of names of individuals or organizations where O&G drilling is not their primary mode of business (such as municipal authorities and funeral homes). This category also contains violations for midstream operations, such as pipelines and compressor stations. Altogether, 3,795 operators have entries that were not categorized as either conventional or unconventional on the compliance report, and 124 of these operators were issued fines. One additional complication is that some of the violations and fines that fall into this category are cross-referenced in the conventional and unconventional categories, as well.
The resulting impact of these factors is that the blank category obscures the trends for violations and fines in the other two categories. While tempting to reclassify well data in this category as either conventional or unconventional, this would be a tall task due to the sheer number of records involved, and would likely result in a significant amount of errors. Therefore, the FracTracker Alliance has decided to present the data as is, along with an understanding of the complexities involved.
Most Heavily Fined Operators
Despite the numerous caveats listed above, we can get a clear look at the aggregated fines issued to the various O&G operators in the state by constructing our queries carefully. Table 2 shows the top 12 recipients of O&G-related fines assessed by DEP since 2000. Ten of these companies are on the extraction side of the business, and the total number of well permits issued4 to these companies since 2000 are included on the table. By looking at the permits instead of the drilled wells, we discover the operator that was originally associated with the drilling location, whereas the report of drilled wells associates the current operator associated with the site, or most recent operator in the event that the location is plugged and abandoned.
Stonehenge Appalachia and Williams Field Services operate in the midstream sector. Combining the various business name iterations and subsidiaries would be an enormous task, which we did not undertake here, with the exception of those near the top of the list. This includes Vantage Energy Appalachia, which was combined with records from Vantage Energy Appalachia II, and the compliance history of Rice Energy is the sum of three subsidiaries, the drilling company Rice Drilling B, and two pipeline companies, Rice Midstream Holdings and Rice Poseidon Midstream.
Table 2. Top 12 operators that have been assessed oil and gas-related fines by DEP since 2000
Operator
Total Fines
Conventional Permits
Unconventional Permits
Violations
Fines / Violation
Fines / Permit
Range Resources Appalachia LLC
$5,717,994
2,104
2,206
819
$6,982
$1,327
Chesapeake Appalachia LLC
$3,120,123
18
3,072
754
$4,138
$1,010
Rice Energy*
$2,336,552
442
165
$14,161
$5,286
Alpha Shale Res LP
$1,681,725
3
62
31
$54,249
$25,873
Stonehenge Appalachia LLC
$1,500,000
–
–
294
$5,102
–
Cabot Oil & Gas Corp
$1,407,275
19
902
726
$1,938
$1,528
CNX Gas Co LLC
$1,274,330
1,613
677
387
$3,293
$556
WPX Energy Appalachia LLC
$1,232,500
347
159
$7,752
$3,552
Chevron Appalachia LLC
$1,077,553
2
604
113
$9,536
$1,778
Vantage Energy Appalachia LLC**
$1,059,766
3
300
35
$30,279
$3,498
Williams Field Services Co, LLC
$872,404
–
–
158
$5,522
–
XTO Energy Inc
$739,712
1,962
461
383
$1,931
305
* Fines for Rice Energy here represent the sum of three subsidiaries, the drilling company Rice Drilling B, and two pipeline companies, Rice Midstream Holdings and Rice Poseidon Midstream.
** Fines for Vantage Energy Appalachia were combined with records from Vantage Energy Appalachia II.
Predictably, many of the entries on this list are among the most active drillers in the state, including Range Resources and Chesapeake Appalachia. However, Alpha Shale Resources has the dubious distinction of leading the pack with the highest amount of fines per violation, as well as the highest amount of fines per permit. Fitting in with the theme, the story here is complicated by the fact that Alpha had a joint venture with Rice, before selling them their stake in a group of wells and midstream operations that were fined $3.5 million by DEP.5 On this compliance report, the fines from this incident are split between the two companies.
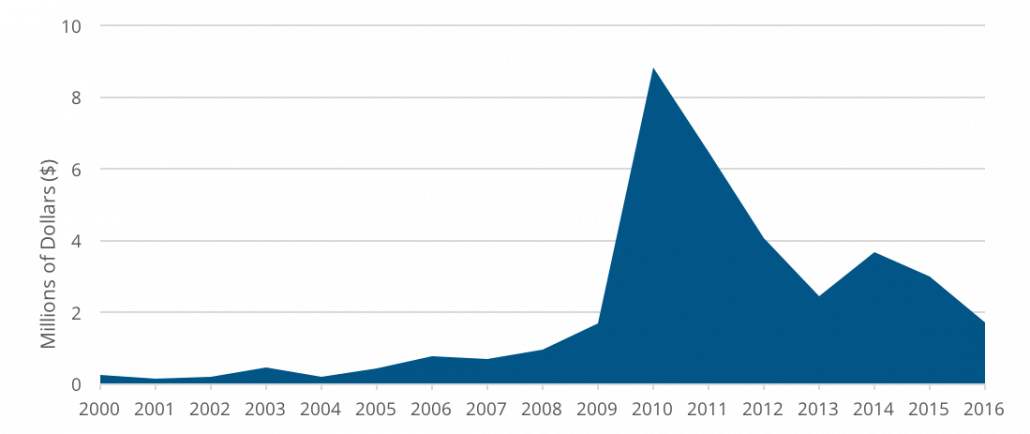
Fines Issued Over Time
It is worth taking a look at how O&G related fines have varied over time, as well (Figure 1, shown in millions of dollars). Numerous factors could contribute to changes in trends, such as the number of available DEP inspectors,6 the amount of attention being paid to the industry in the media, differing compliance strategies employed by various political administrations, or changes in practices in the field, which could in turn be impacted by significant fines issued in the past.
Figure 1. O&G Fines Issued by DEP, 2000 through 2016
The notable spike in fines issued from 2010 to 2012 corresponds with the peak of unconventional drilling in the state – 4,908 of these industrial scaled wells were drilled during those three years, amounting to 48% of all unconventional wells in PA. In contrast, only 504 unconventional wells were drilled in 2016, or around a quarter of the total for 2011. In this context, the reduction in fines since the early part of the decade seems reasonable.
The association with the number of unconventional wells falls apart a bit in the years 2013 to 2014, however. These two years saw an average of 1,293 unconventional wells drilled, but the fines issued amounted to only 35% of the 2011 total.
Considerable strides have been made in the public accessibility of oil and gas data available from the PA DEP since FracTracker started requesting and reviewing this information in 2009. Still, there are many gaps in the datasets, such as geolocation details for 10 of the 20 largest fines issued by the department. FracTracker hopes external analyses like this one will help to close such gaps and identify operators who, too, need to improve their compliance records.
Pipelines are hailed as the “safest” way to transport crude oil and other refinery products, but federal and state data show that pipeline incidents are common and present major environmental and human health hazards. In light of current events that have green-lighted multiple new pipeline projects, including several that had been previously denied because of the environmental risk they pose, FracTracker Alliance is continuing to focus on pipeline issues.
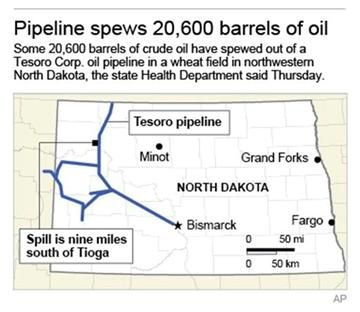
In this article we look at the record of oil spills, particularly those resulting from pipeline incidents that have occurred in North Dakota, in order to determine the risk presented by the soon-to-be completed Dakota Access Pipeline.
Standing Rock & the DAPL Protest
To give readers a little history on this pipeline, demonstrators in North Dakota, as well as across the country, have been protesting a section of the Dakota Access Pipeline (DAPL) near the Standing Rock Sioux Tribe’s lands since April 2016. The tribe’s momentum has shifted the focus from protests at the build site to legal battles and a march on Washington DC. The pipeline section they are protesting has at this point been largely finished, and is slated to begin pumping oil by April 2017. This final section of pipe crosses under Lake Oahe, a large reservoir created on the Missouri River, just 1.5 miles north of the Standing Rock Sioux Tribal Lands. The tribe has condemned the pipeline because it cuts through sacred land and threatens their environmental and economic well-being by putting their only source for drinking water in jeopardy.
Pipelines
… supposedly safest form of transporting fossil fuels, but …
However, what makes one form of land transport safer than the others is dependent on which factor is being taken into account. When considering the costs of human death and property destruction, pipelines are indeed the safest form of land transportation. However, for the amount of oil spilled, pipelines are second-worst, beaten only by trucks. Now, when it comes to environmental impact, pipelines are the worst.
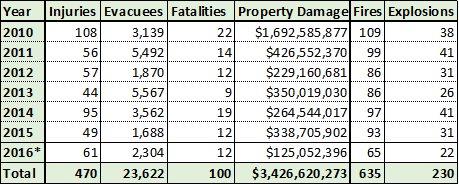
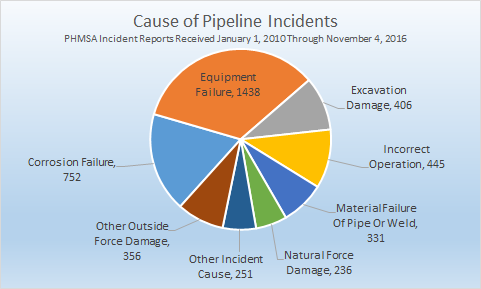
What is not debatable is the fact that pipelines are dangerous, regardless of factor. Between 2010 and October 2016 there was an average of 1.7 pipeline incidents per day across the U.S. according to data from the Pipeline and Hazardous Materials Safety Administration (PHMSA). These incidents have resulted in 100 reported fatalities, 470 injuries, and over $3.4 billion in property damage. More than half of these incidents were caused by equipment failure and corrosion (See Figures 1 and 2).
Figure 1. Impacts of pipeline incidents in the US. Data collected from PHMSA on November 4th, 2016 (data through September 2016). Original Analysis
Figure 2. Cause of pipeline incidents for all reports received from January 1, 2010 through November 4, 2016. Original Analysis
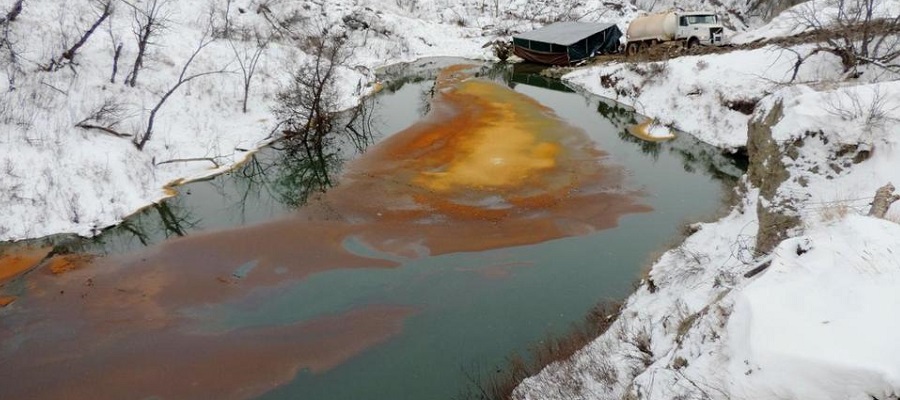
Recent Spills in North Dakota
To dig into the risks posed in North Dakota more specifically, let’s take a look at some spill data in the state.
Map 1. Locations of Spills in North Dakota, with volume represented by size of markers
In North Dakota alone there have been 774 oil spill incidents between 2010 and September 2016, spilling an average of 5,131 gallons of oil per incident. The largest spill in North Dakota in recent history, and one of the largest onshore oil spills in the U.S., took place in September 2013. Over 865,000 gallons of crude oil spilled into a wheat field and contaminated about 13 acres. The spill was discovered several days later by the farmer who owns the field, and was not detected by remote monitors. The state claims that no water sources were contaminated and no wildlife were hurt. However, over three years of constant work later, only about one third of the spill has been recovered.
Below we have analyzed available spill data for North Dakota, including the location and quantity of such incidents.
North Dakota saw an average of 111 crude oil spills per year, or a total of 774 spills from 2010 to October 2016. The greatest number of spills occurred in 2014 with a total of 163. But 2013 had the largest spill with 865,200 gallons and also the highest total volume of oil spilled in one year of 1.3 million gallons. (Table 1)
Table 1. Data on all spills from 2010 through October 2016. Data taken from PHMSA and North Dakota.
2010
2011
2012
2013
2014
2015
Jan-Oct 2016
Number of Spills
55
80
77
126
163
117
156
Total Volume (gallons)
332,443
467,544
424,168
1,316,910
642,521
615,695
171,888
Ave. Volume/Spill (gallons)
6,044
5,844
5,509
10,452
3,942
5,262
1,102
Largest Spill (gallons)
158,928
106,050
58,758
865,200
33,600
105,000
64,863
The total volume of oil spilled from 2010 to October 2016 was nearly 4 million gallons, about 2.4 million of which was not contained. Most spills took place at wellheads, but the largest spills occurred along pipelines. (Table 2)
Table 2. Spills by Source. Data taken from PHMSA and North Dakota.
Wellhead
Vehicle Accident
Storage
Pipeline
Equipment
Uncontained
All Spills
Number of Spills
694
1
12
54
13
364
774
Total Volume (gallons)
2,603,652
84
17,010
1,281,798
68,623
2,394,591
3,971,169
Ave. Volume/Spill (gallons)
3,752
84
1,418
23,737
5,279
6,579
5,131
Largest Spill (gallons)
106,050
84
10,416
865,200
64,863
865,200
865,200
A. Sensitive Areas Impacted
5,875 square miles
Total Affected Areas (408 linear miles)
Spills that were not contained could potentially affect sensitive lands and waterways in North Dakota. Sensitive areas include Native American Reservations, waterways, drinking water aquifers, parks and wildlife habitat, and cities. Uncontained spill areas overlapped, and potentially contaminated, 5,875 square miles of land and water, and 408 miles of streams.
Drinking Water Aquifers – 2,482.3 total square miles:
Non-Community Aquifer – 0.3 square miles
Community Aquifer – 36 square miles of hydrologically connected aquifer
Surficial Aquifer – 2,446 square miles of hydrologically connected aquifer
A large area of potential drinking water (surficial aquifers) are at risk of contamination. Of the aquifers that are in use, aquifers for community use have larger areas that are potentially contaminated than those for non-community use.
Native American Tribal Reservation
Fort Berthold, an area of 1,569 square miles
Cities – 67 total square miles
Berthold
Dickinson
Flaxton
Harwood
Minot
Petersburg
Spring Brook
Stanley
West Fargo
Map 2. Areas where Oil Spills Present Public Health Threats
Floodplains – 73 square miles of interconnected floodplains
Streams – 408 miles of interconnected streams
Of the 364 oil spills that have occurred since 2010, 229 (63%) were within 1/4 mile of a waterway
Of the 61 Uncontained Brine Spills that have occurred since 2001, 38 (63%) were within 1/4 mile of a waterway.
If a spill occurs in a floodplain during or before a flood and is uncontained, the flood waters could disperse the oil over a much larger area. Similarly, contaminated streams can carry oil into larger rivers and lakes. Explore Map 3 for more detail.
Using ArcGIS software, uncontained spill locations were overlaid on spatial datasets of floodplains, stream beds, groundwater regions, sensitive habitats, and other sensitive regions.
The average extent (distance) spilled oil traveled from uncontained spill sites was calculated to 400 meters. This distance was used as a buffer to approximate contact of waterways, floodplains, drinking water resources, habitat, etc. with uncontained oil spills.
https://www.fractracker.org/a5ej20sjfwe/wp-content/uploads/2017/04/OilSpill_12.16_crop.jpg400900Kyle Ferrar, MPHhttps://www.fractracker.org/a5ej20sjfwe/wp-content/uploads/2021/04/2021-FracTracker-logo-horizontal.pngKyle Ferrar, MPH2017-04-11 16:15:232021-04-15 15:03:11Oil Spills in North Dakota: What does DAPL mean for North Dakota’s future?
The Pennsylvania Department of Environmental Protection (DEP) will be hosting a nine-stop “listening tour” to hear residents’ perspectives on environmental justice (EJ). These sessions begin in the western part of the state on April 12th and 13th. The complete list of dates and locations of these meetings can be found here. The DEP will also be accepting written comments, which can be either mailed or emailed to DEP-OEJ@pa.gov.
The EJ listening tour follows on the heels of events in May 2016, when environmental advocacy groups questioned the well pad siting practices of oil and gas drilling company Range Resources, causing the DEP to announce it would revisit its EJ policies. Such changes would include reassessing how EJ zones are designated and what kinds of development triggers additional scrutiny by the DEP’s Office of Environmental Justice. We wrote about this story, and detailed how present EJ rules fail to account for oil and gas development in June 2016.
The following guide is meant to provide helpful information to residents in preparing for the listening tour. We first offer a summary of PA’s present EJ policies, followed by a commentary on what gaps we believe exist in those policies, and conclude with some reflections on EJ policies in other U.S. states and what we might learn from them in reassessing our own state’s EJ laws.
Listening Sessions Format
Each environmental justice listening tour will include opening remarks from Acting Secretary McDonnell, followed by a brief presentation from the Office of Environmental Justice, and then will open to receive testimony from the public. Verbal testimony is limited to 3 minutes for each witness. Organizations are asked to designate one witness to present testimony on their behalf. Verbal comments will be recorded by a court stenographer, and transcripts will be made available to the public at a later date.
The DEP Office of Environmental Justice has offered a set of eight questions to guide comments in the listening tour sessions. They are as follows:
What environmental justice concerns are most pressing in your community?
Do you feel that the current definition of an environmental justice community (20% poverty and/or 30% minority) properly represents the needs of your community and the Commonwealth at large?
Do you feel the DEP is engaged with marginalized communities to ensure that they have a voice in the decision making process? How can the DEP be more engaged with these communities?
What tools have you used to find out information on DEP permitting/enforcement actions?
What ways can the DEP be more effective at sharing information with the public?
How can the DEP be more effective at receiving public input?
What resource(s) is your community lacking that the DEP can provide that would assist in efforts to ensure environmental equity?
What additional steps can be taken by the Department to effectively reach out to these vulnerable communities to ensure that their concerns are taken into consideration?
Summary of Existing EJ Policies
According to the U.S. Environmental Protection Agency, environmental justice is “the fair treatment and meaningful involvement of all people regardless of race, color, national origin, or income with respect to the development, implementation, and enforcement of environmental laws, regulations, and policies.” This same definition is used by the DEP.
In 2004, the DEP codified this EJ definition in the Environmental Justice Public Participation Policy. EJ designations are defined by the DEP as any census tract where 20% or more of the population lives in poverty and/or 30% or more of the population identifies as a minority. Designations are based on the U.S. Census Bureau and by the federal poverty guidelines.
Below is a map of current EJ designated census tracts in PA that also shows the counties where listening tour sessions will be held. When zoomed in to regional scale, EJ areas can be clicked to see their current poverty and minority percentages. The locations of oil and gas wells and permits are also visible at the regional scale.
Map of current EJ areas (based on 2015 census data) shown in teal, with listening tour counties outlined in red
Of note in the 2004 policy are the kinds of permits that trigger a potential EJ review – specifically: industrial wastewater facilities, air permits for new major source of hazardous air pollution, waste permits for landfills and incinerators, coal mining permits and coal refuse facilities, and/or concentrated animal feeding operations. The policy also allows for review of “opt-in permits” the DEP believes warrant special consideration, but we have found no evidence to suggest that this option has been historically used.
When a project triggers EJ review, the DEP “strongly encourages” the applicant meets with community stakeholders prior to submitting their permit, with the idea that additional public outreach makes project details more apparent. The applicant is also encouraged to produce “plain language” information sheets, online and in print form, regarding the proposed activity.
Issues with Existing PA EJ Policies
A complete list of what may occur when a project triggers EJ review can be found here. The following table is a breakdown of where we see deficiencies in PA EJ policies that need to be addressed:
Existing Policy
Issue
Possible Solutions
EJ Definition EJ areas defined by 20% poverty/30% minority indicators.EJ ensures meaningful involvement of all people regardless of race, color, national origin, or income.
Many communities are just outside poverty/minority thresholds, or are spread across multiple census tracts experiencing concentrated industrial activities.
Disproportionate exist due to other factors besides poverty and race.
DEP should go beyond the census tracts, as well as account for other factors such as the “working poor”, homeownership rates, assisted school lunches rate, disability and elderly populations, and language barriers.
Reviews should factor in “cumulative impacts” of more developing relative to existing industrial burdens.
Regardless of “age and gender” should be added to EJ protection language.
Trigger Permits Limited kinds of “trigger” permit types are listed in the Public Participation Policy as eligible for EJ review.
Permits outside of these categories are also degrading the communities and being targeted to environmental justice communities. Oil and gas extractions, pipelines, and other infrastructure are not currently considered trigger permits but are impacting many environmental justice areas.
DEP should oil and gas permits to the trigger list. All permits, even of seemingly lesser severity, should trigger review to see if they contribute to cumulative impacts to already burdened community.
Permit Notifications DEP program staff must notify the Office of EJ when a permit “trigger” EJ review and report the details of the proposed activity.
Currently not all DEP program staff are alerting the EJ office of trigger permits, and many are not education on EJ policies.
More training and funding needs to be allocated to make sure that trigger permits are not overlooked or mishandled.
Public Education
Requiring the distribution of “plain language” information sheets regarding the proposed activity and permit conditions. Public notices are to be placed in widely read publications in print and online.
Does not always happen or the information produced is inadequately written or poorly distributed. Public notices are put in the legal sections of paper, often initial meetings are not even publicly noticed if the company is the only one organizing the meeting.
Enforce this requirement and include real infographics as much as possible. Consult with local community groups to determine what communication tools work best.
Publish additional notice outside of newspaper in widely read publications, flyers in local businesses, community centers, and church bulletins. Require applicants to do direct mailing.
Updated the “eFacts notification system to include more information and send email notices to interested parties when updates in non-technical language.
Applicant Public Meetings
DEP “strongly suggests” applicants meet with all stakeholders, before applying for permit, as well as throughout the permitting process.
Not all stakeholders are being brought into conversations and often DEP allows the applicant to decide who these people should be. Applicants are often not transparent about their plans. Meetings do not occur at all stages of the process.
It should not be up to the applicant to control the process and do outreach. DEP should ensure that all interested parties are engaged in the permitting process.
Meeting should be held during the entire permitting process. This should be required, not “strongly suggested.” A meeting should occur after a permit is administratively complete and again after technical review is done but before a decision is made. Many changes happened during technical review and this gives communities the opportunity to weigh in on the final project and understand its timeline.
DEP should always participate in these meetings and make themselves available to answer questions from the community.
DEP Public Meetings
DEP holds an informal public conference within 30 days of receiving the application to inform residents of EJ area designation and the nature of project.
These meetings frequently are not able to answer people questions and residents are told to wait for additional information. The format of these meetings do not allow for dialogue, which prevents the community from learning from each other.
The DEP needs to hold the informal public conferences in discussion formats so residents can ask questions together and receive answers in person, not just take notes and tell residents they will receive a written response. DEP staff responsible for reviewing the proposal must be present at the meetings to answer questions.
Public Comments
DEP accepts comments from EJ communities.
These comments are often not taken into consideration, or given very little weight during the permitting process. Instead, the comments are merely noted for the record.
Create a formal process for integrating comments from community experts who are often best able to provide information about how a project will impact their community.
DEP Availability
DEP will maintain presence and be availability to residents throughout permitting process.
DEP staff are available during public meetings but are otherwise unavailable until there is a permit decision.
Inadequate continuing public oversight of how EJ policies are administered across the state.
Actively provide updates on the permitting process and changes to the application. The burden should not be on an EJ community to stay up date on the permit, but should be the DEP and applicant’s responsibility.
DEP staff responsible for reviewing the proposal must be available to the community to answer questions. DEP should also prioritize filling its regional Environmental Advocate staff positions currently vacant in many of its districts.
Convert the DEP Citizen Environmental Justice Advisory Board (EJAB) to a full committee, with the power to oversee EJ permits under review and influence state EJ policies. Hold quarterly EJAB meetings in different DEP regions on a rotating basis.
Reflections on other states’ EJ policies
States that use poverty and race indicators differently:
Connecticut: Uses income below 200% of the federal poverty level (“working poor”).
Illinois: indicates low-income and/or minority population as being “greater than twice the statewide average.”
Massachusetts: Defines by census “block group” rather than census tract, which can identify pocket EJ areas that might be lost in larger census tracts.
Texas: For income indicator, uses census block group and income below 200% of the federal poverty level.
States that go beyond poverty and race indicators:
California: Considers existing disproportionate environmental burden. Also, demographics include “low levels of homeownership, high rent burden…or low levels of educational attainment.”
Connecticut: includes a “distressed community” indicator, defined as whether it is eligible for HUD grants, or experienced layoffs/tax loss due to a major plant closing.
Georgia: includes language for elderly and disabled populations “The Americans with Disabilities Act (ADA) encourages the involvement of people with disabilities in the development and improvement of transportation and paratransit plans and services.”
Massachusetts: Uses linguistic isolation, defined as “25% or more of households having no one over the age of 14 who speaks English only, or very well.”
New Jersey: Communities can file a petition to be recognized as a vulnerable.
Example of better public participation affordances:
New Jersey: When a community is designated EJ, a task force is formed to develop a unique “Action Plan” after consultation with residents, local, and county government, that will address environmental, social and economic factors affecting their health or environment. This task force monitors Action Plan implementation, and advises development projects to reduce impacts.
Conclusions
Environmental justice rules came into existence in order to deal with the burdens of large polluting facilities like landfills, incinerators, and coal mines. Race and poverty measures are, without question, two very important indicators that have provided for the fair treatment of people of all races, income, and cultures in these instances. However, if we are to properly assess how residents are disproportionately impacted across a range of environmental burdens in the state, other indicators of marginalization should be included. The Center for Coalfield Justice suggests a few in a report titled Community Indicators of Environmental Justice: A Baseline Report Focusing on Greene and Washington Counties, Pennsylvania.
Fair treatment in EJ communities should also mean offering mechanisms for meaningful input that allow residents to shape the ultimate direction of proposed projects, as well. Finally, current EJ policies are very limited in only addressing future projects, whereas issues such as how disadvantaged communities, struggling with legacy problems such water, air, and soil pollution, are left to other agencies to deal with.
We encourage residents of Pennsylvania to attend an environmental justice listening tour session to share their perspectives, and how the DEP can better fulfill its mandates to protect vulnerable communities.
https://www.fractracker.org/a5ej20sjfwe/wp-content/uploads/2017/04/EJ_tour_header.jpg400900FracTracker Alliancehttps://www.fractracker.org/a5ej20sjfwe/wp-content/uploads/2021/04/2021-FracTracker-logo-horizontal.pngFracTracker Alliance2017-04-10 11:06:352021-04-15 15:03:12PA DEP Environmental Justice Listening Tour
https://www.fractracker.org/a5ej20sjfwe/wp-content/uploads/2017/04/Dead-of-Spring-Feature.jpg400900Guest Authorhttps://www.fractracker.org/a5ej20sjfwe/wp-content/uploads/2021/04/2021-FracTracker-logo-horizontal.pngGuest Author2017-04-06 11:30:422021-04-15 15:03:12Interview with Sherry Knowlton, Author of Dead of Spring
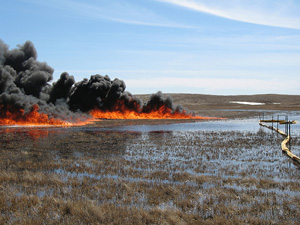
… asserted a county commissioner to a recent gathering of concerned residents in Hannibal, Ohio. His comment came at the end of over an hour of deeply moving narratives from residents, sharing disturbing changes in their health after a disastrous well pad fire in their community and other ongoing shale development in the area. One family, whose home was blanketed by the heavy black smoke from the fire, which burned for five days in 2014, told of respiratory problems, hair loss, newly-diagnosed thyroid issues, and a premature birth. Another family reported worsening of existing cardiac conditions, sleep disturbances, and considerable stress due to continued encroachment of pipelines and compression stations.
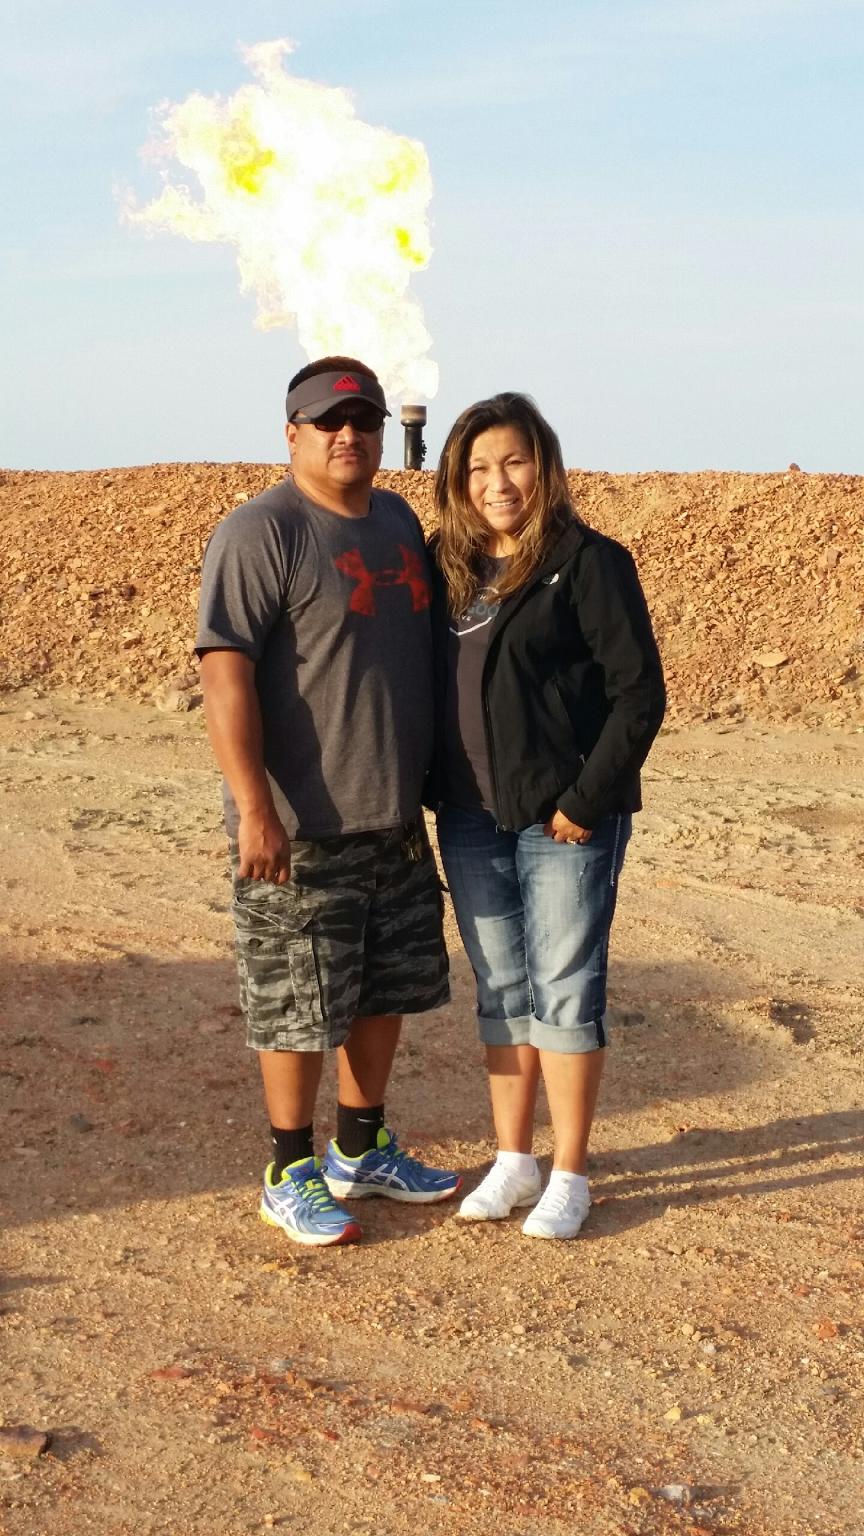
Figure 1: Residents of the Fort Berthold Indian Reservation in North Dakota live amid numerous oil rigs. Photo credit: Shalefield Stories, Vol. 2.
Throughout the country, personal stories like these offer a meaningful window into the experiences of people living at the frontlines of shale gas and oil development – often called ‘fracking.’ But aggregated into a formal health registry, these experiences can also form the kind of documentation needed to inform public health research and legislators who, like the county commissioner in Ohio, insist on documented evidence before issuing health-protective policies.
A health registry is “a dataset of uniform information about individuals collected in a systematic and comprehensive way, in order to serve a predetermined medical or public health purpose.”
The Southwest PA Environmental Health Project (EHP), in partnership with the Genetic Alliance, has just introduced the first such national system. In this online system, participants share – and control access to – their own data, making it unique among many other registries. This exciting new forum invites those living, working, or going to school near shale gas and oil development, like the families described above, to share their exposures and document their health symptoms. Perhaps most importantly, it ensures that personal stories are collected, respected, and treated as the important data that they are.
Figure 2: These quick and informative videos introduce EHP’s Shale Gas & Oil Health Registry and how it works. They feature the voices of those who helped create it, including public health professionals, the director of EHP, and a community member.
Why a registry?
Public health research affirms that there are significant health risks for those living, working, or attending school near shale gas and oil development. Research points to links between proximity to fracking and worsened asthma and other respiratory impacts and skin conditions; fracking’s noise pollution and stress-related conditions, like cardiovascular problems; and low birth weight babies among mothers living near numerous hydraulically fractured wells.
Physicians, Scientists, and Engineers for Healthy Energy (PSE) conducted a thorough examination of the extensive and growing body of shale gas and oil-related research and found that between 2009 and 2015, 84% of the studies focused on health have findings that “indicate public health hazards, elevated risks, or adverse health outcomes.”
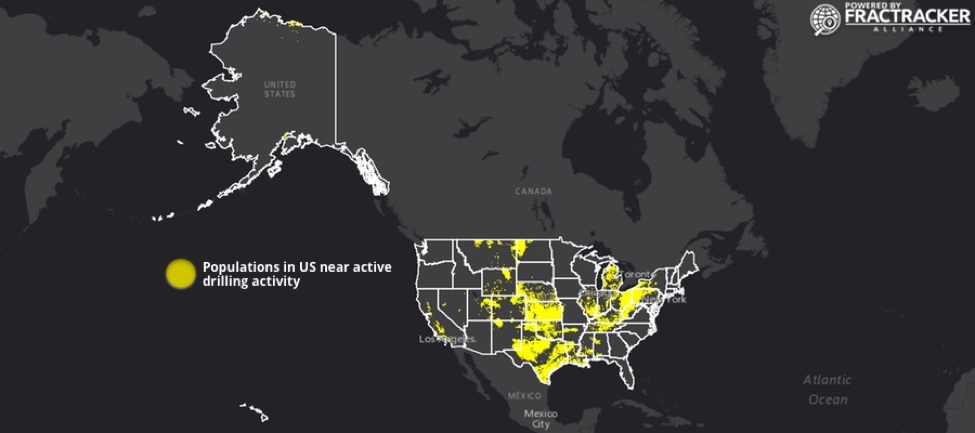
Figure 3: Populations in the U.S. near active drilling. The Shale Gas & Oil Health Registry has a national scope. Click on the image to learn more about how this map was made.
For years, some medical professionals attuned to environmental effects on health have noted correlations between fracking and health symptoms in their patients. But without a clear explanation of causation that links such symptoms to fracking, researchers need more data.
The Pennsylvania Medical Society recommended a registry as a necessary step toward getting a grasp on the public health problem. A health registry collects health data systematically, and may support further epidemiology and toxicology research by putting these patterns in higher contrast.
Laying the Groundwork
The Shale Gas & Oil Health Registry did not emerge in isolation, but rather is one of several ongoing efforts toward gathering the innumerable accounts of health symptoms from shale development regions around the country.
Important grassroots initiatives include the List of the Harmed, started by Jenny Lisak in 2011. The List catalogues over 20,000 stories of human, animal, and environmental impacts. The Natural Gas Exploration & Production Health and Community Impacts Survey, created by The Damascus Citizens for Sustainability (DCS), is an effort to collect health impact information from individuals in shale gas communities and hopefully trigger further review from the Agency for Toxic Substances and Disease Registry (ATSDR). Additionally, there are numerous peer reviewed studies on the topic, but they are often too limited in scope and size to be generalized to communities outside of where the data was originally collected.
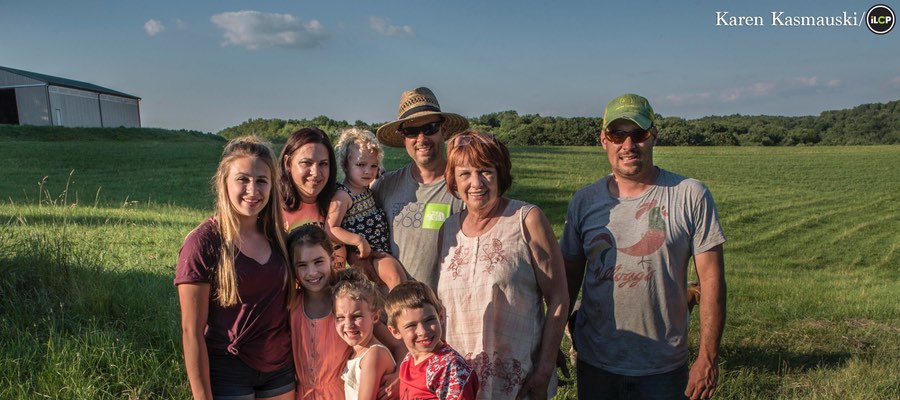
Figure 4: In Washington County, PA, houses sit just below a compressor station, a type of natural gas facility that can produce air emissions, noise, and light pollution. In the health registry, participants can answer questions about the types of facilities they are exposed to. Photo credit: Karen Kasmauski, iLCP.
Two states have begun their own registry-related efforts. Colorado’s Oil & Gas Health Information and Response Program includes an online self-referral form, a hotline for those with health concerns potentially related to oil and gas, and a health information “clearinghouse.” Their program aims to illuminate “possible health effects related to oil and gas operations,” which the program intends to make available to the public, researchers, and policy-makers (source).
Pennsylvania, where EHP does much of its on-the-ground work, has a history of legislative calls for its own registry, beginning with recommendations issued by Governor Tom Corbett’s Marcellus Shale Advisory Commission in 2011. The Secretary of Health at the time called a registry “the most timely and important initiative” for the Department of Health (DOH). Current Governor Tom Wolf called for a shale gas health registry in his 2014 gubernatorial campaign. He proposed budgeting $100,000 to the PA Department of Health (DOH) for the cause, although health professionals argue that more is needed to implement an effective registry. According to recent conversations with EHP, DOH is in the process of developing a system similar to Colorado’s, in coordination with that state. For the time being, Pennsylvanians seeking assistance from DOH will find a webpage with limited information, directing calls to the state’s Bureau of Epidemiology.
Making the Registry a Reality
There is a clear need for a system to collect individuals’ exposures and health symptoms, with a national scope that matches the country-wide scale of shale development. Yet, the costs of initiating and maintaining a registry, political issues related to industry reporting on the chemicals they use and discharge, and scientific issues such as scant exposure data and limited funding for research, are some of the various obstacles that faced the implementation of a health registry.
From a health perspective, symptoms potentially related to drilling activity may be similar to symptoms from unrelated causes, or may be exacerbations of existing health conditions. Added to this is the complexity of exposure sources, since an individual or family may live, work, or go to school in proximity to multiple types of shale gas and oil facilities. Moreover, those at the frontlines of shale oil and gas development – whose health data is essential to the registry – may be reluctant to participate due to social or family pressures.
The Shale Gas & Oil Health Registry directly addresses each of these challenges. Using an existing registry infrastructure created by Genetic Alliance significantly reduced the costs of launching and maintaining the registry. Including systematic questions that let users record their proximity to – and frequency of – exposure captures the complexity of this important information. And through steps like collecting zip codes instead of home addresses, and offering the choice of privacy settings that only allow researchers to see data in anonymous form, the registry ensures confidentiality and user control of data.
Figure 6. A variety of sources can trigger health issues during shale gas and oil development. These include air emissions from processing facilities and well pad accidents, as well as the heavy truck traffic required to drill and frack a well; spills and other forms of water contamination; and psychological impacts like stress and sleep disruption.
End Result: The Shale Gas & Oil Health Registry
Figure 7: The health registry includes a set of questions for participants whose exposures come from working in the gas and oil industry. Photo credit: Bill Hughes.
The result of these efforts is a secure, online system where participants – people within five miles of shale gas and oil development, with or without health symptoms – can create an account for themselves and/or their family members. The online registry guides them through a series of screens inviting them to share the various exposures they encounter, such as heavy truck traffic, air emissions, and water impacts. Participants can catalogue and update health symptoms that have surfaced or worsened during their exposure, while controlling who can view and share their personal information.
Industry workers and children can even be registered in this system using a set of tailored questions. The registry also allows an assistor to create a profile and answer the questions for someone not comfortable with or able to use the online system.
One Registry to Meet Many Needs
EHP created the health registry to respond to the needs of several groups: affected communities, researchers, policymakers, and the public.
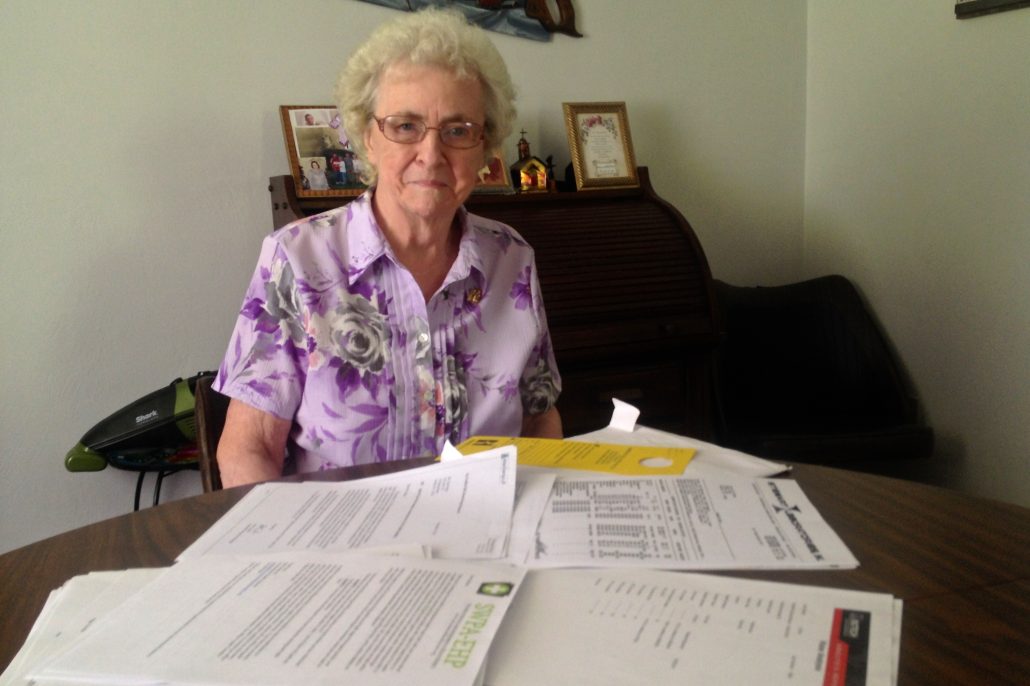
Figure 8: A resident of Washington County, PA sits in front of paperwork documenting health struggles that may be connected to shale gas development near her home. Photo credit: Shalefield Stories, Vol. 2.
In developing the health registry, EHP recognized that those affected by shale development must not be treated as “data points,” but as collaborators in – and beneficiaries of – the process. As a venue to share health concerns, the registry helps give voice to those who may be suffering in silence. Participants can connect with researchers, receive a biannual newsletter of updates on the growing size of the registry and new knowledge around health impacts and treatment. In the long view, the registry gives individuals an opportunity to take part in a large-scale effort that may ultimately inform positive change and promote protections from ever-expanding shale development.
The data participants provide via the registry can also help researchers identify emergent patterns and generate testable hypotheses for new studies. Through this process, a registry can enable research that is responsive to community needs.
Policymakers stand to benefit, as well. The patterns that the registry highlights, and the additional research it makes possible, can help elected leaders to understand the scope of the health problem. In time, this knowledge can inform policies and regulations that benefit those living in shale country.
A chance to be a part of something larger
EHP encourages those who live near shale gas and oil development, with or without health symptoms, to register now and fill out the registry questionnaire. The three-step process takes only about 20 minutes.
Share: Answer as many questions as you would like, and control how and with whom that information is shared
Connect: Find out how you compare to others, and let support and helpful resources come to you
Discover: If you wish, let researchers access your information to help them understand the health impacts of shale oil and gas development and transport
Researchers and healthcare providers who want to take part in the possibilities created by the registry, such as studying data patterns from participants who have elected to share certain information, can contact Jill Kriesky (jkriesky@environmentalhealthproject.org) or Beth Weinberger (bweinberger@environmentalhealthproject.org) for more information.
Ready to get started? Click here to join the Shale Gas & Oil Health Registry!
Sincere Appreciation
Many thanks to those who contributed to this article about the Shale Gas & Oil Health Registry through interviews and by sharing the images used in this story.
Dana Dolney, co-founder of Friends of the Harmed. Friends of the Harmed, publishers of Shalefield Stories, dedicate 100% of donations they receive to providing much-needed direct aid to families negatively affected by fracking.
Jenny Lisak, creator of List of the Harmed. List of the Harmed is an ever-growing list of the individuals and families that have been harmed by fracking (or fracked gas and oil production) in the U.S.
Barbara Arrindell, director of Damascus Citizens’ Group. Damascus Citizens for Sustainability (DCS) is a collaborative endeavor to preserve and protect clean air, land and water as a civil and basic human right in the face of the threat posed by the shale gas extraction industry.
Jill Kriesky, Associate Director and Beth Weinberger, Research & Communications Specialist, both of The Southwest PA Environmental Health Project. The Environmental Health Project (EHP) is a nonprofit public health organization that assists and supports residents of Southwestern Pennsylvania and beyond who believe their health has been, or could be, impacted by unconventional oil and gas development (UOGD, or “fracking”).
By Leann Leiter, Environmental Health Fellow, FracTracker Alliance & EHP
https://www.fractracker.org/a5ej20sjfwe/wp-content/uploads/2017/03/Family-Registry-iLCP-Feature.jpg400900FracTracker Alliancehttps://www.fractracker.org/a5ej20sjfwe/wp-content/uploads/2021/04/2021-FracTracker-logo-horizontal.pngFracTracker Alliance2017-04-04 11:05:222021-04-15 15:03:13The Shale Gas & Oil Health Registry: A Collective Step to Track the Impacts of Fracking
By Greg Pace – Columbus Community Bill of Rights, and Julie Weatherington-Rice – Environmental Consultant
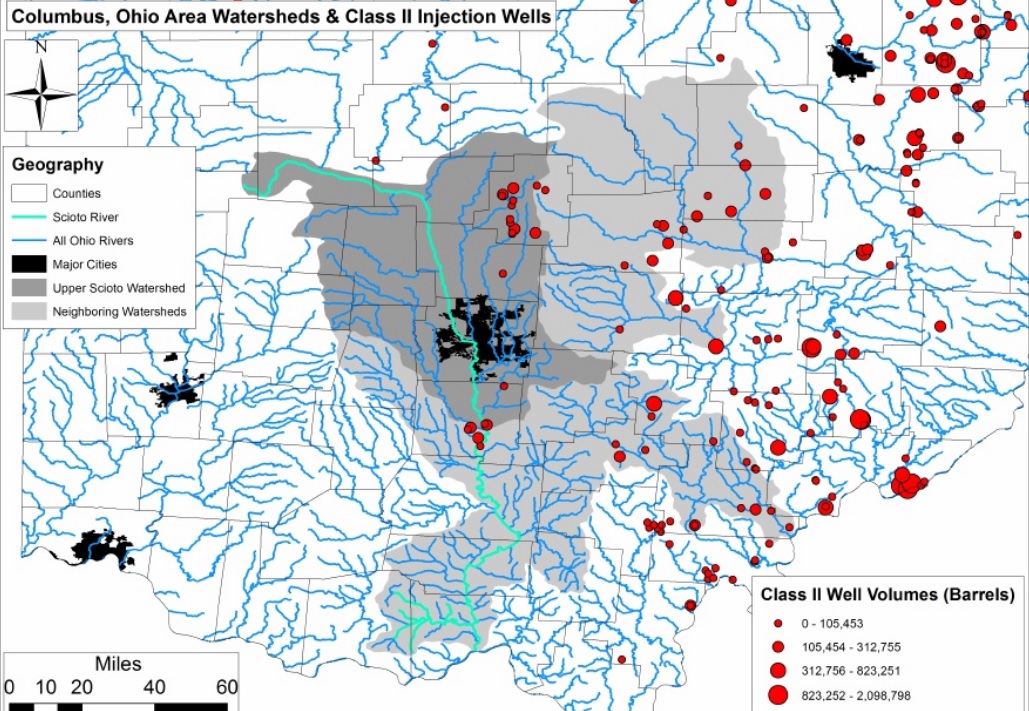
Figure 1. Map of Columbus, OH Watersheds and Class II Injection Wells
Most Ohio residents are unaware of the frack fluid deep underground injection occurring north of Columbus, underneath the region’s source water protection watersheds (Figure 1).
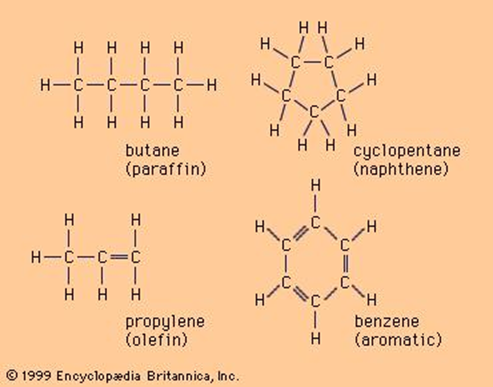
Materials injected are liquids that have as much as ten times the salt concentration of sea-water. Mixed with this “brine” solution is a combination from hundreds of chemicals that are used in different stages of horizontal hydraulic fracturing, the process used to extract natural gas, petroleum, and hydrocarbon liquids used to make industrial materials such as plastics. BTEX compounds including benzene are always present in the wastewater, along with formaldehyde, bromides, ethylene glycol (antifreeze), and arsenic, with many other carcinogenic and otherwise highly-toxic substances.
Radioactivity of Shale Gas Wastewater
One of the biggest questions in this mix of toxic disposal is how much radioactive content exists. Radium-226 is most worrisome, as it has a very long half-life (1,600 years). It is water-soluble and, once it enters the human body, seeks to find a home in our bones where it will emit its cell-formation-destabilizing effects for the remainder of our lifetime. This radionuclide is known to cause leukemia, bone cancers, blood disorders, and other diseases.
The state of Ohio does not monitor the content of materials that are injected into our Class II injection wells deep in the ground. This oil and gas waste can come from anywhere, including Pennsylvania’s Marcellus shale, which is the most highly-radioactive geology of all the shale plays in the country. Radium-226 readings as high as 15,000 pico-curies per liter have been read in Marcellus shale brines. The EPA drinking water limit for radium-226 is 5 pico-curies per liter, which puts the Marcellus reading at 3,000 times higher than the drinking water limit.
Exposure through drinking water is a pathway to human disease from radium-226. Once oil and gas waste is disposed of underground in a sandstone or limestone layer, the fluids are subject to down-gradient movement, wicking through capillary action, and seepage over time. This means that the highly radioactive wastewater could eventually end up in our underground drinking water sources, creating radium watersheds. This practice is putting our watersheds at risk from radioactive contamination for hundreds of years, at least.
Can injected fluids migrate?
Depending on whether you confer with a geologist who works with the oil and gas industry, or from an independent geologist, you will get a different opinion on the likelihood of such a pollution event occurring. Industry geologists mostly claim that deep injection leaves very low risk of water contamination because it will not migrate from the planned area of injection. On the other hand, independent geologists will tell you that it is not a matter of if the liquids will migrate, but how and when. The ability to confirm the geology of the underground area layer of injection “storage” is not exact, therefore accuracy in determining the probability for migration over time is poor.
Figure 2. Ohio Utica Brine Production and Class II Injection Well Disposal
We do know, however, that all underground systems in Ohio leak – Research by The Ohio State University and the US Geological Survey show that the age of the water in brine formations is far younger than the age of the rock deposits they are found in. See where wastewater is being created and disposed of in Ohio using the dynamic map above (Figure 2).
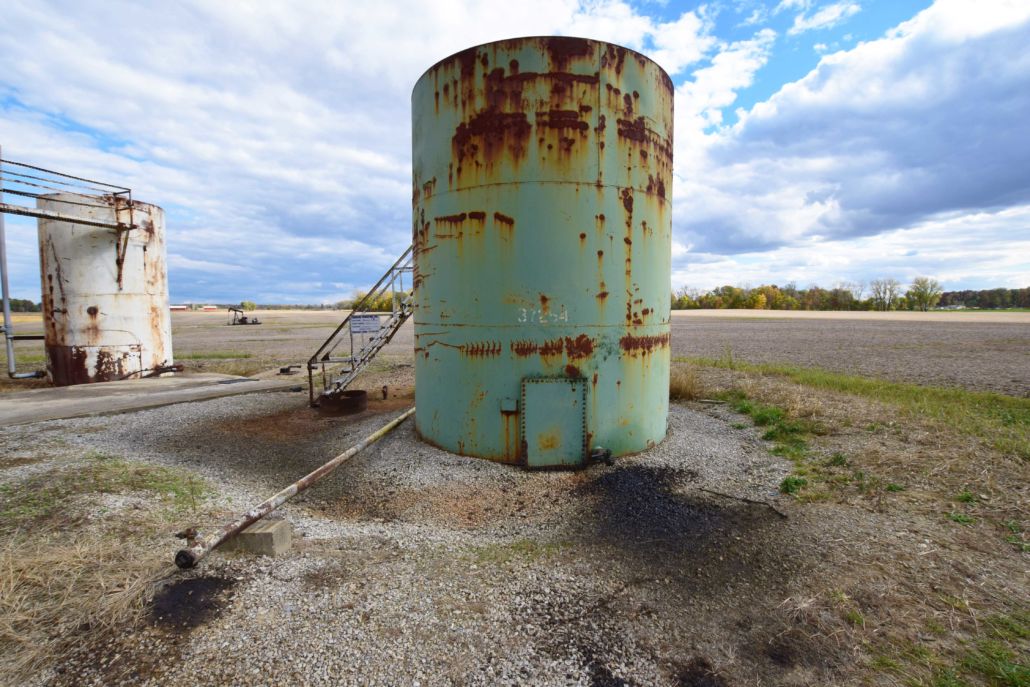
Spill Risks to Columbus, OH Water
According to area geologist, Dr. Julie Weatherington-Rice, the source for Columbus’s water to the north is mostly from surface water. This water comes from the Delaware and Morrow county watersheds that feed into sources such as the Hoover and Alum Creek reservoirs. The major threat from injection wells to our watershed is from spills, either from trucks or from storage at the injection well sites themselves.
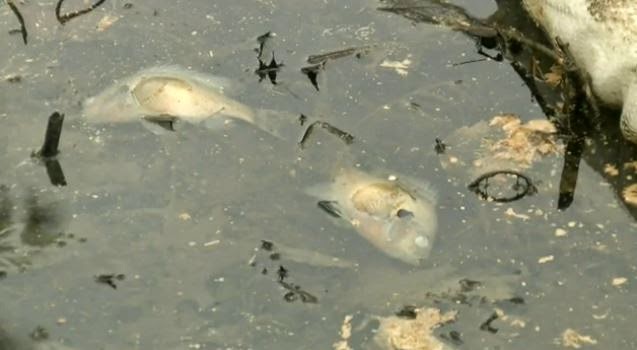
Figure 3. Dead fish floating in Vienna area pond contaminated by injection well system spill. Source: MetropolitanEnegineering Consulting & Forensics-Expert Engineers
In April 2015, as much as 8,000 gallons of liquid leaked from a malfunctioning pipe in the storage apparatus of an oil/gas waste storage and injection well site in Vienna, OH. This caused a wildlife kill in two ponds (Figure 3), and the spill was not contained until 2/3 mile downstream in a tributary. The firm who owned the facility was found negligent in that they did not install a required containment liner for spills. The incident was discovered by neighboring residents, but apparently employees knew of the leak weeks before. Of note in this incident was that Ohio Department of Natural Resources, the regulatory agency that oversees all oil/gas production activity in Ohio including injection, stated that there was “minimal impact to wildlife.”
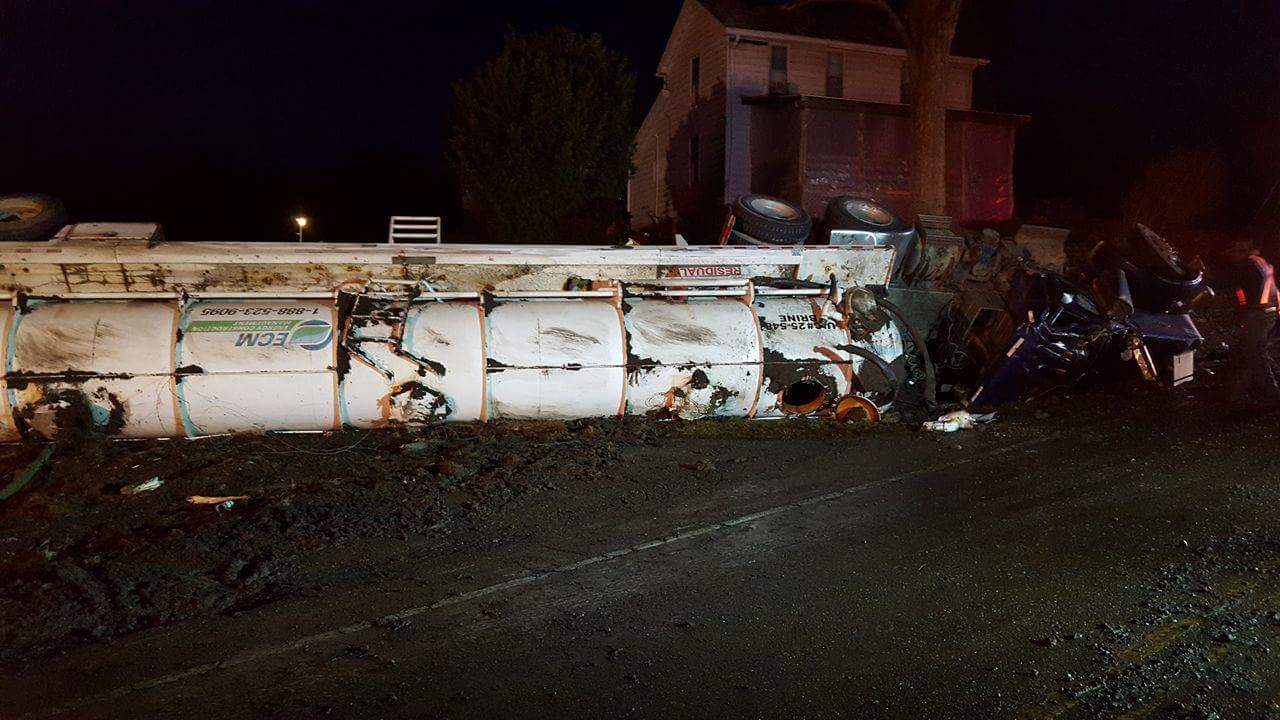
Figure 4. Brine tanker rollover near Barnesville, OH spilled 5,000 gal. of produced brine. Source: Barnesville, OH Fire Department
In March, 2016, a tanker truck carrying produced waste from a hydraulically fractured well pad overturned outside of the Village of Barnesville, Ohio (Figure 4). The truck spilled 5,000 gallons of liquid waste into a field that led into a tributary, leading the fluids to enter one of the city’s three drinking water supply reservoirs. The water source was shut down for more than two months while regulators determined if water levels were safe for consumption. There was a noted spike in radium-226 levels during water testing immediately after the spill.
Of greatest concern is that, although many millions of gallons of frack waste have been injected into the wells north of Columbus over the past few years, we expect that this activity will increase. For the first time, the United States began exporting its own natural gas in 2016, to regions such as Europe and South America. As the industry consolidates from the depression of oil prices over the past two years and begins to ramp up again, we expect the extraction activity in the Marcellus and especially Utica to increase to levels beyond what we have seen since 2011. The levels of injection will inevitably follow, so that injection wells in Ohio will receive much more than in the past. The probability of spills, underground migration, and human-induced earthquakes may increase steeply, as well.
An Aging Disposal Infrastructure
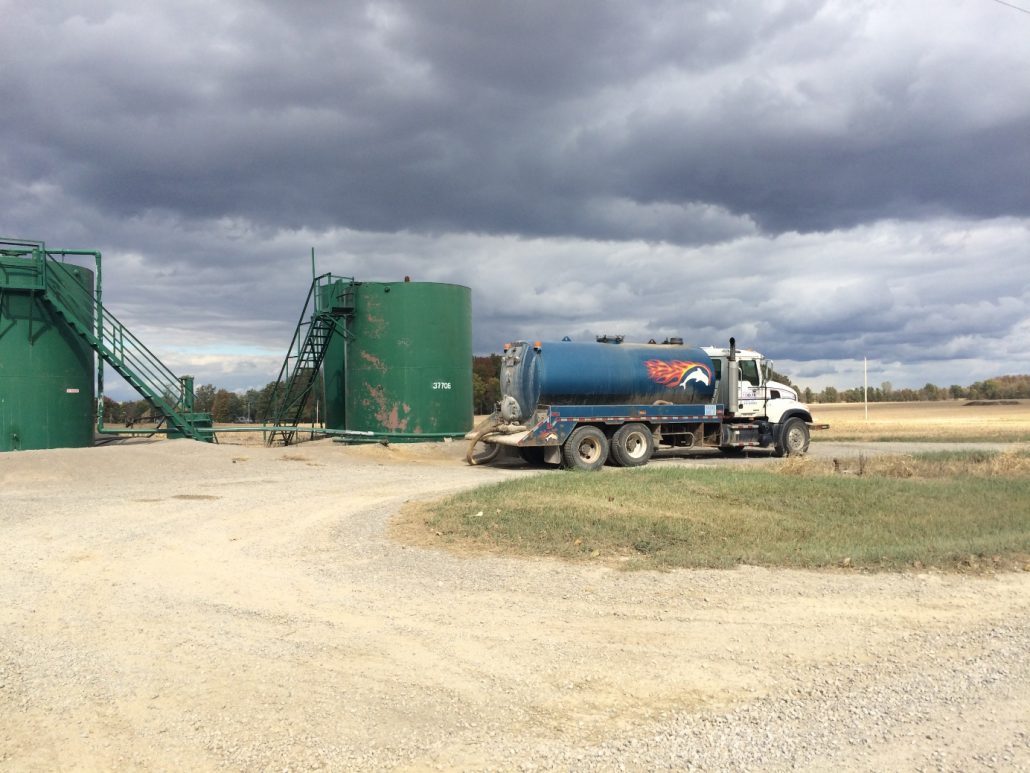
On our Columbus Community Bill of Rights website, we show pictures of some of the Class II injection wells in Morrow County, most of them converted from legacy production wells. These old wells are located in played out oil/gas fields that may still be producing or have abandoned but not plugged (closed) wells, allowing other routes for injected liquids to migrate into shallow ground water and to the surface. The dilapidated condition of these converted Class II wells makes it hard to believe that they are used to inject millions of gallons of wastewater under high pressure. While many of the wells in the state are as deep as 9,000 feet, all of the injection wells we have seen in Morrow County are only 3,000-4,000 feet deep. This situation puts surface water at greater risk over time, as it is probable that, over the generations, some of the fluids will migrate and wick into the higher subterranean strata.
One well (Power Fishburn unit, photo below) showed signs of poor spill control when we took our October 2015 injection well tour. While we were there, a brine tanker arrived and began pumping their load into the well. The driver took pictures of our license plates while we were there watching him. A year later, there is a whole new structure at the well, including a new storage tower, and an extensively beefed-up spill control berm. Maybe we need to visit all of the facilities when they come by to use them!
Another well (Mosher unit, photo below) which hadn’t been used since 2014 according to available records, showed signs of a spill around the well. The spill control berms look as if they probably had flooded at some point. This well sits on the edge of a large crop field.
Figures 6a and 6b. Photos of Class II injection wells. Click on the images to expand them.
North of Columbus, the city of Delaware’s underground source water is at risk of becoming contaminated from underground migration of disposed wastewater over time, through wicking and seepage effects (as explained earlier in this article). They are also vulnerable to their reservoir being contaminated from surface spill migration through their watershed.
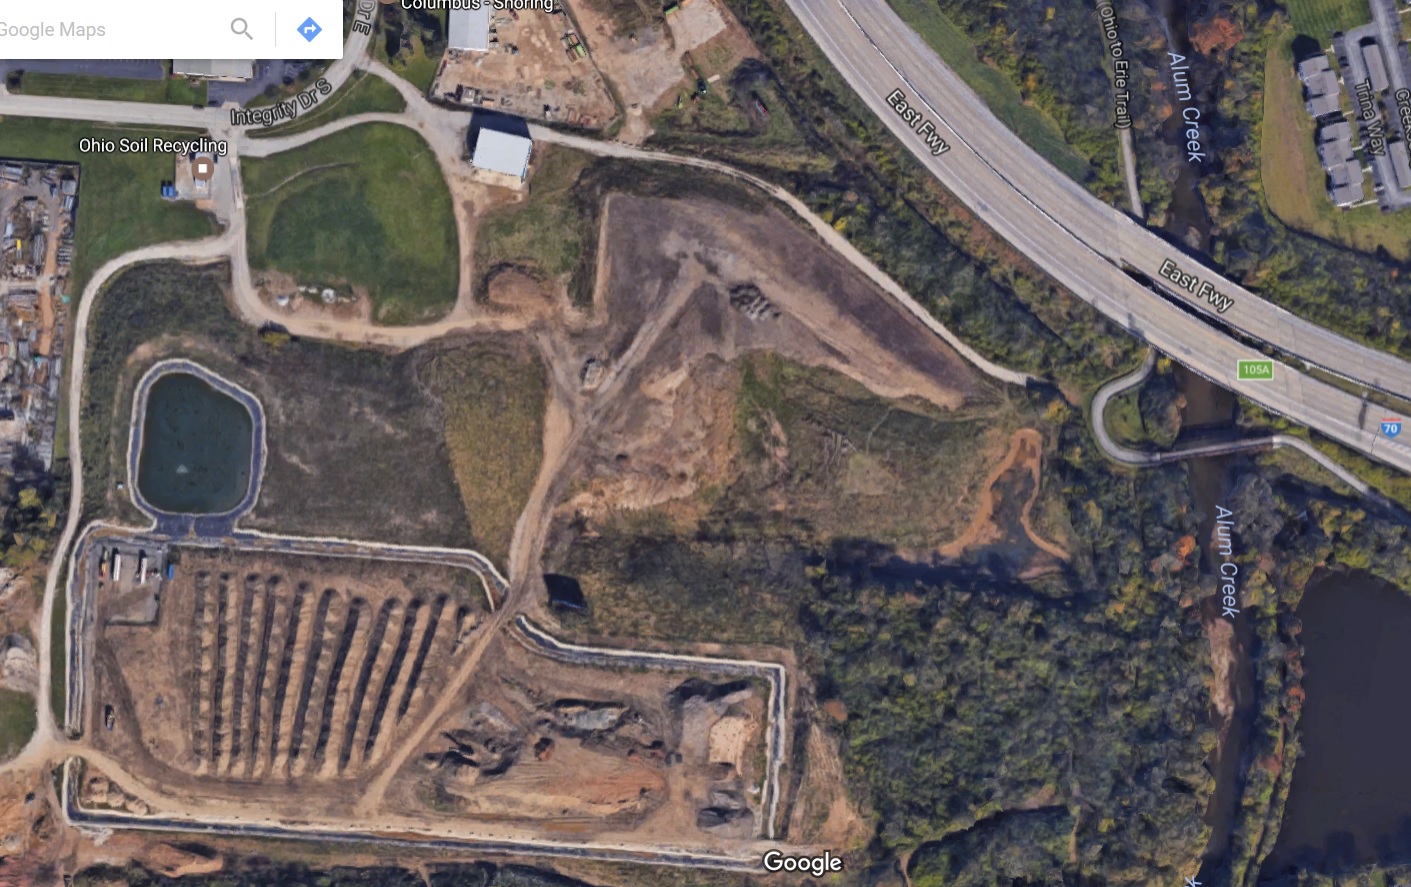
Figure 7. Google maps rendition of Ohio Soil Recycling facility in south Columbus, Ohio, that accepts shale drill cuttings for remediation to cap the landfill. Source: Google Maps/author
South of Columbus is another threat – drill cuttings from the drilling process have been authorized for disposal at a “remediation” landfill adjacent to the Alum Creek (Figure 7). The bioremediation treatment used is not indicated to solve the problem of removing radionuclides from the materials. This landfill had been remediated under the Ohio EPA twice when it was a toxic drum dump, after toxins were found to have been leaching into the watershed creek. Columbus’s Alum Creek well, as well as Circleville, are at risk of contamination in their drinking water if radionuclides from the cuttings leach into Alum Creek. Again, this is a long-term legacy of risk to their water.
Radiation Regulatory and Monitoring Gaps
Since The Ohio legislature deemed the radioactive content of shale cuttings to be similar to background levels in the 2013 state budget bill, cuttings can be spread around to all licensed landfills in Ohio with absolutely no accountability for the radium and other heavy metal levels in them. Unfortunately, the measuring protocol used in the pilot study for the Columbus facility to demonstrate to Ohio EPA that radium-226 was below EPA drinking water limits has been shown in a University of Iowa study to be unreliable. The inadequate protocol was shown to indicate as little as 1% of the radium levels in shale waste samples tested.
As such, there have been hundreds of incidents where truckloads of cuttings have been turned away at landfills with crude radiation monitors. In 2013 alone, 2 loads were turned away in Ohio landfills, and over 220 were turned away from Pennsylvania landfills.
Ohio has a long way to go before it can be considered a clean energy state. The coal industry polluted significant water sources in the past. The fracking industry seems to be following suit, where contaminations will surprise us long into the future and in broader areas.