Pennsylvanians Demand a Response to Rare Cancer Cases, Other Health Impacts
New research on fracking health impacts, combined with unusually high rates of pediatric cancer, sound alarm bells in Pennsylvania
FracTracker isn’t the only one digging deeper into the health impacts of fracking in the past few months. Last week, the Better Path Coalition organized a meeting at the Capitol Building in Harrisburg, Pennsylvania, to share new research with government officials, the press, and the public. These groundbreaking reports highlight the increasing body of evidence showing fracking’s adverse health and climate impacts.
Following the presentations on emerging research, Ned Ketyer, M.D., F.A.A.P, discussed the highly concerning proliferation of rare pediatric cancer cases in southwestern Pennsylvania.
Dr. Ketyer drew data from a report released last month by the Pittsburgh Post Gazette, which uncovered an unusually high number of childhood cancer diagnoses in southwestern Pennsylvania over the last decade. In just four counties (Washington, Greene, Fayette and Westmoreland), there were 27 people diagnosed with Ewing sarcoma, a rare bone cancer, between 2008 and 2018. Six of the 27 people diagnosed were from the Canon-McMillan School District in Washington County, where there are currently 10 students district-wide with other types of cancers.
The expected number of Ewing sarcoma diagnoses over this time period and for the population count of southwestern Pennsylvania would be 0.75 cases per year, or roughly eight cases over the course of a decade. The higher number of rare childhood cancers was the subject of a recent community meeting held by the Southwest Pennsylvania Environmental Health Project (EHP), where residents called on the state to further investigate the issue and take immediate action to eliminate any potential environmental causes. For more of EHP’s resources on this topic, click here.
Cancer in the Marcellus
The Pennsylvania Department of Health investigated three of these cases in Washington County and found that they did not meet the criteria definition of a cancer cluster. Still, the unusually high number of rare cancers over a small geography is cause for alarm and reason to suspect an environmental cause.
This four-county area has a legacy of environmental health hazards associated with coal mining activities and is home to a 40-year old uranium disposal site that sits in close proximity to the Canon-McMillan High School. But with the increase in cancer diagnoses over the past decade, many are looking towards fracking in the Marcellus Shale, the more recent environmental hazard to develop in the region, as a contributing cause.
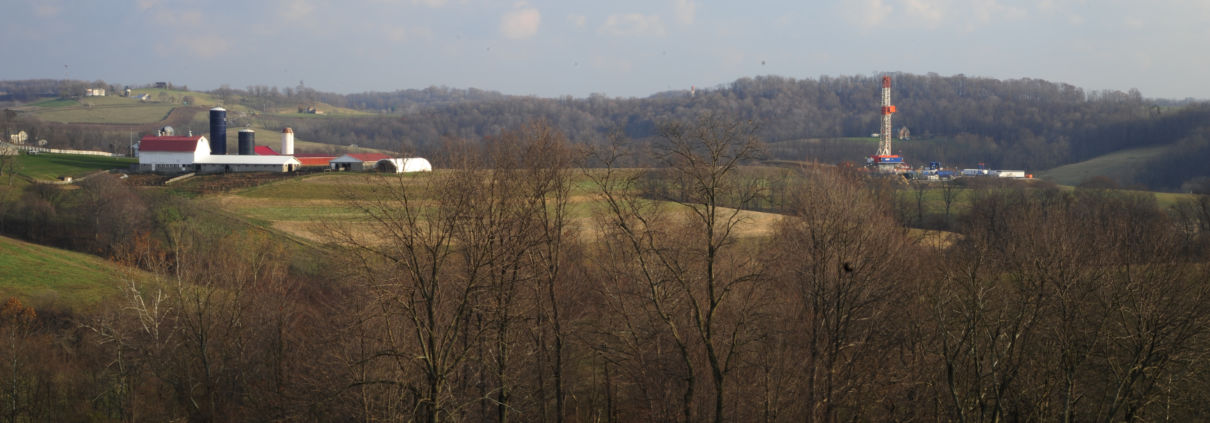
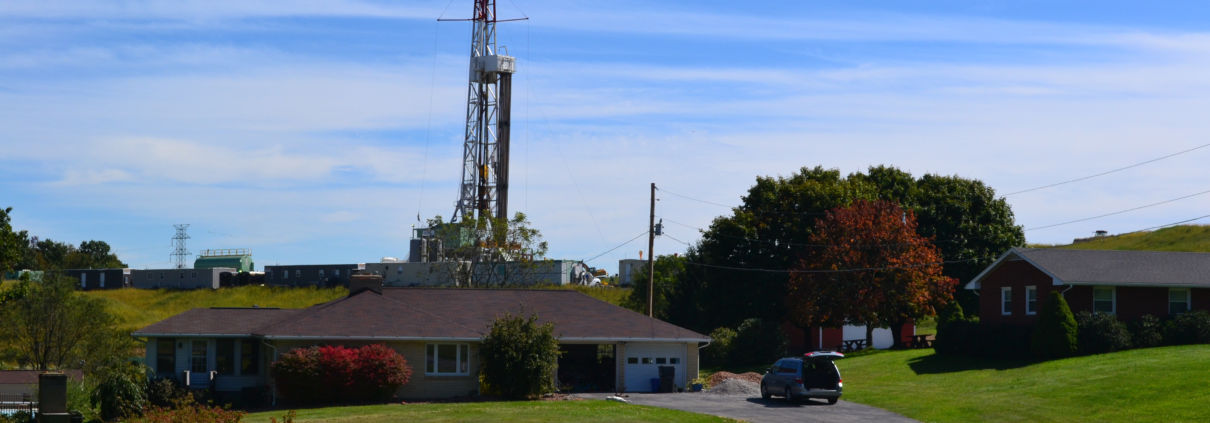
Southwestern Pennsylvania is a hot spot for fracking activity. In these four counties, there are 3,169 active, producing unconventional gas wells. There are also the infrastructure and activity associated with unconventional development: compressor stations, processing stations (including Pennsylvania’s largest cryogenic plant), disposal sites for radioactive waste, and heavy truck traffic.
The environmental and health risks of these facilities were the focus of the presentations and discussions with Pennsylvania leaders last week.
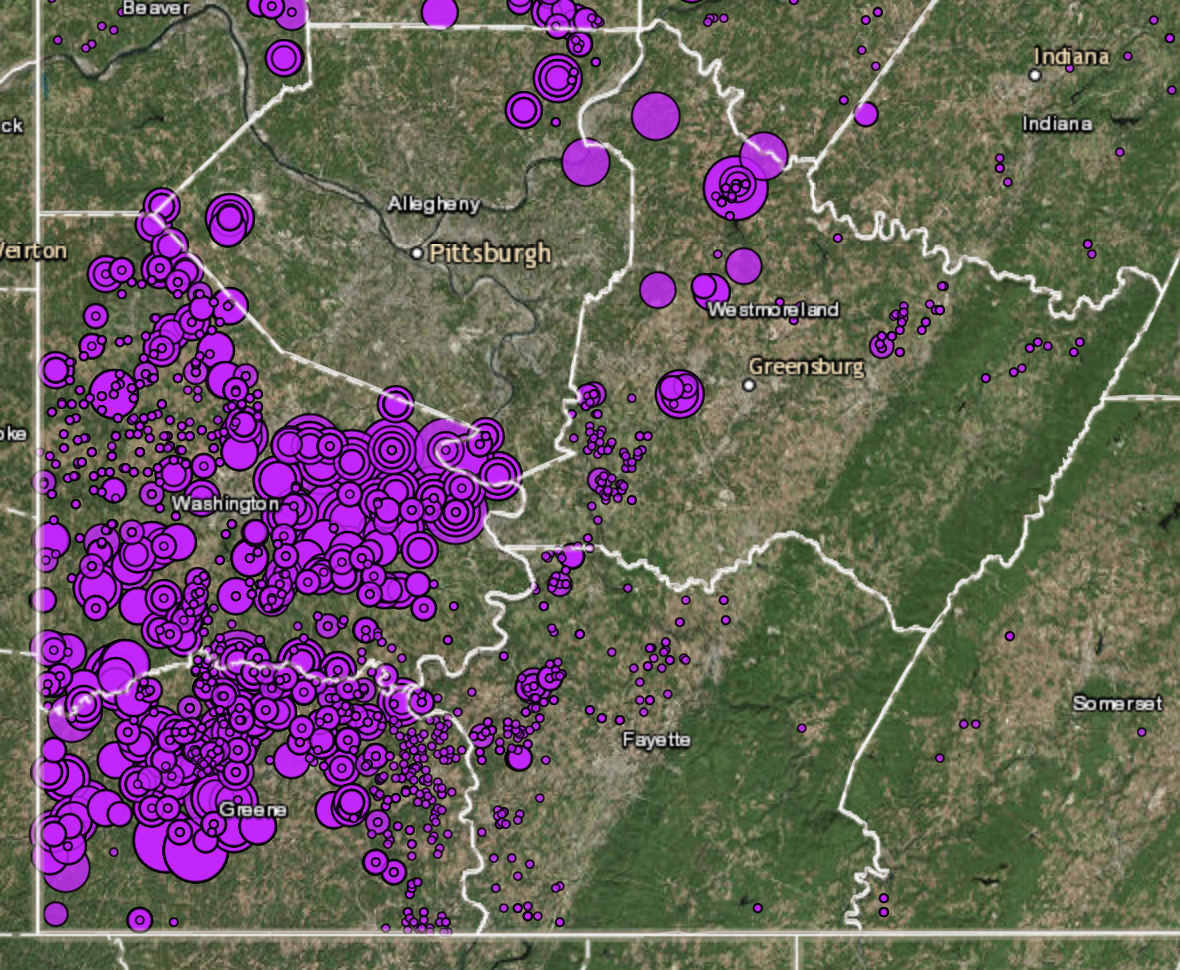
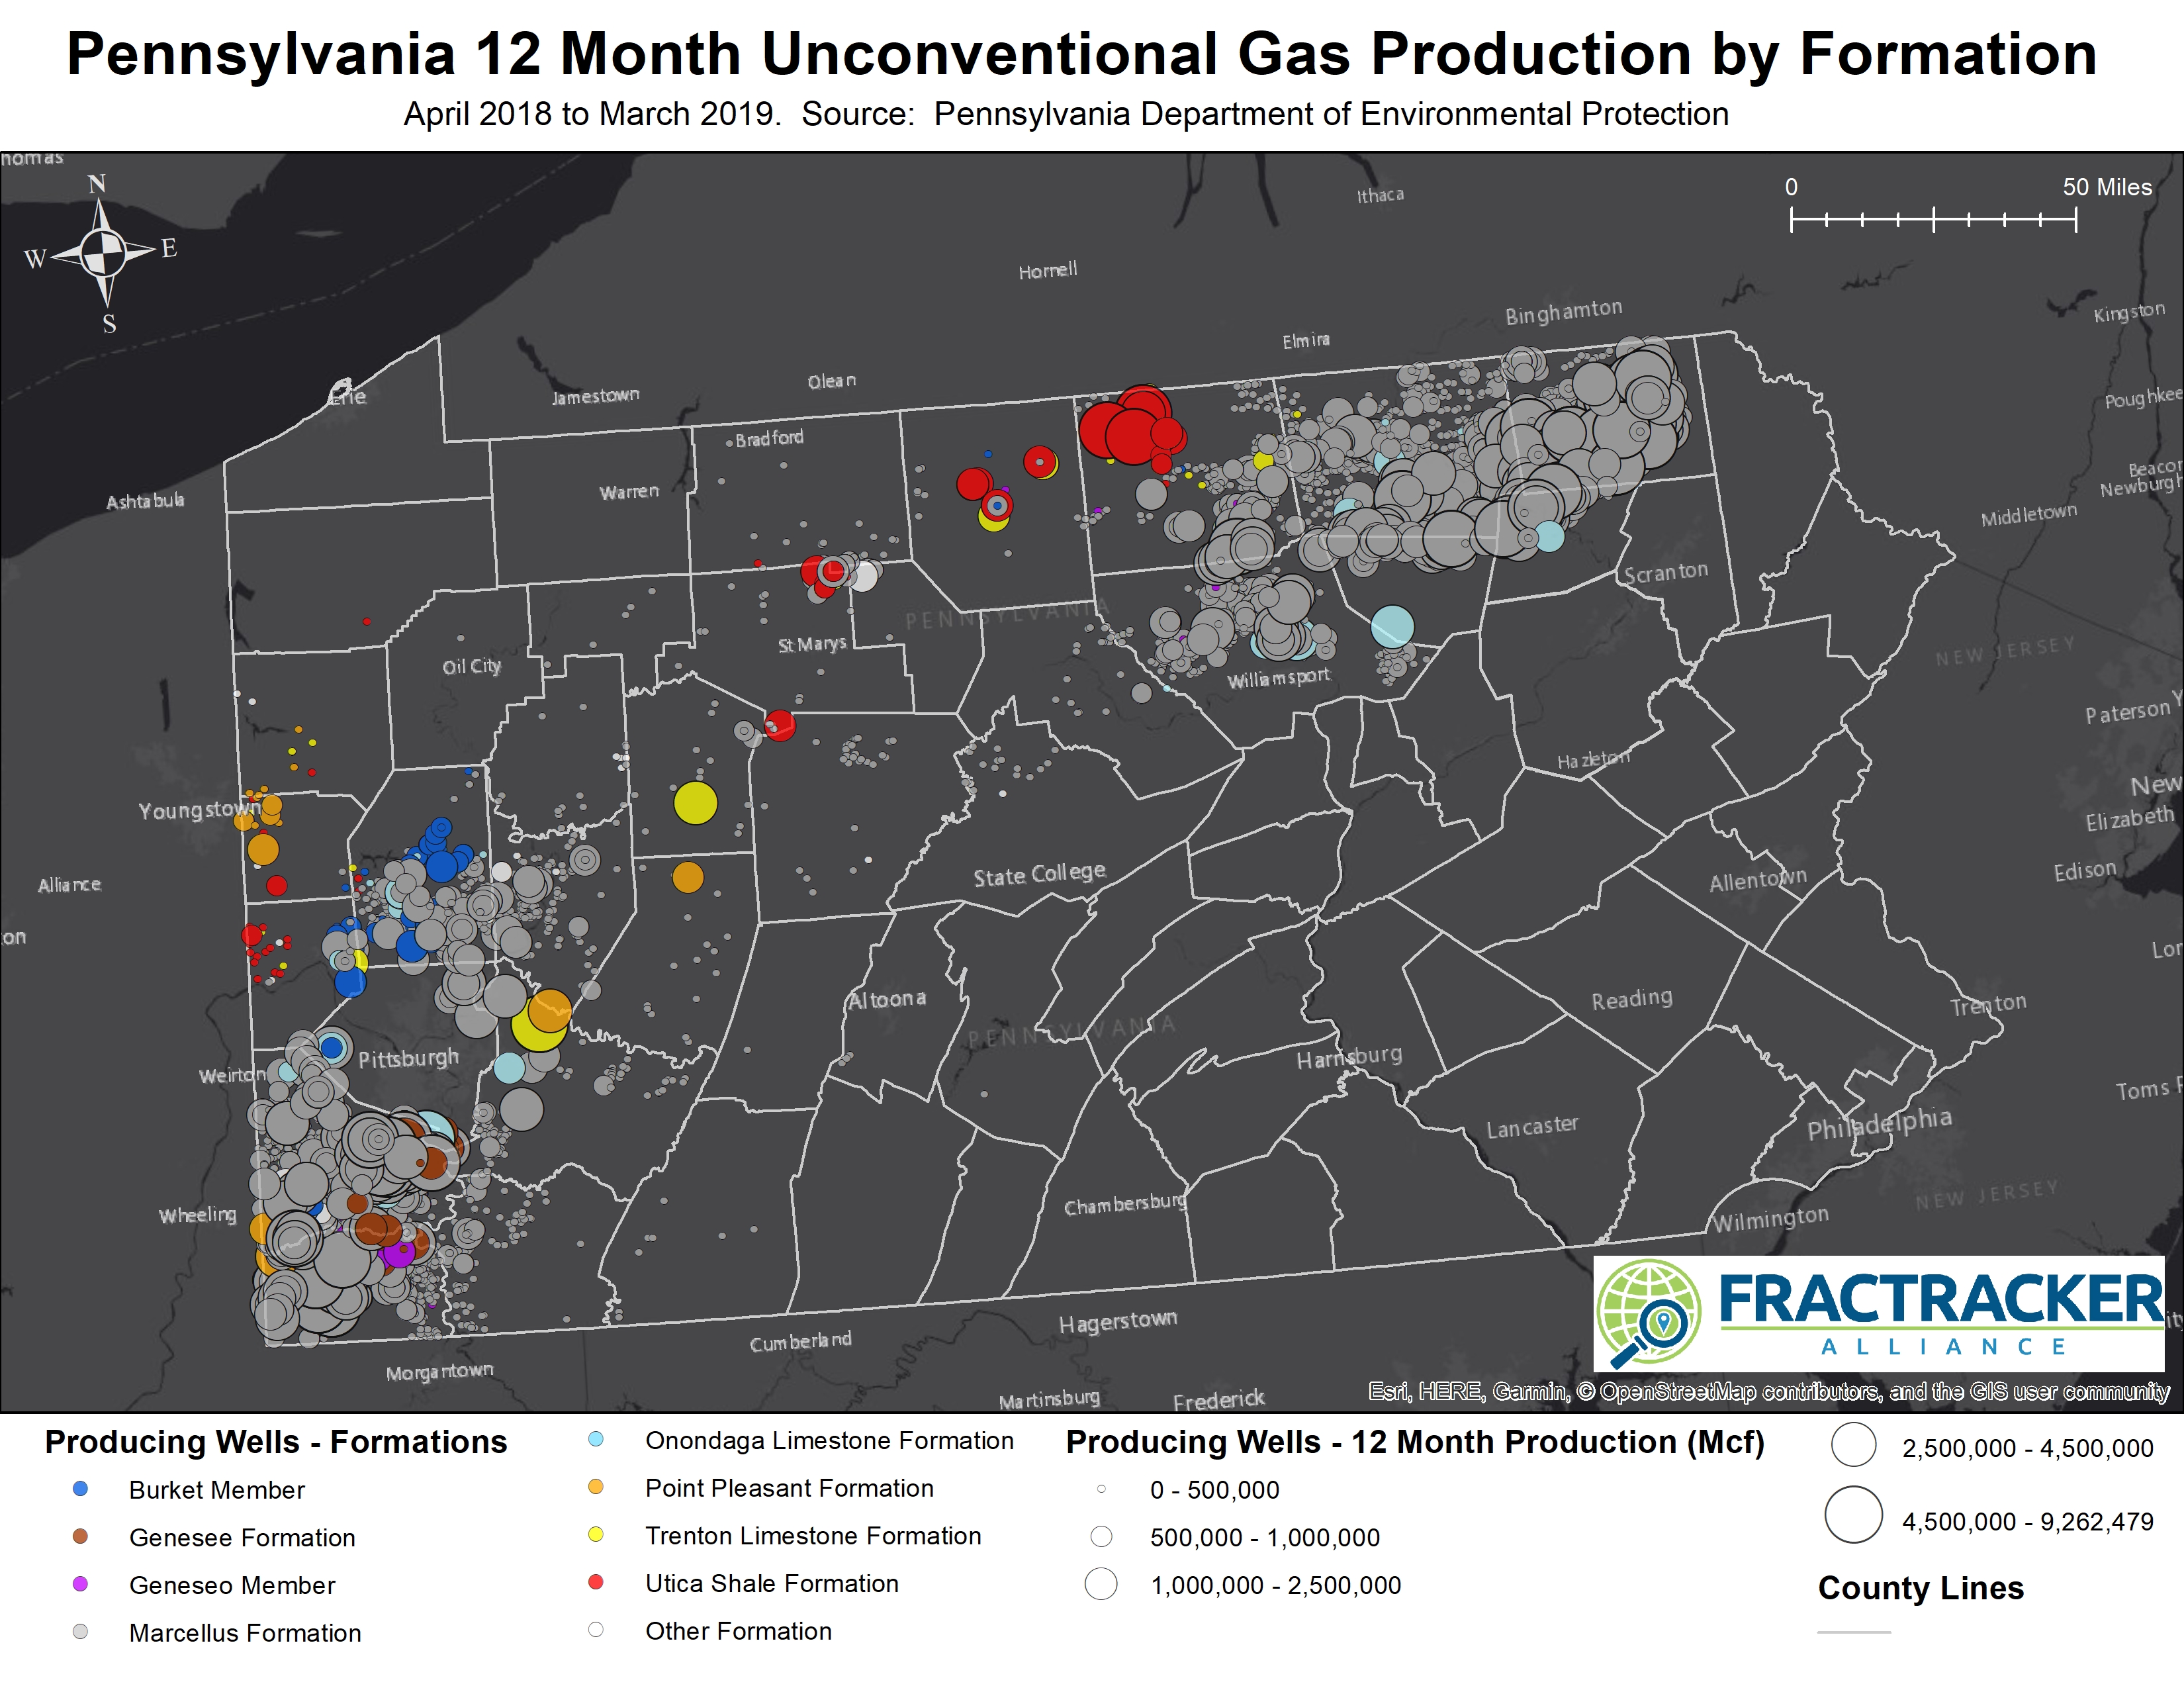
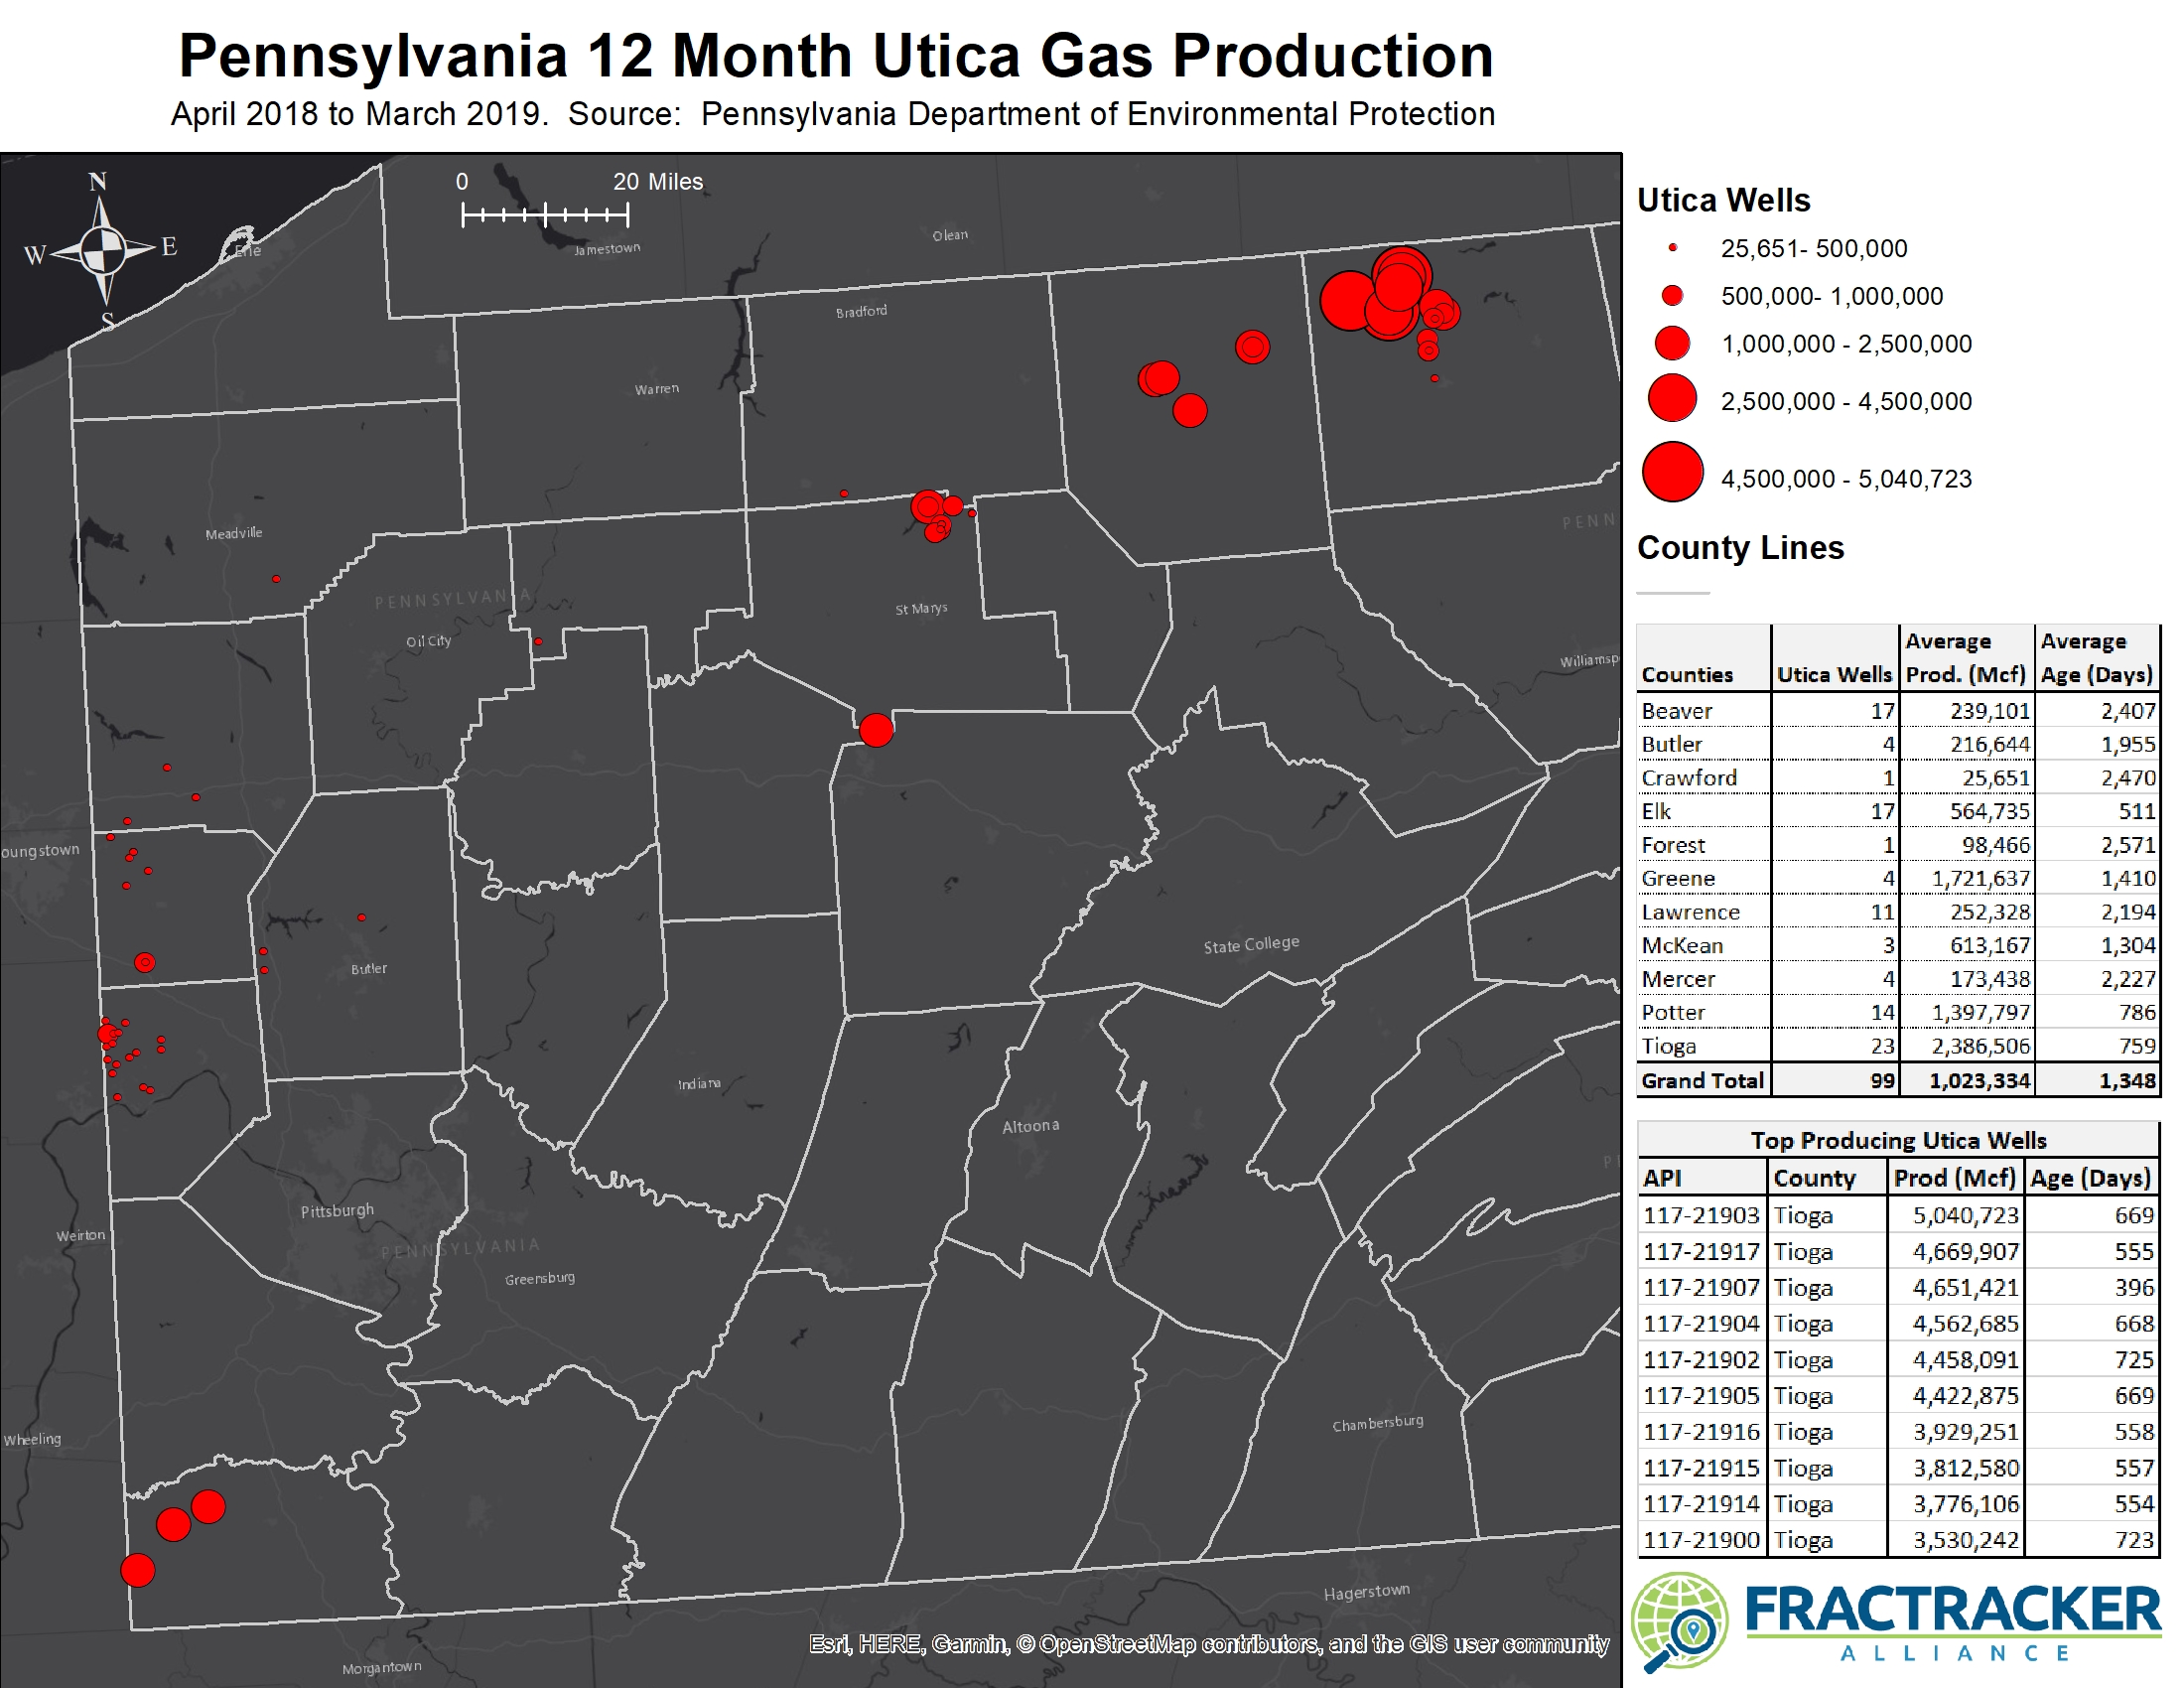
A map of unconventional gas production in southwest Pennsylvania. Click on the image to open the map.
View map fullscreen | How FracTracker maps work
Call for action
At the culmination of the Harrisburg meeting, participants delivered a letter to Governor Wolf’s office, calling for an investigation into the causes of these childhood cancer cases. Signed by over 900 environmental organizations and individuals, the letter also asks for a suspension of new shale gas permitting until the Department of Health can determine that there is no link between drilling and the cancer outcomes.
Governor Wolf’s response to Karen Feridun, the organizer of this campaign, was a disappointing dismissal of this public health crisis. Stating that the environmental regulations his office has implemented “protect Pennsylvanians from negative environmental and health impacts,” Governor Wolf went on to say that his office “will continue to monitor and study cancer incidents in this area, especially as more data becomes available,” but did not agree to suspend new permitting.
Wolf’s decision to continue with status quo permitting while waiting for more data to become available is unacceptable, and will lead to more Pennsylvanians suffering from the industry’s health impacts.
The Governor’s response is even more disheartening as it follows his recent support for a full ban on fracking activity in the Delaware River Basin (including eastern Pennsylvania). The Governor’s support for the ban is an acknowledgement of the industry’s risks, and leaves us frustrated that the southwestern part of the state is not receiving equal protection.
When is enough evidence enough?
The continued permitting of unconventional wells disregards the scientific evidence of drilling’s harms discussed in Harrisburg.
Sandra Steingraber, Ph.D, of Concerned Health Professionals of New York, discussed the results of the sixth edition of “The Compendium of Scientific, Medical, and Media Findings Demonstrating Risks and Harms of Fracking.” The Compendium outlines the health risks of fracking infrastructure from almost 1,500 peer-reviewed studies and governmental reports. Notably, the report outlines the inherent dangers of fracking and finds that regulations are incapable of protecting public health from the industry.
Erica Jackson discussed FracTracker Alliance’s recently published Categorical Review of Health Reports. This literature review analyzed 142 publications and reports on the health impacts of fracking, and found that 89% contained evidence of an adverse health outcome or health risk associated with proximity to unconventional oil and gas development.
Brian Schwartz, M.D., M.S., the Director of Geisinger Health Institute at the Johns Hopkins Bloomberg School of Public Health, presented epidemiological studies linking unconventional development to increased radon concentrations on homes and health impacts including adverse birth outcomes, mental health disorders, and asthma exacerbations.
Lorne Stockman, Senior Research Analyst with Oil Change International, discussed “Burning the Gas ‘Bridge Fuel’ Myth,” a new report that further solidifies the irrationality of continued oil and gas development based on its climate impacts. The report shows that greenhouse gas emissions from fracking exceed climate goals, and how perpetuating the myth of natural gas as a “bridge” to renewables locks in emissions for decades.
A welcome ray of hope, this report also proves that renewables are an economically viable replacement to coal and gas, costing less than fossil fuels to build and operate in most markets. Furthermore, renewables combined with increasingly competitive battery storage ensures grid reliability.
“Burden of proof always belongs to the industry”
Among the inundation of data, statistics, and studies, Dr. Steingraber offered a sobering reminder of the purpose behind the meeting:
“Public health is about real people. When we collect data on public health problems, behind every data point, behind every black dot floating on a white mathematical space on a graph captured in a study, there are human lives behind those data points. And when those points each represent the life of a child or a teenager, what the dots represent is terror, unimaginable suffering, followed by death, or terror, unimaginable suffering, followed by a life of trauma, pathology reports, bone scans, medical bills, side effects, and uncertainty that all together are known as cancer survival.”
An adolescent cancer survivor herself, Dr. Steingraber clearly articulated the ethical responsibility our elected officials have to hold industry accountable for its impacts:
“Burden of proof always belongs to the industry, and benefit of the doubt always belongs to the child. It’s wrong to treat children like lab rats and experiment on them until the body count becomes so high that it reaches all the levels of statistical significance that tells you that we have a real problem here.”
The evidence is in – we know enough to justify an end to fracking based on its health and climate impacts. It’s time for Pennsylvania’s industry and leaders to stop experimenting with residents’ health and take immediate action to prevent more suffering.
By Erica Jackson, Community Outreach and Communications Specialist, FracTracker Alliance