The Underlying Politics and Unconventional Well Fundamentals of an Appalachian Storage Hub

FracTracker is closely mapping and following the petrochemical build-out in Appalachia, as the oil and gas industry invests in petrochemical manufacturing. Much of the national attention on the build-out revolves around the Appalachian Storage Hub (ASH), a venture spearheaded by Appalachian Development Group.

The ASH involves a network of infrastructure to store and transport natural gas liquids and finds support across the political spectrum. Elected officials are collaborating with the private sector and foreign investors to further development of the ASH, citing benefits such as national security, increased revenue, job creation, and energy independence.

Left out of the discussion are the increased environmental and public health burdens the ASH would place on the region, and the fact that natural gas liquids are the feedstock of products such as plastic and resins, not energy.

The “Shale Revolution”

the allegheny plateau

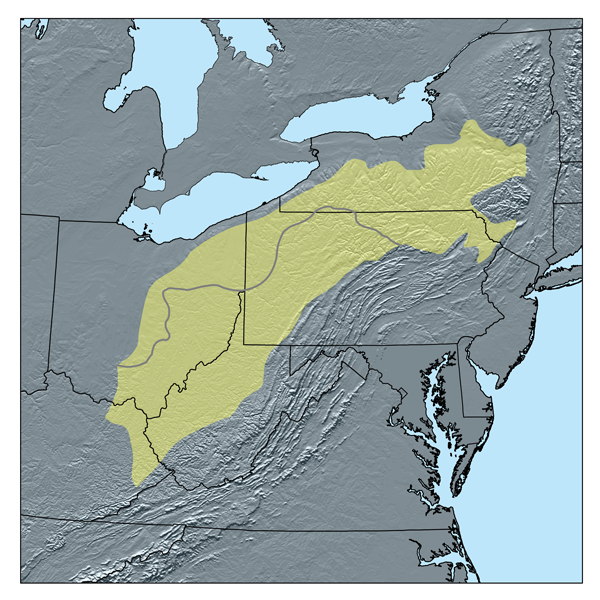
The Allegheny Plateau. Wikipedia

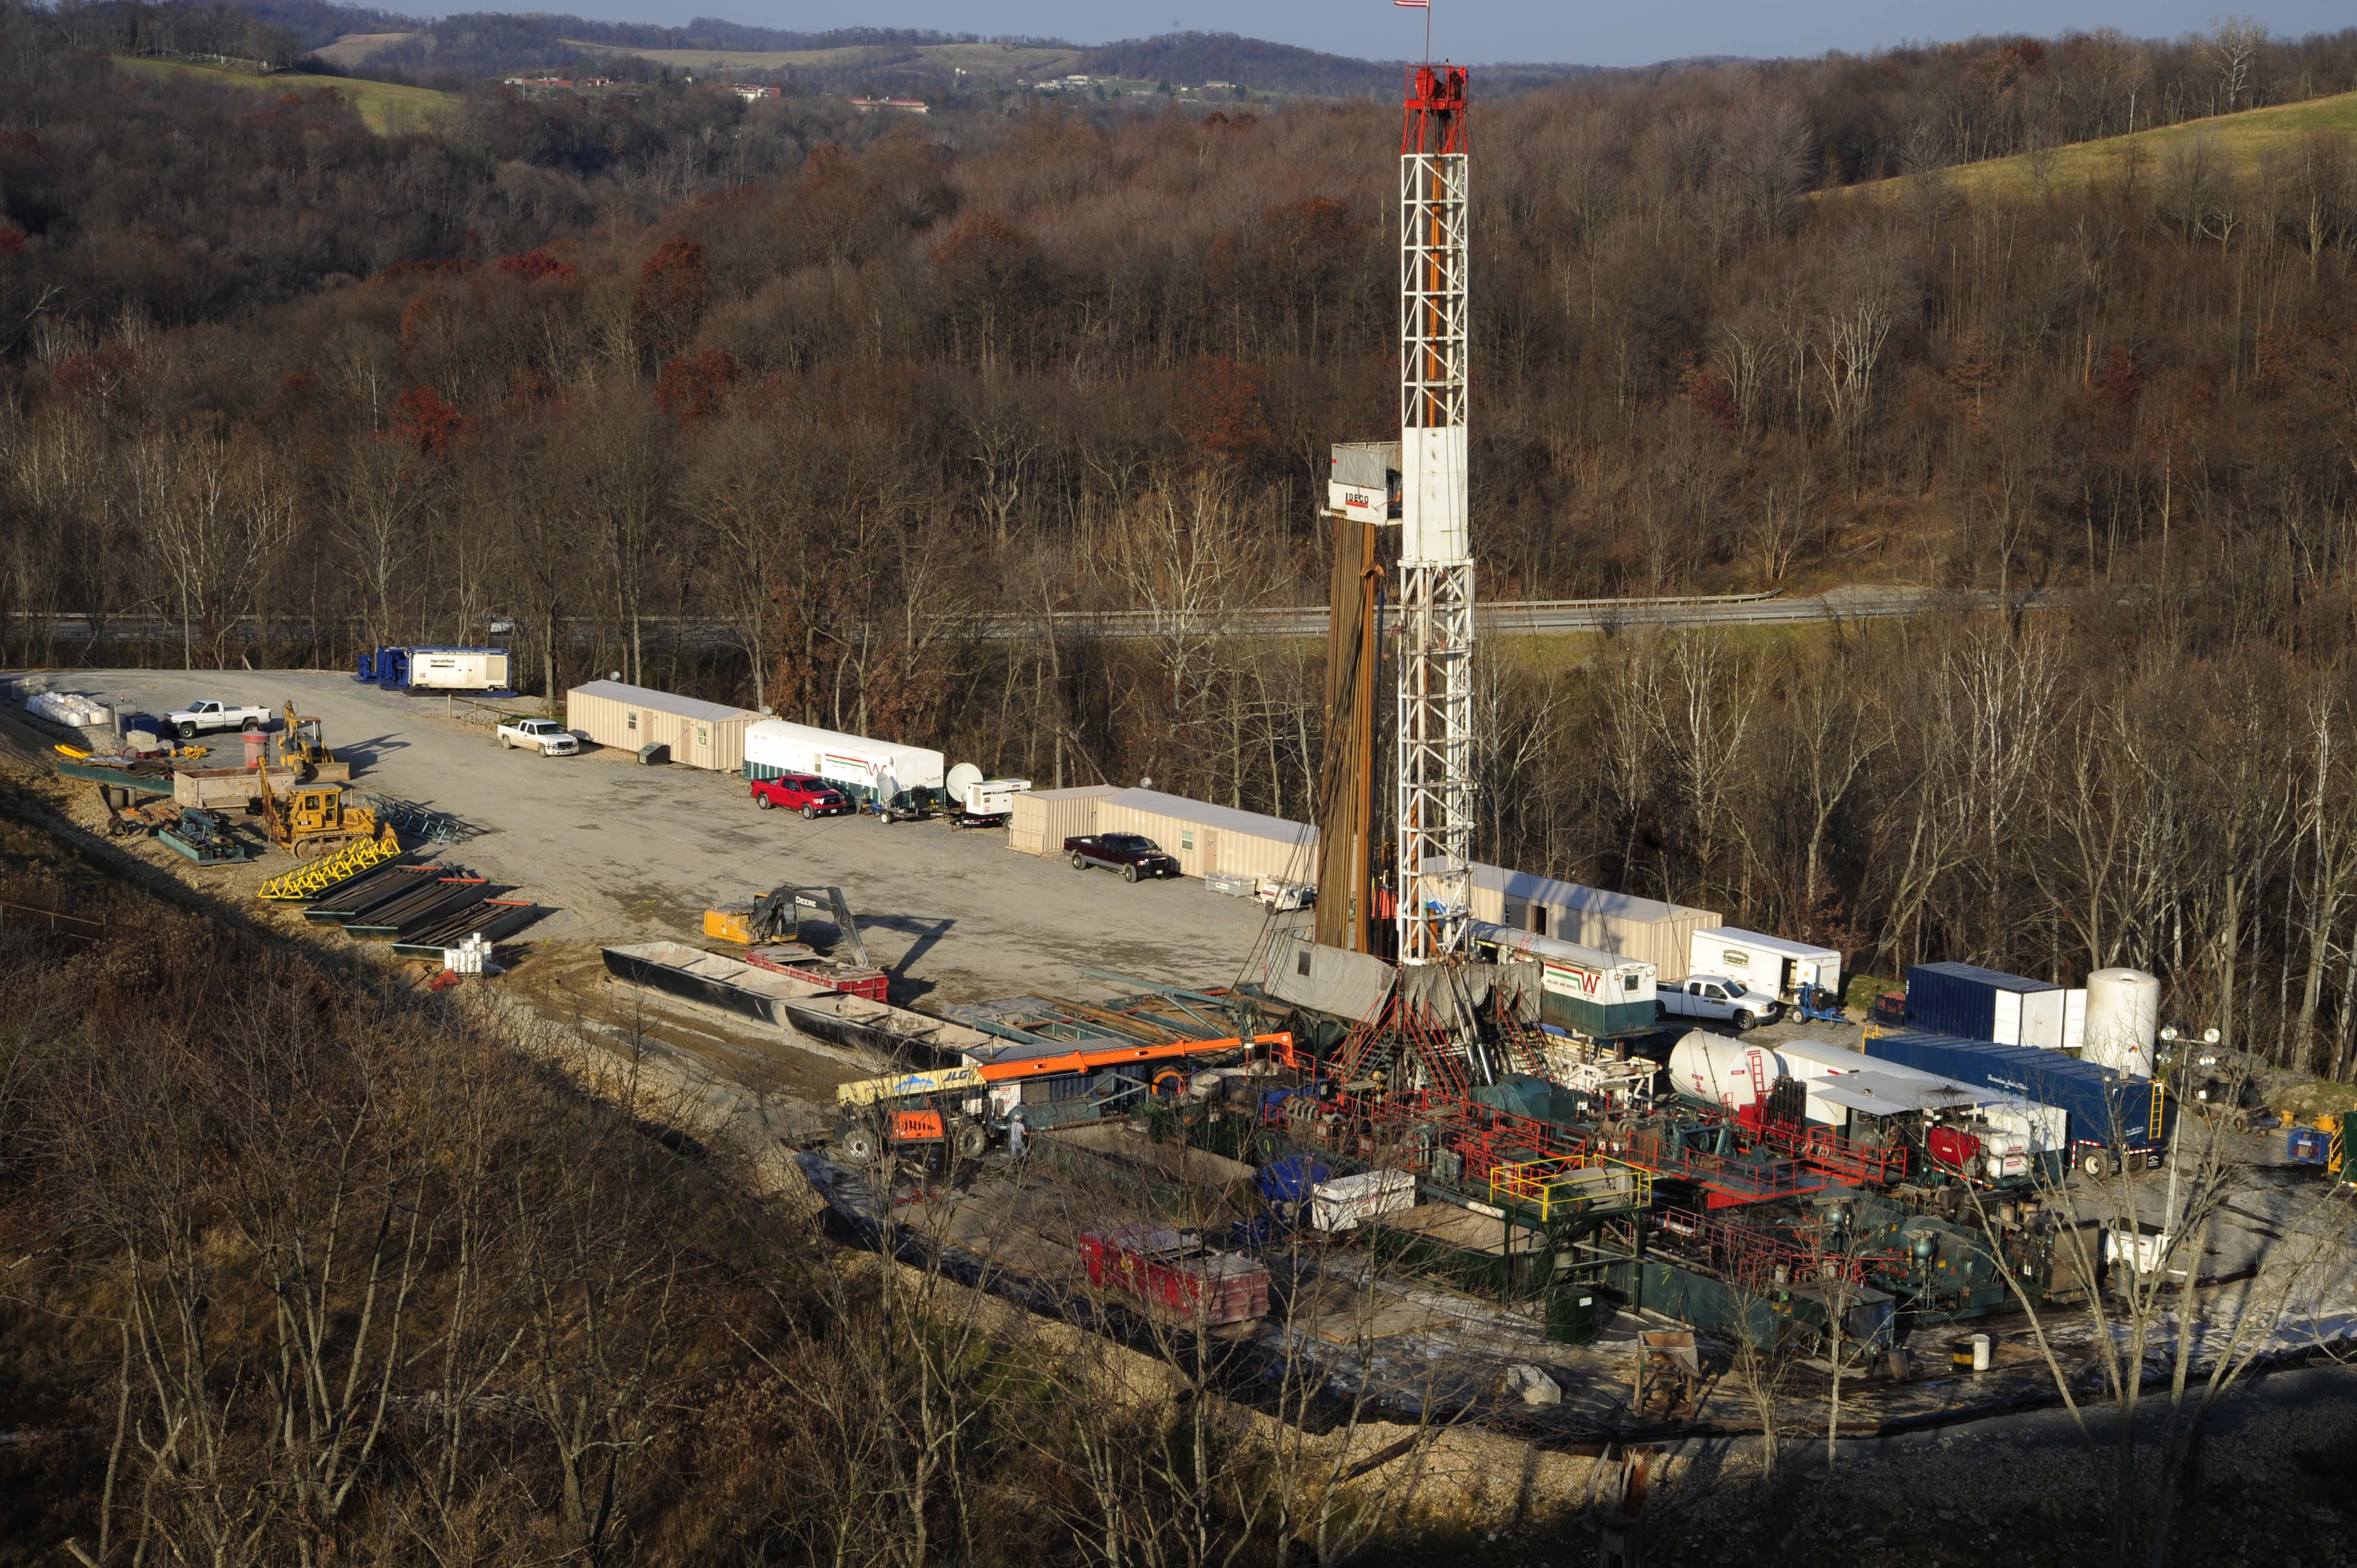
The “Shale Revolution” brought on by high-volume hydraulic fracturing (fracking) in this region encompasses thousands of wells drilled into the Marcellus and Utica-Point Pleasant shale plays across much of the Allegheny Plateau. This area spans from north of Scranton-Wilkes Barre, Pennsylvania, just outside the Catskills Mountains to the East in Susquehanna County, Pennsylvania, and down to the West Virginia counties of Logan, Boone, and Lincoln.  The westernmost extent of the fracking experiment in the Marcellus and Utica shale plays is in Noble and Guernsey Counties in Ohio.

Along the way, producing wells have exhibited steeper and steeper declines during the first five years of production, leading the industry to develop what they refer to as “super laterals.” These laterals (the horizontal portion of a well) exceed 3 miles in length and require in excess of 15 million gallons of freshwater and 15,000 tons of silica sand (aka, “proppant”)[1].

The resource-intense super laterals are one way the industry is dealing with growing pressure from investors, lenders, the media, state governments, and the public to reduce supply costs and turn a profit, while also maintaining production. (Note: unfortunately these sources of pressures are listed from most to least concerning to industry itself!)

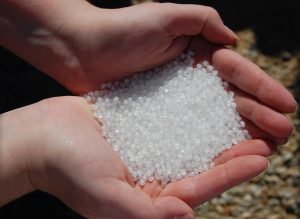
Another way the fracking industry is hoping to make a profit is by investing in the region’s natural gas liquids (NGLs), such as ethane, propane, and butane, to support the petrochemical industry.

The Appalachian Storage Hub

Continued oil and gas development are part of a nascent effort to establish a mega-infrastructure petrochemical complex,  the Appalachian Storage Hub (ASH). For those that aren’t familiar with the ASH it could be framed as the fracking industry’s last best attempt to lock in their necessity across Appalachia and nationwide. The ASH was defined in the West Virginia Executive as a way to revitalize the Mountain State and would consist of the following:

“a proposed underground storage facility that would be used to store and transport natural gas liquids (NGLs) extracted from the Marcellus, Utica and Rogersville shales across Kentucky, Ohio, Pennsylvania and West Virginia. Construction of this hub would not only lead to revenue and job creation in the natural gas industry but would also further enable manufacturing companies to come to the Mountain State, as the petrochemicals produced by shale are necessary materials in most manufacturing supply chains…[with] the raw materials available in the region’s Marcellus Shale alone…estimated to be worth more than $2 trillion, and an estimated 20 percent of this shale is composed largely of ethane, propane and butane NGLs that can be utilized by the petrochemical industry in the manufacturing of consumer goods.”

This is yet another example of fracking rhetoric that appeals to American’s sense of patriotism and need for cheaper consumer goods (in this case, plastics), given that they are seeing little to no growth in wages.

While a specific location for underground storage has not been announced, the infrastructure associated with the ASH (such as pipelines, compressor stations, and processing stations) would stretch from outside Pittsburgh down to Catlettsburg, Kentucky, with the latter currently the home of a sizeable Marathon Oil refinery. The ASH “would act like an interstate highway, with on-ramps and off-ramps feeding manufacturing hubs along its length and drawing from the available ethane storage fields. The piping would sit above-ground and follow the Ohio and Kanawha river valley.”

The politics of the ASH – from Columbus and Charleston to Washington DC

Elected officials across the quad-state region are supporting this effort invoking, not surprisingly, its importance for national security and energy independence.

State-level support

West Virginia Senator Joe Manchin (D) went so far as to introduce “Senate Bill 1064 – Appalachian Energy for National Security Act.”  This bill would require Secretary of Energy Rick Perry and his staff to “to conduct a study on the national security implications of building ethane and other natural-gas-liquids-related petrochemical infrastructure in the United States, and for other purposes.”

Interestingly, the West Virginia Senator told the West Virginia Roundtable Inc’s membership meeting that the study would not examine the “national security implications” but rather the “additional security benefits” of an Appalachian Storage Hub and cited the following to pave the way for the national security study he is proposing: “the shale resource endowment of the Appalachian Basin is so bountiful that, if the Appalachian Basin were an independent country, the Appalachian Basin would be the third largest producer of natural gas in the world.”

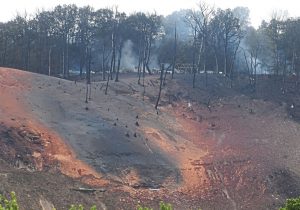
Senator Manchin is not the only politician of either party to unabashedly holler from the Appalachian Mountaintops the benefits of the ASH. Former Ohio Governor, and 2016 POTUS primary participant, John Kasich (R) has been a fervent supporter of such a regional planning scheme. He is particularly outspoken in favor of the joint proposal by Thailand-based PTT Global Chemical and Daelim to build an ethane cracker in Dilles Bottom, Ohio, across the Ohio River from Moundsville, West Virginia. The ethane cracker would convert the region’s fracked ethane into ethylene to make polyethylene plastic. This proposed project could be connected to the underground storage component of the ASH.

The Democratic Pennsylvania Governor Tom Wolf has consistently advocated for the project, going so far as to sign “an unprecedented agreement at the Tri-State Shale Summit, promising collaboration between the states in securing crackers for the region and, by extension, support of the storage hub.”

Dilles Bottom, OH ethane cracker site. Photo by Ted Auch, aerial assistance provided by LightHawk.

Not to be outdone in the ASH cheerleading department, West Virginia Governor Jim Justice (R), who can’t seem to find any common ground with Democrats in general nor Senator Manchin specifically, is collaborating with quad-state governors on the benefits of the ASH. All the while, these players ignore or dismiss the environmental, social, and economic costs of such an “all in” bet on petrochemicals and plastics.

Even the region’s land-grant universities have gotten in on the act, with West Virginia University’s Appalachian Oil and Natural Gas Research Consortium and Energy Institute leading the way. WVU’s Energy Institute Director Brian Anderson pointed out that, “Appalachia is poised for a renaissance of the petrochemical industry due to the availability of natural gas liquids. A critical path for this rebirth is through the development of infrastructure to support the industry. The Appalachian Storage Hub study is a first step for realizing that necessary infrastructure.”

National-level support

The Trump administration, with the assistance of Senator Manchin’s “Senate Bill 1337 – Capitalizing on American Storage Potential Act”, has managed to stretch the definition of the Department of Energy’s Title XVII loan guarantee to earmark $1.9 billion for the Appalachian Development Group, LLC (ADG) to develop the ASH, even though any project that receives such a loan must:

  1. utilize a new or significantly improved technology;
  2. avoid, reduce or sequester greenhouse gases;
  3. be located in the United States; and,
  4. have a reasonable prospect of repayment.

This type of Public-Private Investment Program  is central planning at its finest, in spite of the likelihood that the prospects of the ASH meeting the second and fourth conditions above are dubious at best (even if the project utilizes carbon capture and storage technologies).

Public-Private Investment Programs have a dubious past. In her book “Water Wars,” Vandana Shiva discusses the role of these programs globally and the involvement of institutions like the World Bank and International Monetary Fund:

“public-private partnerships”…implies public participation, democracy, and accountability.  But it disguises the fact that the public-private partnership arrangements usually entail public funds being available for the privatization of public goods…[and] have mushroomed under the guise of attracting private capital and curbing public-sector employment.”

In response to the Department of Energy’s Title XVII largesse, Congresswoman Pramila Jayapal and Ilhan Omar introduced Amendment 105 in Rule II on HR 2740. According to Food and Water Watch, this amendment would restrict “the types of projects the Department of Energy could financially back. It would block the funding for ALL projects that wouldn’t mitigate climate change.”

On Wednesday, June 19th Congress voted 233-200 along party lines to pass the amendment, preventing funds from the Energy Policy Act of 2005  to be provided to any “project that does not avoid, reduce, or sequester air pollutants or anthropogenic emissions of greenhouse gases”.

International interest

The only condition of Department of Energy’s Title XVII loan program ASH is guaranteed to meet is the third (be located in the United States), but as we’ve already mentioned, the level of foreign money involved complicates the domestic facade.

Foreign involvement in the ASH lends credence to Senator Manchin’s and others’ concerns about where profits from the ASH will go, and who will be reaping the benefits of cheap natural gas. The fact that the ASH is being heavily backed by foreign money is the reason Senator Manchin raised an issue with the outsized role of state actors like Saudi Arabia and China as well as likely state-backed private investments like PTT Global Chemical’s. The Senator even cited how a potential $83.7 billion investment in West Virginia from China’s state-owned energy company, China Energy, would compromise “domestic manufacturing and national security opportunities.”

“Critical” infrastructure

With all of the discussion and legislation focused on energy and national security, many don’t realize the output of the ASH would be the production of petroleum-based products: mainly plastic, but also fertilizers, paints, resins, and other chemical products.

Not coincidentally, Republican Ohio State Representatives George Lang and Don Jones just introduced House Bill 242, and attempt to support the plastic industry by “prohibit[ing] the imposition of a tax or fee on [auxiliary or plastic] containers, and to apply existing anti-littering law to those containers.”

There will most certainly be a battle in the courts between the state and urban counties like Cuyahoga County, Ohio, who’s council just voted to ban plastic bags countywide on May 28.

Bills like this and the not unrelated “critical infrastructure” bills being shopped around by the American Legislative Exchange Council will amplify the rural vs urban and local vs state oversight divisions running rampant throughout the United States.  The reason for this is that yet another natural resource boom/bust will be foisted on Central Appalachia to fuel urban growth and, in this instance, the growth and prosperity of foreign states like China.

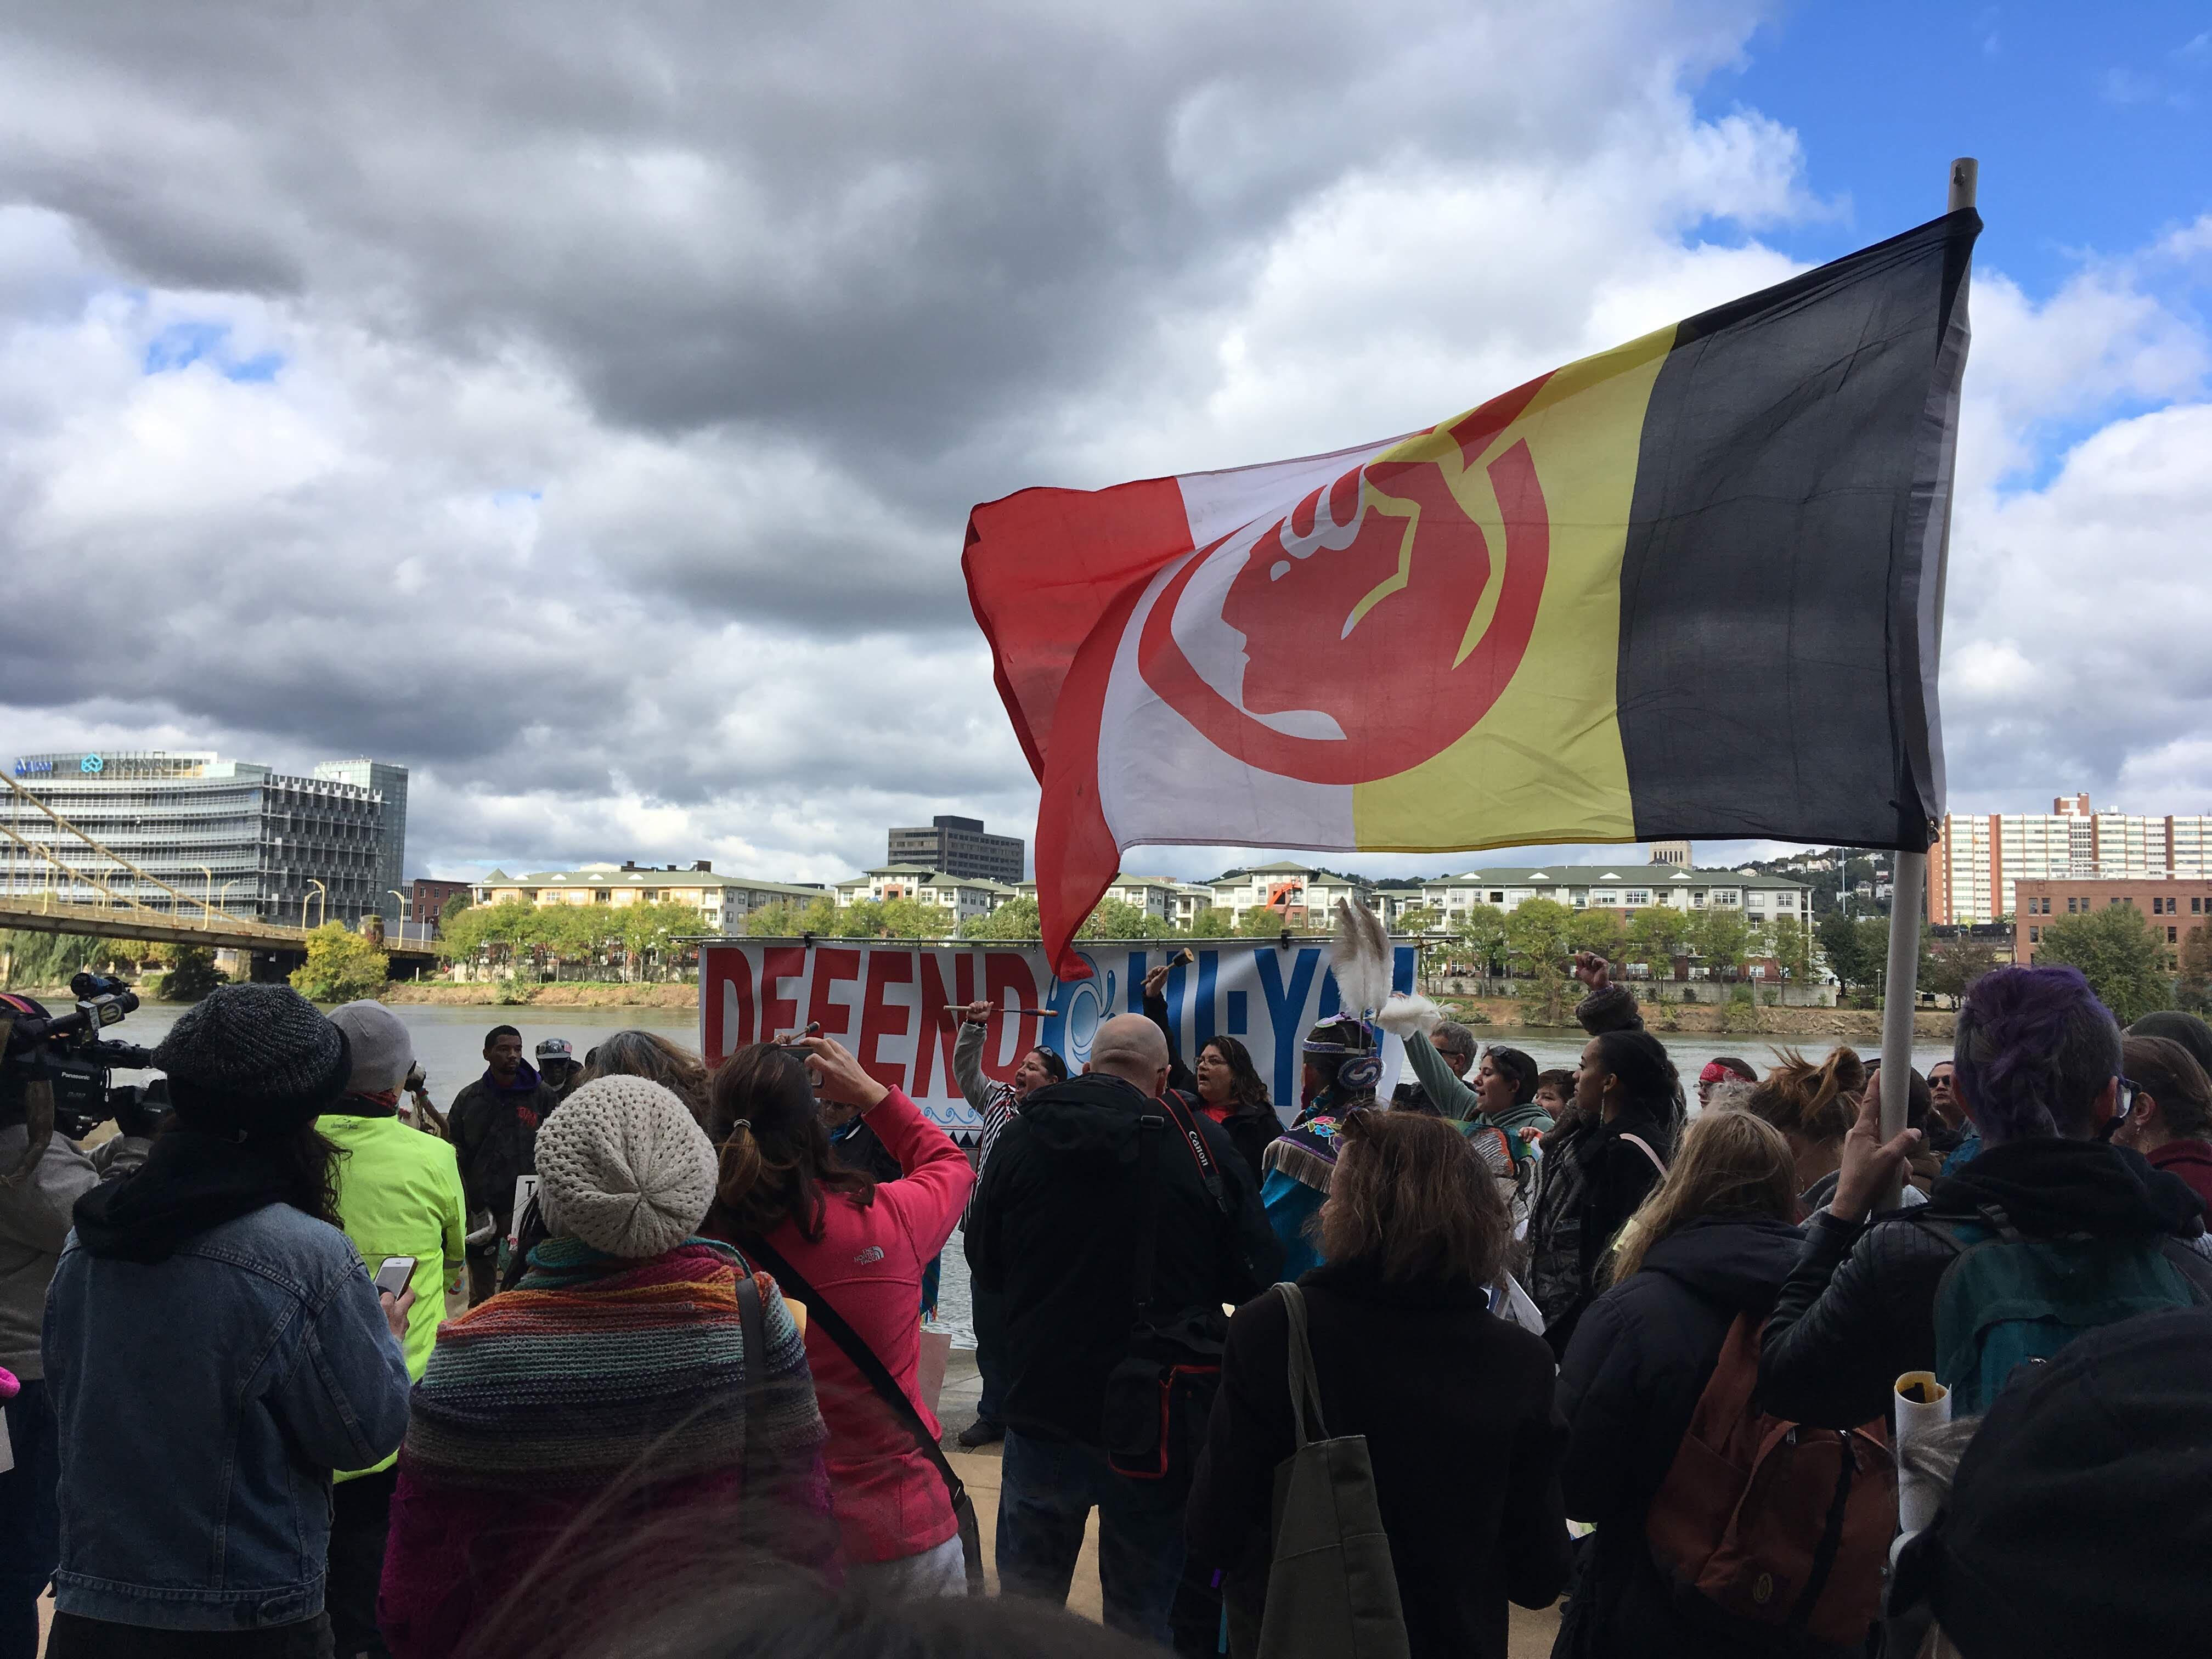
Instead of working night and day to advocate for Appalachia and Americans more broadly, we have legislation in statehouses around the country that would make it harder to demonstrate or voice concerns about proposals associated with the ASH and similar regional planning projects stretching down into the Gulf of Mexico.

Producing wells mapped

Impacts from the ASH and associated ethane cracker proposals will include but are not limited to: an increase in the permitting of natural gas wells, an increase in associated gas gathering pipelines across the Allegheny Plateau, and an exponential increase in the production of plastics, all of which are harmful to the region’s environment and the planet.

The production of the region’s fracked wells will determine the long-term viability of the ASH. From our reading of things, the permitting trend we see in Ohio will have to hit another exponential inflection point to “feed the beast” as it were. Figure 1 shows an overall decline in the number of wells drilled monthly in Ohio.

Figure 2, below it, shows the relationship between the number of wells that are permitted verse those that are actually drilled.

Figures 1. Monthly (in blue) and cumulative (in orange) unconventional oil and gas wells drilled in Ohio, January, 2013 to November, 2018


 Figure 2. Permitted Vs Drilled Wells in Ohio, January, 2013 to November, 2018

That supply-demand on steroids interaction will likely result in an increased reliance on “super laterals” by the high-volume hydraulic fracturing industry. These laterals require 5-8 times more water, chemicals, and proppant than unconventional laterals did between 2010 and 2012.

Given this, we felt it critical to map not just the environmental impacts of this model of fracking but also the nuts and bolts of production over time. The map below shows the supply-demand links between the fracking industry and the ASH, not as discrete pieces or groupings of infrastructure, but rather a continuum of up and downstream patterns.

The current iteration of the map shows production values for oil, natural gas, and natural gas liquids, how production for any given well changes over time, and production declines in newer wells relative to those that were fracked at the outset of the region’s “Shale Revolution.” Working with volunteer Gary Allison, we have compiled and mapped monthly (Pennsylvania and West Virginia) and quarterly (Ohio)[2] natural gas, condensate, and natural gas liquids from 2002 to 2018.

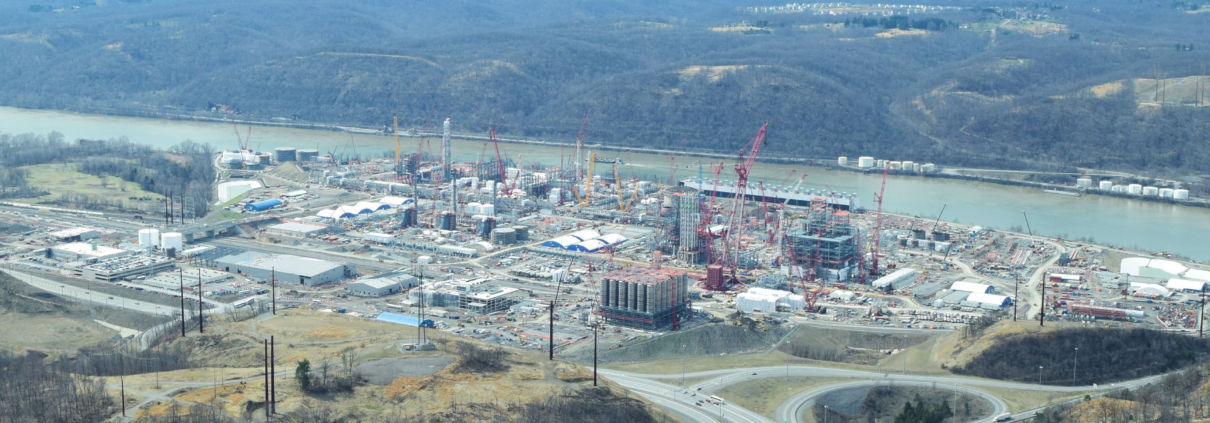
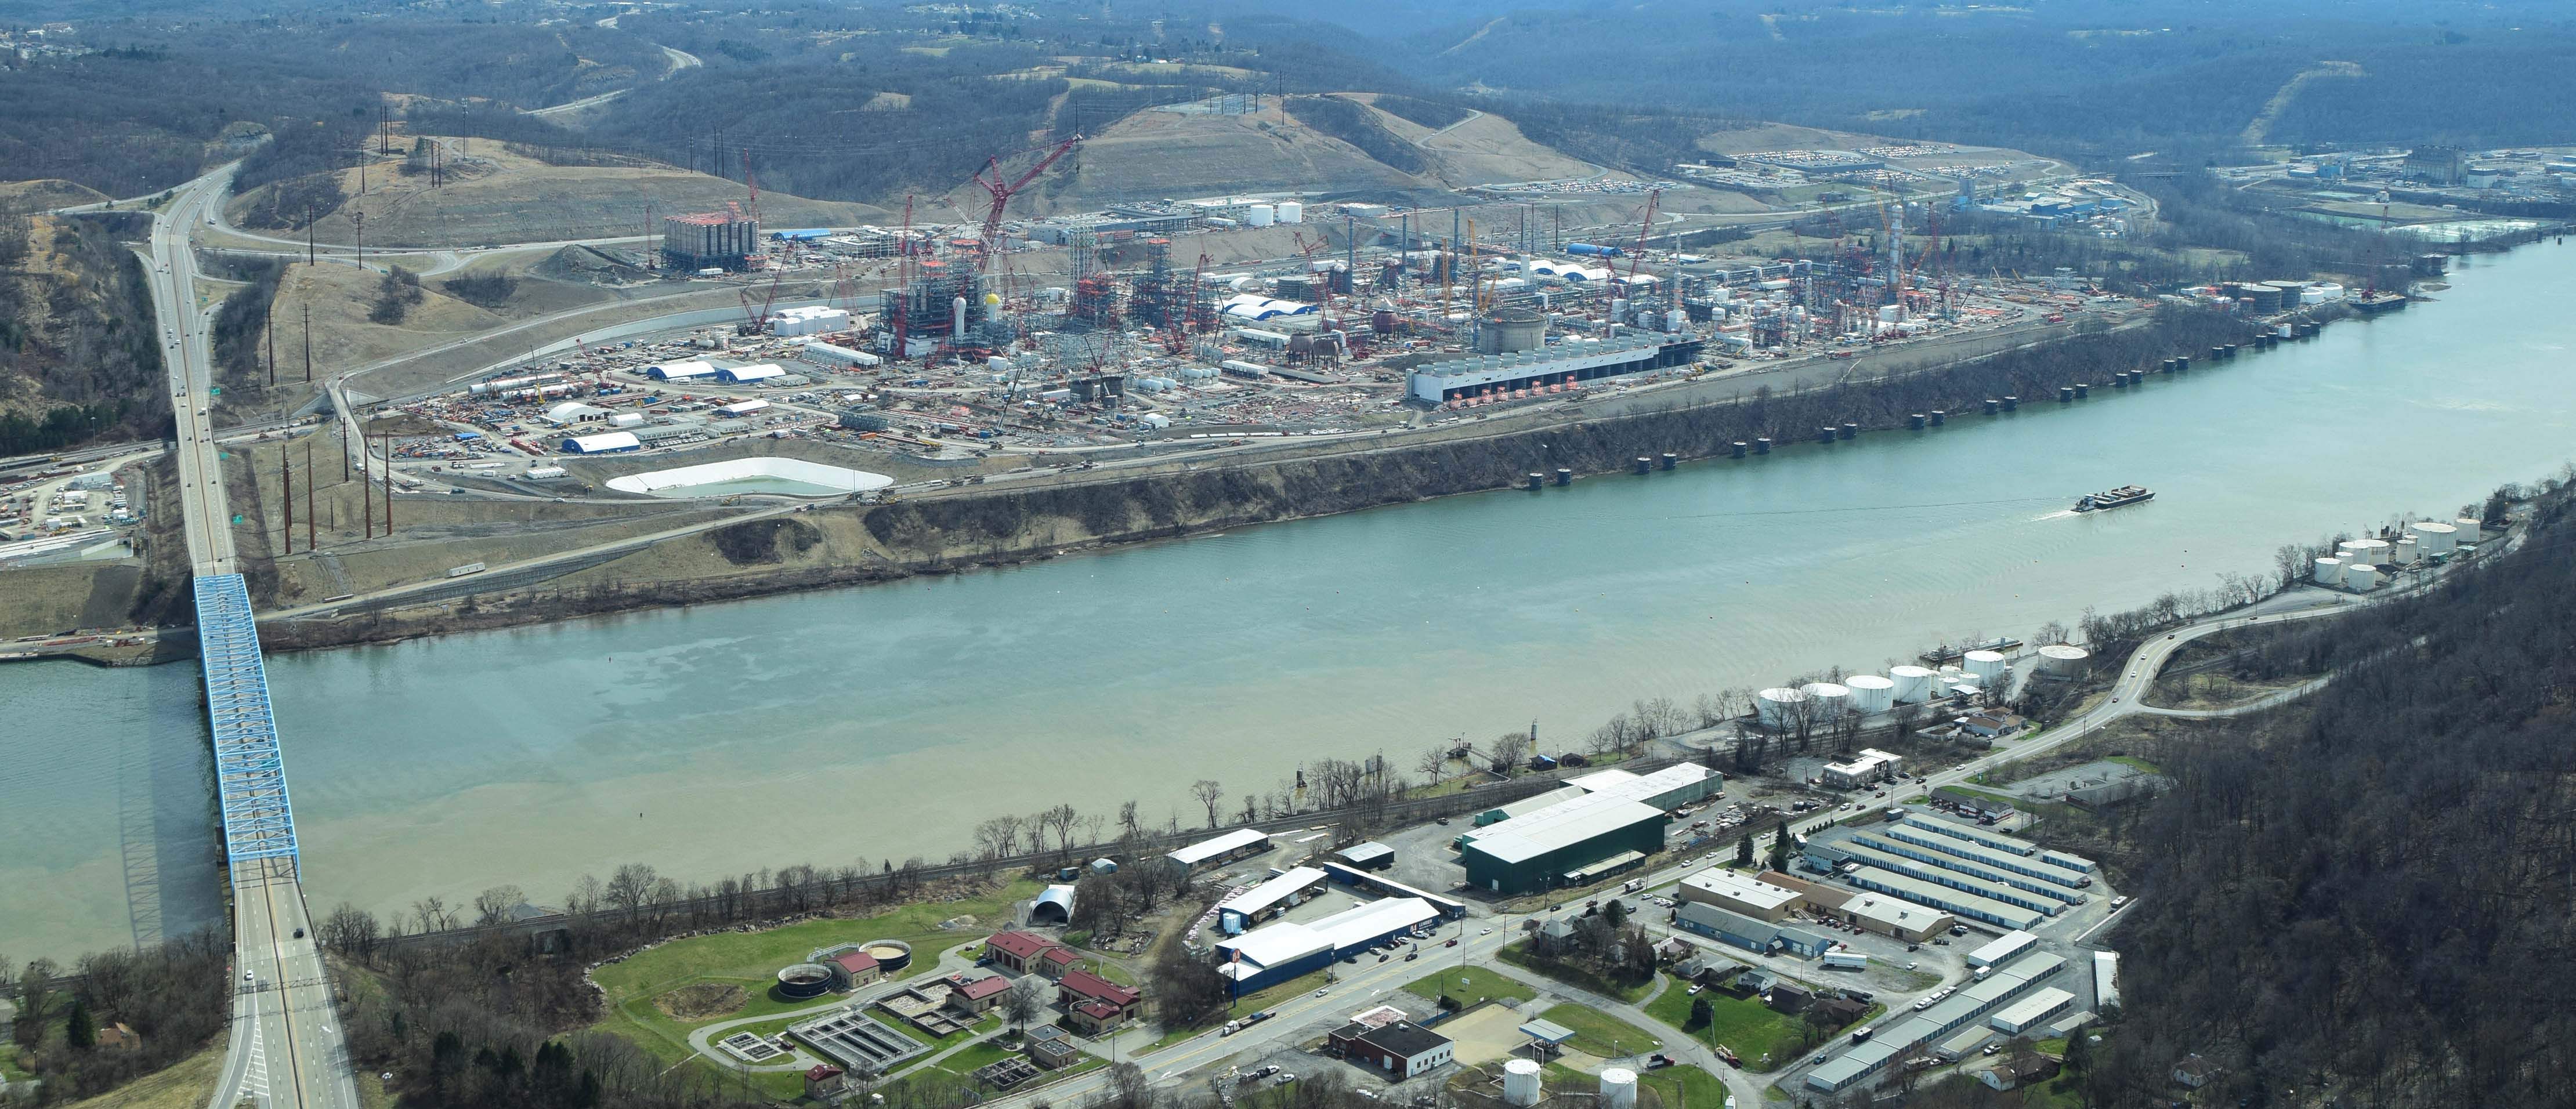
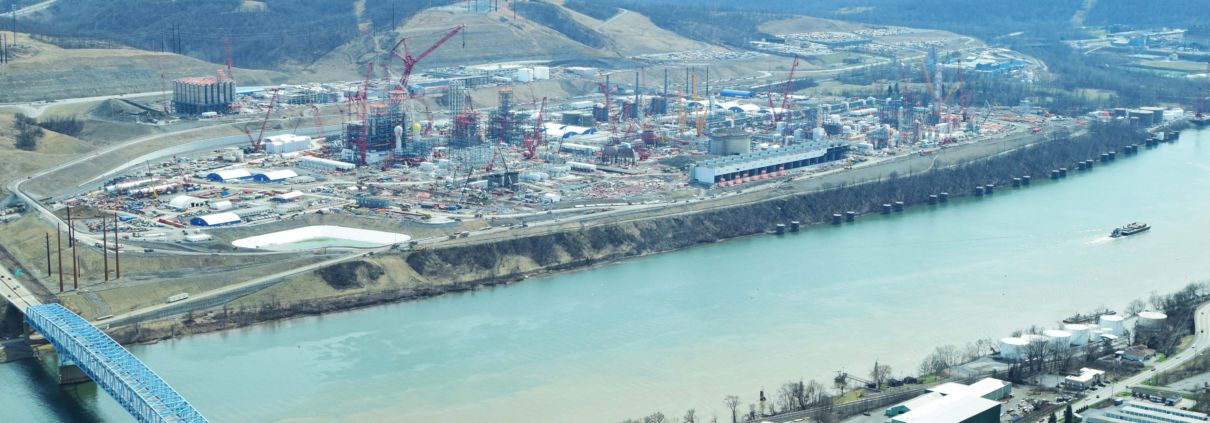
This map includes 15,682 producing wells in Pennsylvania, 3,689 in West Virginia, and 2,064 in Ohio. We’ve also included and will be updating petrochemical projects associated with the ASH, either existing or proposed, across the quad-states including the proposed ethane cracker in Dilles Bottom, Ohio and the ethane cracker under construction in Beaver County, Pennsylvania, along with two rumored projects in West Virginia.


View Map Full Screen

Conclusion

We will continue to update this map on a quarterly basis, will be adding Kentucky data in the coming months, and will be sure to update rumored/proposed petrochemical infrastructure as they cross our radar. However, we can’t be everywhere at once so if anyone reading this hears of legitimate rumors or conversations taking place at the county or township level that cite tapping into the ASH’s infrastructural network, please be sure to contact us directly at info@fractracker.org.

By Ted Auch, Great Lakes Program Coordinator, FracTracker Alliance with invaluable data compilation assistance from Gary Allison

Feature Photo: Ethane cracker plant under construction in Beaver County, PA. Photo by Ted Auch, aerial assistance provided by LightHawk.

[1] For a detailed analysis of the HVHF’s increasing resource demand and how lateral length has increased in the last decade the reader is referred to our analysis titled “A Disturbing Tale of Diminishing Returns in Ohio” Figures 12 and 13.

[2] Note: For those Bluegrass State residents or interested parties, Kentucky data is on its way!

Permitting New Oil and Gas Wells Under the Newsom Administration

California regulators halt well permitting after Consumer Watchdog and FracTracker reveal a surge in well permits under California Governor Newsom

October 24th, 2019 update: 

There have been several exciting updates since FracTracker Alliance and Consumer Watchdog released a report on fracking and regulatory corruption under Governor Newsom’s administration, detailed in the article below.

On July 11th, 2019, immediately following the report’s release, Governor Newsom fired Ken Harris, head of California’s Division of Oil, Gas, and Geothermal Resources (DOGGR).

Newsom’s chief of staff Ann O’Leary stated:
“The Governor has long held concerns about fracking and its impacts on Californians and our environment, and knows that ultimately California and our global partners will need to transition away from oil and gas extraction. In the weeks ahead, our office will work with you to find new leadership of (the division) that share this point of view and can run the division accordingly.”
FracTracker Alliance supports the governor’s decision and hopes that new leadership acts in the best interests of Californians while moving the state towards 100% renewable energy.

Two months later in September, it was announced that no new fracking permits had been approved in California since the report was issued. We’re thrilled to see this immediate cessation. Yet, while new fracking activity has halted, other forms of oil and gas development continue to threaten Californian’s health and natural resources.

FracTracker Alliance’s review of public records found that DOGGR issued approximately 1,200 permits for steam injection and other “enhanced recovery” techniques through September 2nd, a 60% increase from the 749 permits issued in the same period last year. Sources within DOGGR revealed that at least 40 illegal oil spills from wells were ongoing in Kern and Santa Barbara Counties.

A final development came on October 12th, when Governor Newsom signed a bill to prevent oil and gas development on state lands. As state lands often neighbor federal lands, this bill will play a role in protecting federal land from pipelines, wells, and other polluting infrastructure. Newsom also changed the name of DOGGR to the “Geologic Energy Management Division,” and modified its mission to include protecting public health and environmental quality.

We remain hopeful that Newsom will take a bold stance in leading California away from fossil fuels.

Original July 11th, 2019 FracTracker article:

FracTracker Alliance and Consumer Watchdog have uncovered new data showing an increase in oil and gas permitting by California regulators in 2019 compared to 2018, calling into question Governor Gavin Newsom’s climate commitment. Even more concerning, this investigation found that state regulators are heavily invested in the oil companies they regulate.

FracTracker Alliance’s new report with Consumer Watchdog compares oil and gas permitting policies of the current Governor Gavin Newsom’s administration with that of former Governor Jerry Brown’s administration.

The former lieutenant governor to Brown, Governor Newsom has set out to make a name for himself. As part of stepping out of Brown’s shadow, Newsom has expressed support for a Just Transition away from fossil fuels. Governor Newsom’s 2020 budget plan includes environmental justice measures and an unprecedented investment to plan for this transition that includes investments in job training.

Yet five months into Governor Newsom’s first term, regulators are on track to allow companies to drill and “frack” more new oil and gas wells than Brown allowed in 2018. The question now is: will Governor Newsom actually take the next step that Brown could not, and prioritize the reduction of oil extraction in California?

In addition, the Consumer Watchdog report reveals that eight California regulators with the Division of Oil, Gas, and Geothermal Resources (DOGGR) are heavily invested in the oil companies they regulate. FracTracker and Consumer Watchdog are calling for the the removal of DOGGR officials with conflicts of interest, and an immediate freeze on new well approval. Read the letter to Governor Newsom here.

Governor Brown’s Legacy

Around the world, Brown is recognized as a climate warrior. His support of solar energy technology and criticisms of the nuclear and fossil fuel industry was ultimately unique in the late 1970’s.

In 1980, during his second term as Governor and short presidential campaign, he decried that fellow democrat and incumbent President Jimmy Carter had made a “Faustian bargain” with the oil industry. Since then, he has continued to push for state controls on greenhouse gas emissions. To end his political career, Brown hosted an epic climate summit in San Francisco, California, which brought together climate leaders, politicians, and scientists from around the world.

While Brown championed the reduction of greenhouse gas emissions, his policies in California were contradictory. While front-line communities called for setbacks from schools, playgrounds, hospitals and other sensitive receptors, Brown ignored these requests. Instead he sought to spur oil production in the state. Brown even used state funds to explore his private properties for oil and mineral resources that could be exploited for personal profit.

Brown’s terms in the Governor’s office show trends of increasing oil and gas production. The chart in Figure 1 shows that during his first term (1979-1983), California oil extraction grew towards a peak in production. Then in 2011 at the start of Brown’s second term (2011-2019), crude oil production again inflected and continued to increase through 2015, ending a 25-year period of relatively consistent reduction.

We are therefore interested in looking at existing data to understand if moving forward, Governor Newsom will continue Brown’s legacy of support for California oil production. We start by looking at the first half of 2019, the beginning of Governor Newsom’s term, to see if his administration will also allow the oil and gas industry to increase extraction in California.

Figure 1. Chart of California’s historic oil production, from the EIA

Analysis

The FracTracker Alliance has collaborated with the non-profit Consumer Watchdog to review records of oil and gas well permits issued in 2018 and thus far into 2019.

Records of approved permits were obtained from the CA Department of Conservation’s Division of Oil Gas and Geothermal Resources (DOGGR). Weekly summaries of approved permits for the 52 weeks of 2018 and the first 22 weeks of 2019 (January 1st-June 3rd) were compiled, cleaned, and analyzed. Notices of well stimulations were also included in this analysis. The data is mapped here in the Consumer Watchdog report, as well as in more detail below in the map in Figure 2.

Figure 2. Map of California’s Permits, 2018 and 2019


View map fullscreen | How FracTracker maps work

Findings

At FracTracker, we are known for more than simply mapping, so we have, of course, extracted all the information that we can from this data. The dataset of DOGGR permits included details on the type of permit as well as when, where, and who the permits were granted. With this information we were able to answer several questions.

Of particular note and worthy of prefacing the data analysis was the observation of the very low numbers of permits granted in the LA Basin and Southern California, as compared to the Central Valley and Central Coast of California.

First, what are the types of permits issued?

Regulators require operators to apply for permits for a number of activities at well sites. This dataset includes permits to drill wells, including re-drilling existing wells, permits to rework existing wells, and permits to “sidetrack”. Well stimulations using techniques such as hydraulic fracturing and acid fracturing also require permits, as outline in CA State Bill 4.

How many permits have regulators issued?

In 2018, DOGGR approved 4,368 permits, including 2,124 permits to drill wells. In 2019, DOGGR approved 2,366 permits from January 1 – June 3, including 1,212 permits to drill wells. At that rate, DOGGR will approve 5,607 total permits by the end of 2019, including 2,872 wells.

That is an increase of 28.3% for total permits and an increase of 35.3% for drilling oil and gas wells.

DOGGR also issued 222 permits for well stimulations in 2018. So far in 2019, DOGGR has issued 191 permits for well stimulations, an increase of 103.2%.

Who is applying for permits?

As shown in Table 1 below, the operators Chevron U.S.A. Inc., Aera Energy LLC ( a joint conglomerate of Shell Oil Company and ExxonMobil), and Berry Petroleum Company, LLC dominate the drilling permit counts for both 2018 and 2019.

Aera has obtained the most drilling permits thus far into 2019, while Chevron obtained the most permits in 2018, almost 100 more than Aera. In 2019, Chevron was issued almost 3 times the amount of rework permits as Aera, and both have outpaced Berry Petroleum.

Table 1. Permit Counts by Operator

Where are the permits being issued?

Data presented in Table 2 indicate which fields are being targeted for drilling and rework permits. While the 2019 data represents less than half the year, the number of drilling permits is almost equal to the total drilling permit count for 2018.

Majority players in the Midway-Sunset field are Berry Petroleum and Chevron. South Belridge is dominated by Aera Energy and Berry Petroleum. The Cymric field is mostly Chevron and Aera Energy; McKittrick is mostly Area Energy and Berry Petroleum. The Kern River field, which has by far the most reworks (most likely due to its massive size and age) is entirely Chevron.

Table 2. Permit Counts by Field

Conclusions

Be sure to also read the Consumer Watchdog report on FracTracker’s permit data!

The details of this analysis show that DOGGR has allowed for a modest increase in permits for oil and gas wells in 2019. The increase in well stimulations in 2019 is estimated to be larger, at 103.2%.

There was the consideration that this could be a seasonal phenomenon since we extrapolated from data encompassing just less than the first half of the year. But upon reviewing data for several other years, that does not seem to be the case. The general trend was instead increasing numbers of permits as each year progresses, with smaller permit counts through the first half of the year.

Oil prices do not provide much explanation either. The chart in Figure 3 shows that crude prices were higher in 2018 than they have been for the vast majority of 2019. The increase in permits could be the result of oil and gas operators like Chevron and Aera anticipating a stricter regulatory climate under Governor Newsom. Operators may be securing  as many permits as possible, while DOGGR is still liberally issuing them. This could be a consequence of the Governor’s recognition of the need for California to begin a managed decline of fossil fuel production and end oil drilling in California.

Could this be an early industry death rattle?

Figure 3. Crude prices in 2018 and 2019

By Kyle Ferrar, Western Program Coordinator, FracTracker Alliance

Mapping the Petrochemical Build-Out Along the Ohio River

New maps show the build-out of oil and gas infrastructure that converts the upper Ohio River Valley’s fracked gas into petrochemical products

In 2004, Range Resources purchased land in Washington County, Pennsylvania and “fracked” the first well in the Marcellus Shale, opening the flood gates to a wave of natural gas development.

Since then, oil and gas companies have fracked thousands of wells in the upper Ohio River Valley, from the river’s headwaters in Pennsylvania, through Ohio and West Virginia, and into Kentucky.

Industry sold natural gas as a “bridge fuel” to renewable energy, but 15 years since the first fracked Marcellus well, it’s clear that natural gas is more of a barrier than a bridge. In fact, oil and gas companies are not bridging towards clean energy at all, but rather investing in the petrochemical industry- which converts fracked gas into plastic.

This article dives into the expanding oil, gas, and petrochemical industry in the Ohio River Valley, with six maps and over 16,000 data points detailing the build-out of polluting infrastructure required to make plastic and other petrochemical products from fossil fuels.

Download the maps


Unconventional and Injection Wells


Pipelines


Natural Gas and NGL Storage


Oil and Gas Processing


Petrochemical Processing and Manufacturing


Oil, Gas, and Petrochemical Map


Fracking for plastic

The petrochemical industry is expanding rapidly, with $164 billion planned for new infrastructure in the United States alone. Much of the build-out involves expanding the nation’s current petrochemical hub in the Gulf Coast, yet industry is also eager to build a second petrochemical hub in the Ohio River Valley.

The shale rock below the Ohio River Valley releases more than methane gas used for energy. Fracked wells also extract natural gas liquids (NGLs) which the petrochemical industry manufactures into products such as plastic and resins. Investing in the petrochemical industry is one way to capitalize on gases that would otherwise be released to the atmosphere via venting and flaring. As companies continue to spend billions more on drilling than they’re bringing in, many are looking towards NGLs as their saving grace.

These maps look at a two-county radius along the upper Ohio River where industry is most heavily concentrated.

Step 1. Extraction

The petrochemical lifecycle begins at the well, and there are a lot of wells in the Ohio River Valley. The majority of the natural gas produced here is extracted from the Marcellus and Utica Shale plays, which also contain “wet gas,” or NGLs, such as ethane, propane, and butane.

Rig in Greene County, PA. Photo by Ted Auch.

12,507

active, unconventional wells in the upper Ohio River Valley

Of particular interest to the petrochemical industry is the ethane in the region, which can be “cracked” into ethylene at high temperatures and converted into polyethylene, the most common type of plastic. The Department of Energy predicts that production of ethylene from ethane in the Appalachian Basin will reach 640,000 barrels a day by 2025 – that’s 20 times the amount produced in 2013.

In our first map, we attempted to show only active and unconventional (fracked) wells, a difficult task as states do not have a uniform definition for “unconventional” or “active.” As such, we used different criteria for each state, detailed below.

This map shows 12,660 wells, including:

  • 12,507 shale oil and gas wells:
    • 5,033 wells designated as “active” and “unconventional” in Pennsylvania
    • 2,971 wells designated as “drilled,” “permitted,” or “producing,” and are drilled in the Utica-Point Pleasant and Marcellus Shale in Ohio
    • 4,269 wells designated as “active” or “drilled” in the Marcellus Shale in West Virginia
    • 234 wells designated as “horizontal” and are not listed as abandoned or plugged in Kentucky
  • 153 Class II injection wells, which are used for the disposal of fracking wastewater
    • 2 in Pennsylvania
    • 101 in Ohio
    • 42 in West Virginia
    • 8 in Kentucky

The map also shows the Marcellus and Utica Shale plays, and a line demarcating the portions of these plays that contain higher quantities of wet gas. These wet gas regions are of particular interest to the petrochemical industry. Finally, the Devonian-Ohio Shale play is visible as you zoom in.

View Map Full Screen | How FracTracker Maps Work

Step 2. Transportation

Burned hillside near Ivy Lane after the Revolution Pipeline Exploded

Site of the Revolution Pipeline explosion. Photo: Darrell Sapp, Post Gazette.

A vast network of pipelines transports the oil and gas from these wells to processing stations, refineries, power plants, businesses, and homes. Some are interstate pipelines passing through the region on their way to domestic and international markets.

A number of controversial pipeline projects cross the Ohio River Valley. Construction of the Mariner East II Pipeline is under criminal investigation, the Revolution Pipeline exploded six days after it came on line, protesters are blocking the construction of the Mountain Valley Pipeline, and the Atlantic Coast Pipeline is in the Supreme Court over permits to cross the Appalachian Trail.

Accurate pipeline data is not typically provided to the public, ostensibly for national security reasons.  The result of this lack of transparency is that residents along the route are often unaware of the infrastructure, or whether or not they might live in harm’s way. While pipeline data has improved in recent years, much of the pipeline data that exists remains inaccurate. In general, if a route is composed of very straight segments throughout the rolling hills of the Upper Ohio River Valley, it is likely to be highly generalized.

The pipeline map below includes:

  • natural gas interstate and intrastate pipelines
  • 8 natural gas liquid pipelines
  • 7 petroleum product pipelines
  • 3 crude oil pipelines
  • 18 pipeline projects that are planned or under construction for the region, including 15 natural gas pipelines and 3 natural gas liquids pipelines. To view a spreadsheet of these pipelines, click here.

View Map Full Screen | How FracTracker Maps Work

Step 3. Oil and Gas Transport and Processing

Pipelines transport oil and the natural gas stream to an array of facilities. Compressor stations and pumping stations aid the movement of the products through pipelines, while processing stations separate out the natural gas stream into its different components, including NGLs, methane, and various impurities.

At this step, a portion of the extracted fossil fuels are converted into sources of energy: power plants can use the methane from the natural gas stream to produce electricity and heat, and oil refineries transform crude oil into products such as gasoline, diesel fuel, or jet fuel.

A separate portion of the fuels will continue down the petrochemical path to be converted into products such as plastics and resins. Additionally, a significant portion of extracted natural gas leaks unintentionally as “fugitive emissions” (an estimated 2-3%) or is intentionally vented into the atmosphere when production exceeds demand.

This map shows 756 facilities, including:

  • 29 petroleum and natural gas power plants
    • 3 electric utilities
    • 24 independent power producers
    • 1 industrial combined heat and power (CHP) plant
    • 1 industrial power producer (non CHP)
  • 10 pumping stations, which assist in the transmission of petroleum products in pipelines
  • 645 compressor stations to push natural gas through pipelines
  • 21 gas processing plants which separate out NGLs, methane, and various impurities from the natural gas stream
  • 46 petroleum terminals, which are storage facilities for crude and refined petroleum products, often adjacent to intermodal transit networks
  • 3 oil refineries, which convert crude oil into a variety of petroleum-based products, ranging from gasoline to fertilizer to plastics
  • 2 petroleum ports, which are maritime ports that process more than 200 short tons (400,000 pounds) of petroleum products per year

*A small portion of these facilities are proposed or in construction, but not yet built. Click on the facilities for more information. 

View map full screen | How FracTracker Maps Work

Step 4. Storage

After natural gas is extracted from underground, transported via pipeline, and separated into dry gas (methane) and wet gas (NGLs), its components are often pumped back underground for storage. With the expansion of the petrochemical industry, companies are eager to find opportunities for NGL storage.

Underground storage offers a steady supply for petrochemical manufacturers and allows industry to adapt to fluctuations in demand. A study out of West Virginia University identified three different types of NGL storage opportunities along the Ohio and Kanawha River valleys:

  1. Mined-rock cavern: Companies can mine caverns in formations of limestone, dolomite, or sandstone. This study focused on caverns in formations of Greenbrier Limestone.
  2. Salt cavern: Developing caverns in salt formations involves injecting water underground to create a void, and then pumping NGLs into the cavern.
  3. Gas field: NGLs can also be stored in natural gas fields or depleted gas fields in underground sandstone reservoirs.

Above-ground tanks offer a fourth storage option.

Natural gas and NGL storage contains many risks. These substances are highly flammable, and accidents or leaks can be fatal. A historically industrialized region, the Ohio River Valley is full of coal mines, pipelines, and wells (including abandoned wells with unknown locations). All of this infrastructure creates passages for NGLs to leak and can cause the land above them to collapse. As many of these storage options are beneath the Ohio River, a drinking water supply for over 5 million people, any leak could have catastrophic consequences.

Furthermore, there are natural characteristics that make the geology unsuitable for underground storage, such as karst geological formations, prone to sinkholes and caves.

Notable Storage Projects

Appalachia Development Group LLC is heading the development of the Appalachia Storage & Trading Hub initiative, “a regional network of transportation, storage and trading of Natural Gas Liquids and chemical intermediates.” The company has not announced the specific location for the project’s storage component. Funding for this project is the subject of national debate; the company applied for a loan guarantee through a federal clean energy program, in a move that may be blocked by Congress.

Energy Storage Ventures LLC plans to construct the Mountaineer NGL Storage facility near Clarington, Ohio along the Ohio River. This facility involves salt cavern storage for propane, ethane, and butane. To supply the facility, the company plans to build three pipelines beneath the Ohio River: two pipelines (one for ethane and one for propane and butane) would deliver NGLs to the site from Blue Racer Natrium processing plant. A third pipeline would take salt brine water from the caverns to the Marshall County chlorine plant (currently owned by Westlake Chemical Corp).

The storage map below shows potential NGL storage sites to feed petrochemical infrastructure as well as natural gas storage for energy production:

View Map Full Screen | How FracTracker Maps Work

Step 5. Petrochemical Manufacturing

While conventional oil and gas extraction has occurred in the region for decades, and fracking for 15 years, the recent petrochemical build-out adds an additional environmental and health burdens to the Ohio River Valley. Our final map represents the facilities located “downstream” in the petrochemical process which convert fossil fuels into petrochemical products.

An image of plastic pellets

Polyethylene pellets, also called nurdles, manufactured by ethane crackers. Image source.

Ethane Crackers

Much of the petrochemical build-out revolves around ethane crackers, which convert ethane from fracked wells into small, polyethylene plastic pellets. They rely on a regional network of fracking, pipelines, compressor stations, processing stations, and storage to operate.

In 2017, Royal Dutch Shell began construction on the first ethane cracker to be built outside of the Gulf Coast in 20 years. Located in Beaver County, Pennsylvania, this plant is expected to produce 1.6 million tons of polyethylene plastic pellets per year. In the process, it will release an annual 2.2 million tons of carbon dioxide (CO2).

A second ethane cracker has been permitted in Belmont County, Ohio. Several organizations, including the Sierra Club, Center for Biological Diversity, FreshWater Accountability Project, and Earthworks have filed an appeal against Ohio EPA’s issuance of the air permit for the PTTGC Ethane Cracker.

Shell Ethane Cracker

The Shell Ethane Cracker, under construction in Beaver County, is expected to produce 1.6 million tons of plastic per year. Photo by Ted Auch, aerial assistance provided by LightHawk.

Methanol plants also convert part of the natural gas stream (methane) into feedstock for a petrochemical product (methanol). Methanol is commonly used to make formaldehyde, a component of adhesives, coatings, building materials, and many other products. In addition to methanol plants and ethane crackers, the map below also shows the facilities that make products from feedstocks, such as fertilizer (made from combining natural gas with nitrogen to form ammonia, the basis of nitrogen fertilizer), paints, and of course, plastic.

These facilities were determined by searching the EPA’s database of industrial sites using the North American Industry Classification System (NAICS).

In total, we mapped 61 such facilities:

  • 2 methanol plants (both in construction)
  • 3 ethane crackers (one in construction, one under appeal, and one uncertain project)
  • 12 petrochemical manufacturing facilities (NAICS code 32511)
  • 31 plastic manufacturing facilities
    • 2 plastic bag and pouch manufacturing facilities (NAICS code 326111)
    • 2 plastic packaging materials and unlaminated film and sheet manufacturing facilities (NAICS code 32611)
    • 2 plastic packaging film and sheet (including laminated) manufacturing facilities (NAICS code 326112)
    • 1 unlaminated plastic film and sheet (except packaging) manufacturing facility (NAICS code 326113)
    • 1 unlaminated plastics profile shape manufacturing facility (NAICS code 326121)
    • 2 laminated plastics plate, sheet (except packaging), and shape manufacturing facilities (NAICS code 32613)
    • 21 facilities listed as “all other plastics product manufacturing” (NAICS code 326199)
  • 11 paint and coating manufacturing facilities (NAICS code 325510)
  • 2 nitrogenous fertilizer manufacturing facilities (NAICS code 325311)

View Map Full Screen | How FracTracker Maps Work

Visualizing the Build-Out

How are these facilities all connected? Our final map combines the data above to show the connections between the fossil fuel infrastructure. To avoid data overload, not all of the map’s features appear automatically on the map. To add features, view the map full screen and click the “Layers” tab in the top right tool bar.

View Map Full Screen | How FracTracker Maps Work

A better future for the Valley

The expansion of oil and gas infrastructure, in addition to the downstream facilities listed above, has rapidly increased in the last few years. According to the Environmental Integrity Project, regulatory agencies in these four states have authorized an additional 15,516,958 tons of carbon dioxide equivalents to be emitted from oil and gas infrastructure since 2012. That’s in addition to emissions from older oil and gas infrastructure, wells, and the region’s many coal, steel, and other industrial sites.

View the Environmental Integrity Project’s national map of emission increases here, which also includes permit documents for these new and expanding facilities.

The petrochemical build-out will lock in greenhouse gas emissions and plastic production for decades to come, ignoring increasingly dire warnings about plastic pollution and climate change. A recent report co-authored by FracTracker Alliance found that the greenhouse gas emissions across the plastic lifecycle were equivalent to emissions from 189 coal power plants in 2019 – a number that’s predicted to rise in coming years.

What does the petrochemical build out look like in the Ohio River Valley?


But it doesn’t have to be this way. The oil and gas industry’s plan to increase plastic manufacturing capacity is a desperate attempt to stay relevant as fracking companies “hemorrhage cash” and renewable energy operating costs beat out those of fossil fuels. Investing instead in clean energy, a less mechanized and more labor intensive industry, will offer more jobs and economic opportunities that will remain relevant as the world transitions away from fossil fuels.

In fact, the United States already has more jobs in clean energy, energy efficiency, and alternative vehicles than jobs in fossil fuels. It’s time to bring these opportunities to the Ohio River Valley and bust the myth that Appalachian communities must sacrifice their health and natural resources for economic growth.

People gather at the headwaters of the Ohio River to advocate for the sustainable development of the region. Add your voice to the movement advocating for People Over Petro by signing up for the coalition’s email updates today!

Download the maps


Unconventional and Injection Wells


Pipelines


Natural Gas and NGL Storage


Oil and Gas Processing


Petrochemical Processing and Manufacturing


Oil, Gas, and Petrochemical Map


This data in this article are not exhaustive. FracTracker will be updating these maps as data becomes available.

By Erica Jackson, Community Outreach and Communications Specialist, FracTracker Alliance

Urban Drilling in Los Angeles

Impact of a 2,500′ Oil and Gas Well Setback in California

Why does California need setbacks?

A new bill proposed by California State Assembly Member Al Muratsuchi (D), AB345, seeks to establish a minimum setback distance of 2,500′ between oil and gas wells and sensitive sites including occupied dwellings, schools, healthcare facilities, and playgrounds. A setback distance for oil and gas development is necessary from a public health standpoint, as the literature unequivocally shows that oil and gas wells and the associated infrastructure pose a significant risk to the communities that live near them.

FracTracker Alliance conducted a spatial analysis to understand the impact a 2,500’ well setback would have on oil and gas expansion in California. In a previous report, The Sky’s Limit California (Oil Change Internal, 2018), Fractracker data showed that 8,493 active or newly permitted oil and gas wells were located within a 2,500’ buffer of sensitive sites. At the time it was estimated that 850,000 Californians lived within the setback distance of at least one of these oil and gas wells.

This does not bode well for Californians, as a recently published FracTracker literature review found that health impacts resulting from living near oil and gas development include cancer, infant mortality, depression, pneumonia, asthma, skin-related hospitalizations, and other general health symptoms. Studies also showed that health impacts increased with the density of oil and gas development, suggesting that health impacts are dose dependent. Living closer to more oil and gas sites means you are exposed to more health-threatening contamination.

An established setback is therefore necessary to alleviate some of these health burdens carried by the most vulnerable Environmental Justice (EJ) communities. Health assessments by the Los Angeles County Department of Health and studies on ambient air quality near oil fields by Occidental College Researchers support the assumption that 2,500′ is the necessary distance to help alleviate the harsh conditions of degraded air quality. Living at a distance beyond 2,500′ from an oil and gas site does not mean you are not impacted by air and water contamination. Rather the concentrations of contaminants will be less harmful. In fact studies showed that health impacts increased with proximity to oil and gas, with associated impacts potentially experienced by communities living at distances up to 9.3 miles (Currie et al. 2017) and 10 miles (Whitworth et al. 2017).

Assembly Bill 345

This analysis assesses the potential impact of State Assembly member Al Muratsuchi’s Assembly Bill 345 on California’s oil and gas extraction and production. Specifically, AB345 establishes a minimum 2,500’ setback requirement for future oil and gas development. It does not however directly address existing oil and gas permits.

The bill includes the following stipulations and definitions:

  • All new oil and gas development, that is not on federal land, are required to be located at least 2,500′ from residences, schools, childcare facilities, playgrounds, hospitals, or health clinics.
  • In this case the redrilling of a previously plugged and abandoned oil or gas well or other rework operation is to be considered new oil and gas development.
  • “Oil and gas development” means exploration for and drilling production and processing of oil, gas or other gaseous and liquid hydrocarbons; the flowlines; and the treatment of waste associated with that exploration, drilling, production, and processing.
  • “Oil and gas development” also includes hydraulic fracturing and other stimulation activities.
  • “Rework operations” means operations performed in the well bore of an oil or gas well after the well is completed and equipped for production, done for the purpose of securing, restoring, or improving hydrocarbon production in the subsurface interval that is the open to production in the well bore.
  • The bill does not include routine repairs or well maintenance work.

Map

Figure 1. Map of Wells within a 2,500′ Setback Distance from Sensitive Receptor Sites. The map below shows the oil and gas wells and permits that fall within the 2,500′ setback distance from sensitive receptor sites.  Summaries of these well counts and discussions of these well types are included below as well.

Map of Wells within a 2,500′ Setback Distance from Sensitive Receptor Sites

View map fullscreen | How FracTracker maps work


Environmental Justice

The California Environmental Justice Alliance (CEJA) has just released their 2018 Environmental Justice Agency Assessment, which used FracTracker’s data and mapping to assess environmental equity in the state regulation of oil permitting and drilling. The report issued the Division of Oil, Gas, and Geothermal Resources (DOGGR) a failing grade of ‘F’. According to the report, “DOGGR is aware that the proposed locations of many drilling activities are in or near EJ communities, but approves permits irrespective of known health and safety risks associated with neighborhood drilling.”

FracTracker’s analysis of low income communities in Kern County shows the following:

  • There are 16,690 active oil and gas production wells located in census blocks with median household incomes of less than 80% of Kern’s area median income (AMI).
  • Therefore about 25% (16,690 out of 67,327 total) of Kern’s oil and gas wells are located within low-income communities.
  • Of these 16,690 wells, 5,364 of them are located within the 2,500′ setback distance from sensitive receptor sites such as schools and hospitals (32%) vs 13.1% for the rest of the state.

For more information on the breakdown of Kern County wells, see our informational table, here.

DOGGR wells

Using freshly published Division of Oil, Gas, and Geothermal Resources (DOGGR) data (6/3/19), we find that there are 9,835 active wells that fall within the 2,500’ setback distance, representing 13.1% of the total 74,775 active wells in the state.

There are 6,558 idle wells that fall within the 2,500’ setback distance, of nearly 30,000 total idle wells in the state. Putting these idle wells back online would be blocked if the wells require reworks to restart or ramp up production. For the most part operators do not intend for most idle wells to come back online. Rather operators are just avoiding the costs of plugging and properly abandoning the wells. To learn more about this issue, see our recent coverage of idle wells here.

Of the 3,783 permitted wells not yet in production, or “new wells,” 298 (7.8%) are located within the 2,500’ buffer zone.

Getting a count of plugged wells within the setback distance is more difficult because there is not a complete dataset, but there are over 30,000 wells in areas with active production that would be blocked from being redrilled. In total there are 122,209 plugged wells listed in the DOGGR database.

Permits

We also looked at permit applications that were approved in 2018, including permits for drilling new wells, well reworks, deepening wells and well sidetracks. This may be the most insightful of all the analyses.

Within the 2018 permit data, we find that 4,369 permits were approved. Of those 518 permits (about 12%) were granted within the proposed 2,500’ setback. Of the permits 25% were for new drilling, 73% were for reworks, and 2% were for deepening existing wells. By county, 42% were in Kern, 24% were in Los Angeles, 14% in Ventura, 6% in Santa Barbara, 3% in Fresno, and 2% or less in Glenn, Monterey, Sutter, San Joaquin, Colusa, Solano, Orange and Tehama, in descending order.

SCAQMD Notices

In LA, Rule 1148.2 requires operators to notify the South Coast Air Quality Management District (SCAQMD) of activities at well sites, including stimulations and reworks. These data points are reiterative of the “permits” discussed above, but the dataset is specific to the SCAQMD and includes additional activities. Of the 1,361 reports made to the air district since the beginning of 2018 through April 1, 2019; 634 (47%) were for wells that would be impacted by the setback distance; 412 incidences were for something other than “well maintenance” of which 348 were for gravel packing, 4 for matrix acidizing, and 65 were for well drilling. We are not sure where gravel packing falls, in reference to AB345.

A major consideration is that this rule may force many active wells into an idle status. If the onus of plugging wells falls on the state, these additional idle wells could be a major liability for the public. Fortunately AB1328 recently defined new idle well rules. The rules entice operators to plug and abandon idle wells. If rule 1328 is effective at reducing the stock of idle wells, these two bills could complement each other. (For more information on idle wells, read FracTracker’s recent analysis, here: https://www.fractracker.org/2019/04/idle-wells-are-a-major-risk/)

State Bill 4 Well Stimulation Reporting

We also analyzed data reported to DOGGR under the well stimulation requirements of CA State Bill 4 (SB4), the 2013 bill that set a framework for regulating hydraulic fracturing in California. Part of the bill required an independent scientific study to be conducted on oil and gas well stimulation, including acid well stimulation and hydraulic fracturing. Since 2016 operators have been required to secure special permits to stimulate wells, which includes hydraulic fracturing and several other techniques. To learn more about this state regulation read FracTracker’s coverage of SB4. From January 1, 2016 to April 1, 2019, there have been 576 well stimulation treatment permits granted under the SB4 regulations. Only 1 hydraulic fracturing event, permitted in Goleta, would have been impacted by a 2,500’ setback in 2018.

Support for AB345

After being approved by the CA Assembly Natural Resources Committee in a 7-6 vote, the bill did not make it up for a vote in the Senate Appropriations Committee during the 2019 legislative session.  The bill was described by the committee as “promising policies that need more time for discussion.” AB345 is now a two-year bill in the state Senate and will be reconsidered by the committee in January of 2020. The Chairperson of the Appropriations Committee, Lorena Gonzalez, indicated her general support for the policy and committed to working with the author to find a way to move the bill forward at the end of the session.

By Kyle Ferrar, Western Program Coordinator, FracTracker Alliance 

Feature image by David McNew, Getty Images