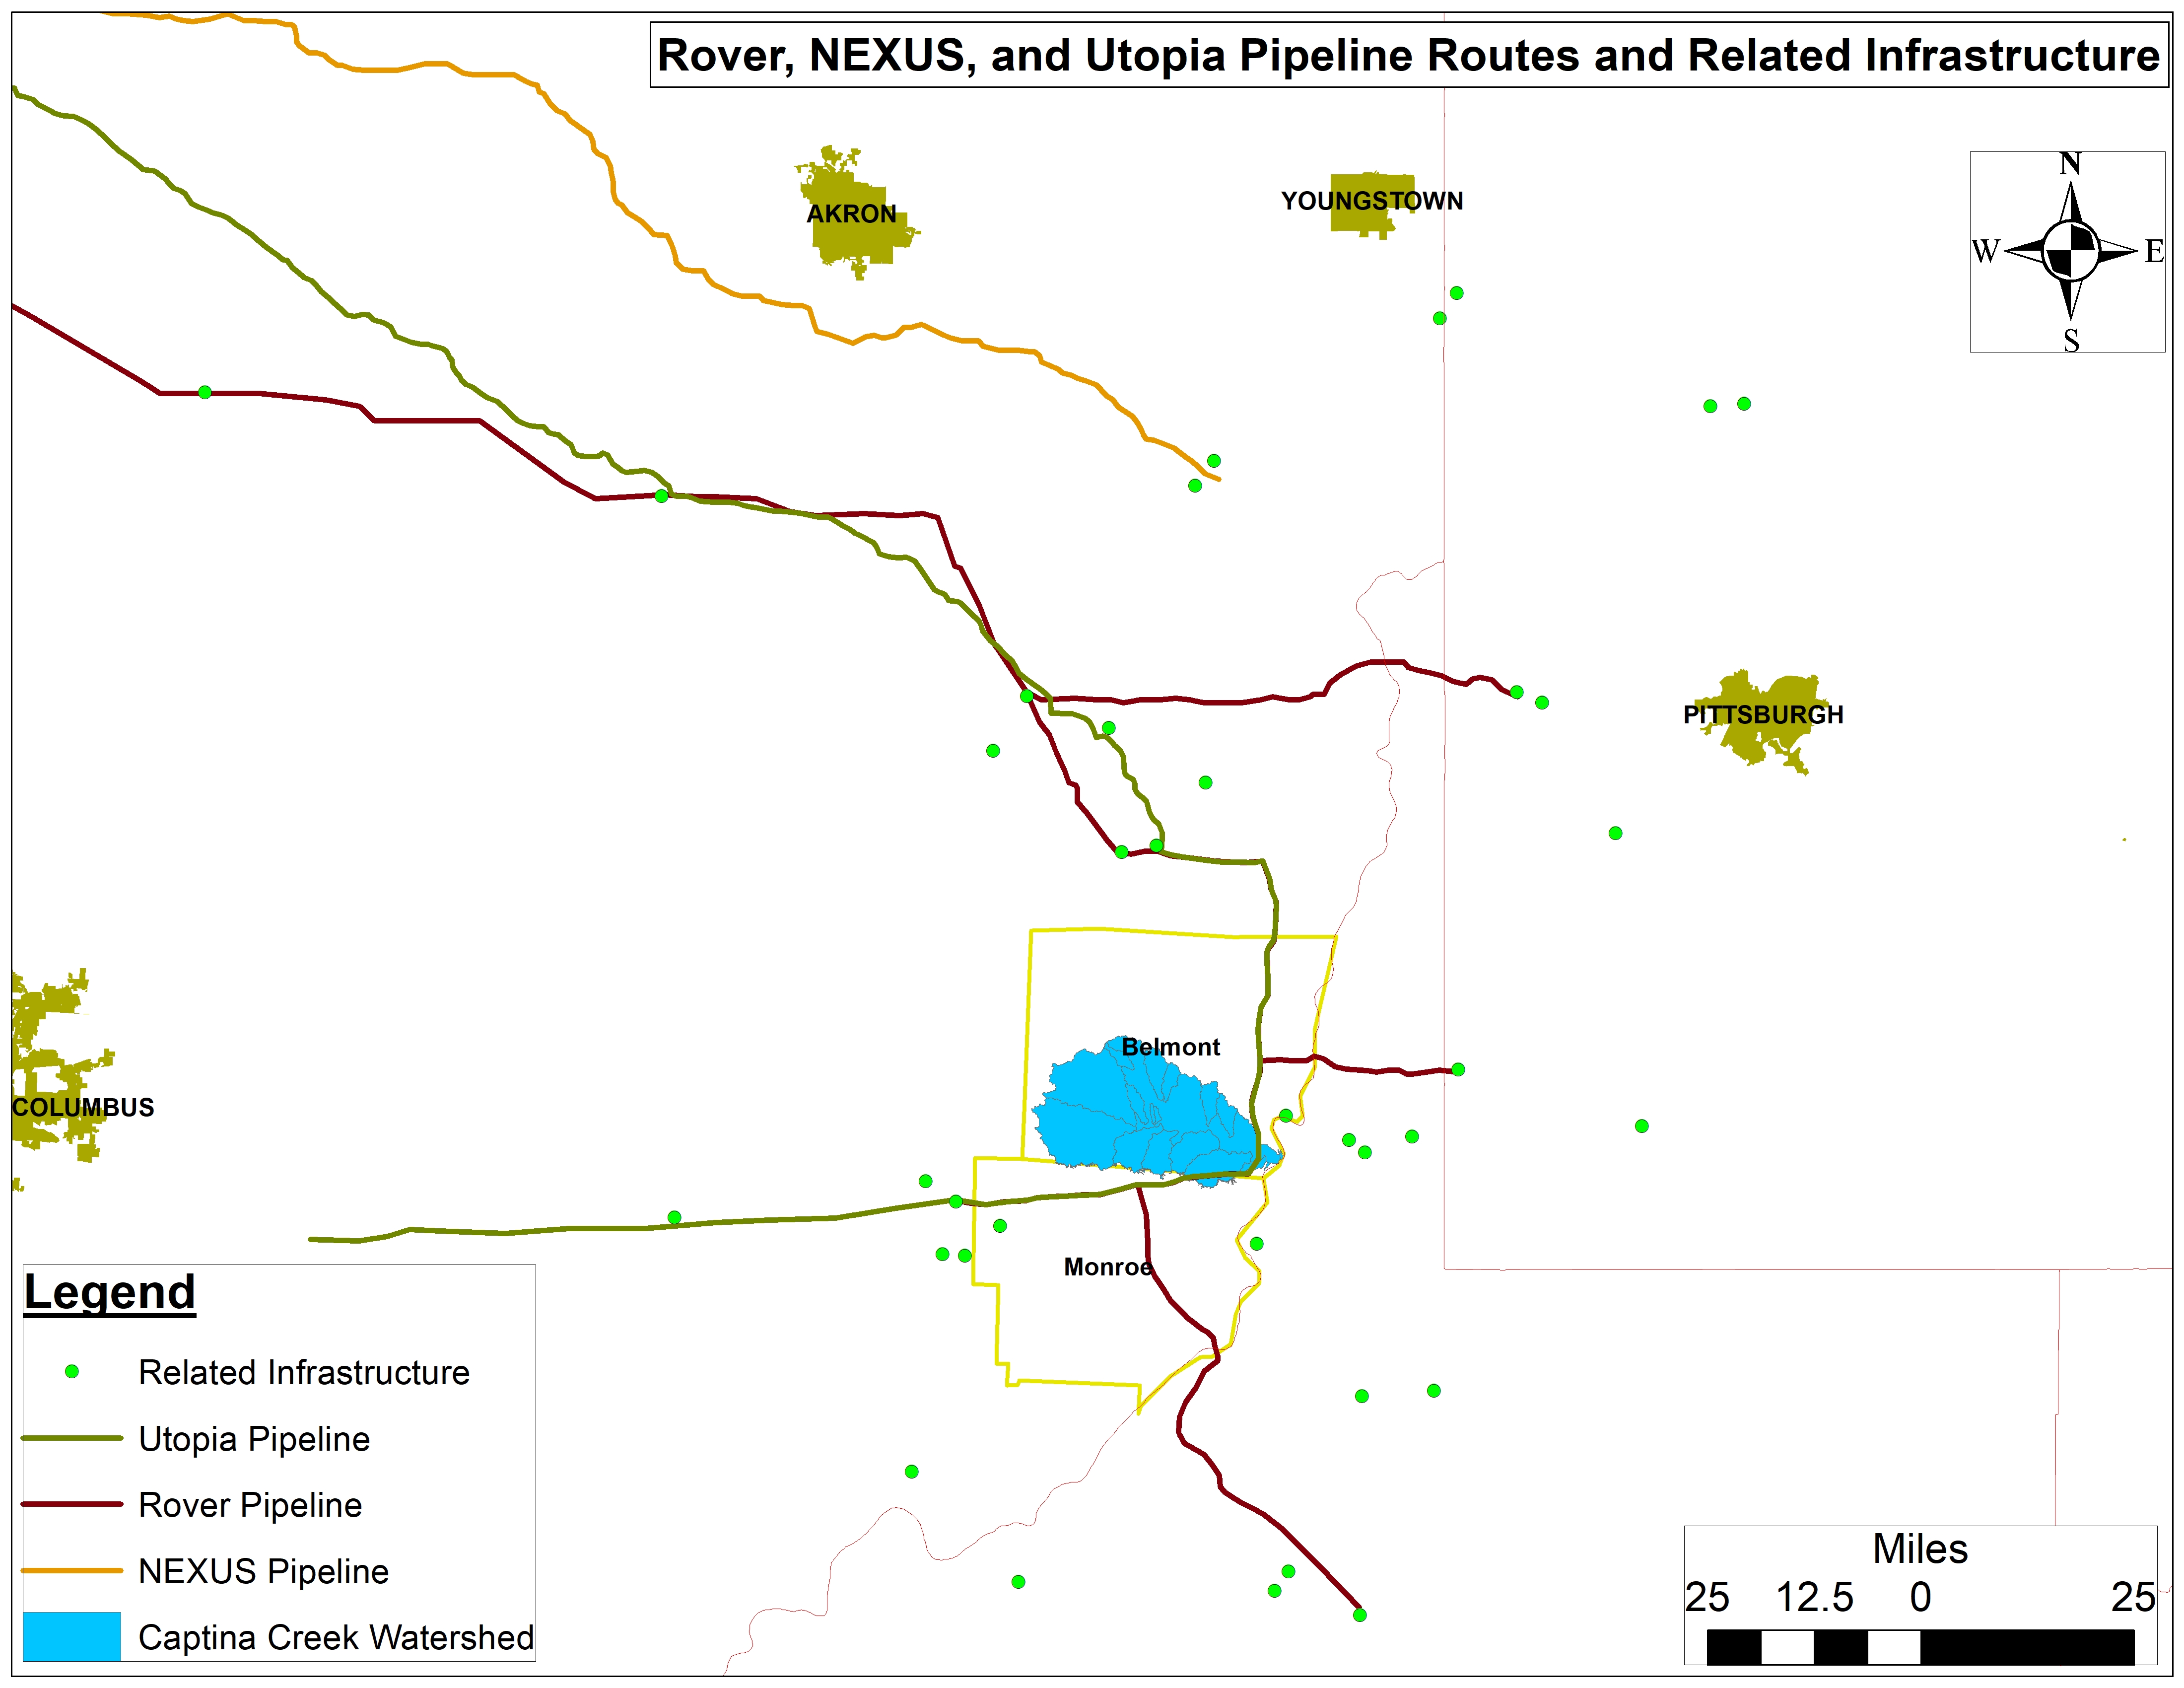
The Captina Creek Watershed straddles the counties of Belmont and Monroe in Southeastern Ohio and feeds into the Ohio River. It is the highest quality watershed in all of Ohio and a great examples of what the Ohio River Valley’s tributaries once looked, smelled, and sounded like. Sadly, today it is caught in the cross-hairs of the oil and gas industry by way of drilling, massive amounts of water demands, pipeline construction, and fracking waste production, transport, and disposal. The images and footage presented in the story map below are testament to the risks and damage inherent to fracking in the Captina Creek watershed and to this industry at large. Data included herein includes gas gathering and interstate transmission pipelines like the Rover, NEXUS, and Utopia (Figure 1), along with Class II wastewater injection wells, compressor stations, unconventional laterals, and freshwater withdrawal sites and volumes.
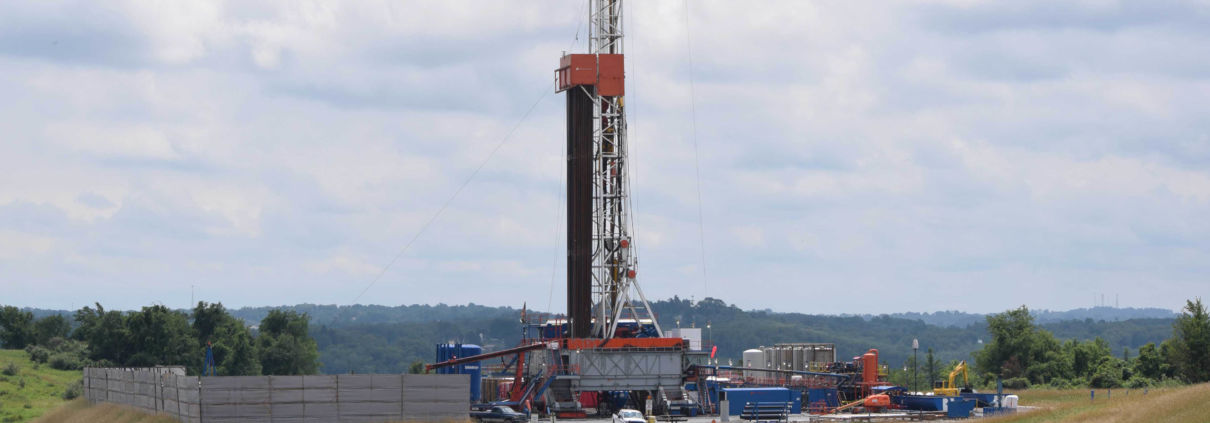
The image at the top of the page captures my motivation for taking a deeper dive into this watershed. Having spent 13+ years living in Vermont and hiking throughout The Green and Adirondack Mountains, I fell in love with the two most prominent tree species in this photo: Yellow Birch (Betula alleghaniensis) and Northern Hemlock (Tsuga candadensis). This feeling of being at home was reason enough to be thankful for Captina Creek in my eyes. Seeing this region under pressure from the oil and gas industry really hit me in my botanical soul. We remain positive with regards to the area’s future, but protective action against fracking in the Captina Creek Watershed is needed immediately!
Fracking in the Captina Creek Watershed: A Story Map
A recent study out of Carnegie Mellon University estimated that for every three job years created by fracking in the Marcellus Shale, one year of life is lost for a resident due to increased pollution exposure. As fracking continues to expand around the perimeter of Allegheny County, Pennsylvania — one of the top ten most polluted regions in the U.S. — we’re called to question how this industry is impacting the area’s already poor air quality. To answer this question, Southwest Pennsylvania Environmental Health Project (EHP), and FracTracker Alliance conducted a study on air quality around sites impacted by fracking development.
Over the course of this past year, we set up air monitors in seven communities in or near Allegheny County with current or proposed oil and gas infrastructure, with the goal of gathering baseline data and identifying possible public health concerns.
The sites in question are mapped and described below. Click on the arrow to scroll through maps of the different sites.
North Braddock: Merrion Oil and Gas has proposed a fracking well on the property of the Edgar Thomson Steel Works, near where North Braddock, East Pittsburgh, and North Versailles meet.
Plum Borough: Penneco has proposed to build a wastewater disposal well in Plum Borough. We placed three monitors at homes in areas where the air is likely to be impacted by construction and truck traffic should the wastewater disposal well be installed.
Economy Borough (Beaver County): We monitored around PennEnergy Resource’s B50 well pad, which recently began construction. Of particular concern to residents is the increase in truck traffic along a narrow road in a residential neighborhood that will be used to access the well pad.
Frazer Township: Monitoring took place around the Gulick, Schiller, and Bakerstown well pads.During their monitoring period, there was reported fracking activity on one well, and drilling activity on another.
Elizabeth Township: Monitoring occurred around three EQT and Olympus Energy fracked well pads listed as active; fracking reportedly occurred on one well pad during the monitoring period.
Indiana Township: Monitoring followed the construction of the Miller Jr. fracked well pad.
Stowe Township: Monitoring occurred in Stowe Township, where McKees Rocks Industrial Enterprise (MRIE) is located, and in adjacent McKees Rocks. This facility processes and transports frac sand, which operators use to frack a well by injecting it at extremely high pressures underground.
PM2.5 is a pollutant small enough to enter our lungs and bloodstream and therefore poses a great risk to human health.
The process of constructing, drilling and fracking a well releases a variety of pollutants, including particulate matter, volatile organic compounds (VOCs), and nitrous oxides (NOx).
Allegheny County has some of the worst air quality in the nation. In recent years, the air quality in the Pittsburgh metropolitan area, which had been improving since 2005, began to worsen. This is due in part to fracking activities.
There are 163 fracked wells that have been drilled in Allegheny County, all of which pose a threat to human health.
This initial air quality study by Southwest Environmental Health Project and FracTracker found that areas with proposed fracking sites are particularly vulnerable because they already have poor air quality.
Further investigations will need to monitor air quality throughout different stages of development and during different seasons in order to provide meaningful comparisons of changes in air quality that could be correlated with oil and gas development.
Allegheny’s air – from bad to worse
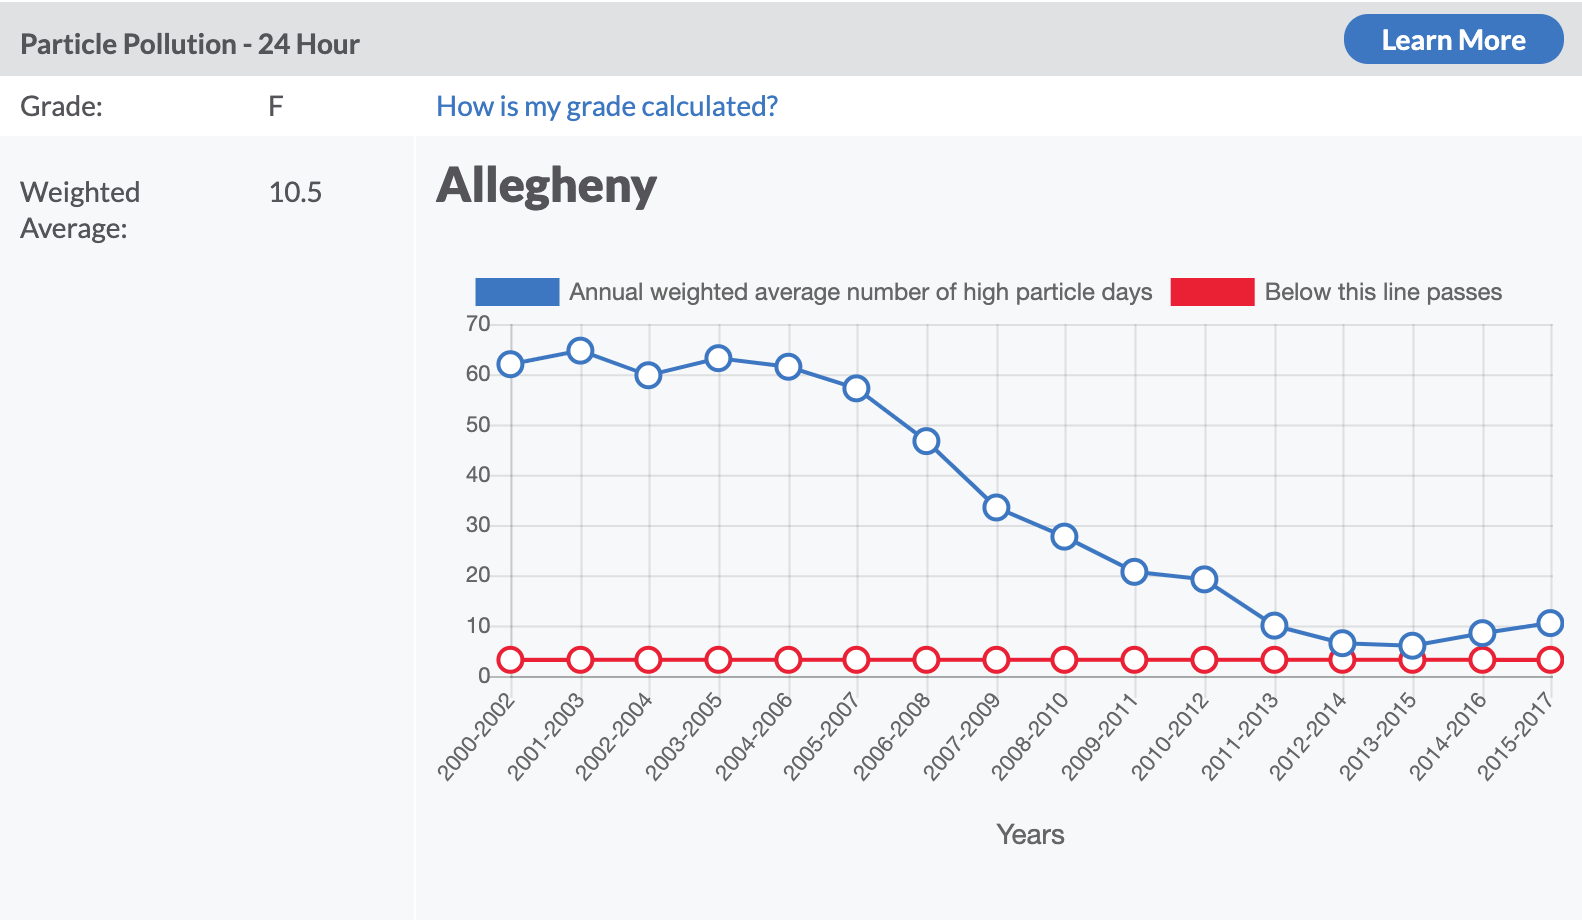
In recent years, the air quality in the Pittsburgh metropolitan area, which had been improving since 2005, began to worsen. According to the 2019 State of the Air report, levels of ozone and particle pollution increased over 2015-2017 (Figure 1).
This fact echoes a nationwide trend. Another study out of Carnegie Mellon University found that after several years of improvement, air pollution in the United States worsened in 2017 and 2018. The study cited several possible explanations, including increased natural gas production, more wildfires, and a rollback on Clean Air Act regulations by the EPA.
While Allegheny County’s air pollution is largely attributable to steel, coal, and chemical plants, in the last decade, the oil and gas industry has brought many new sources of pollution to the area.
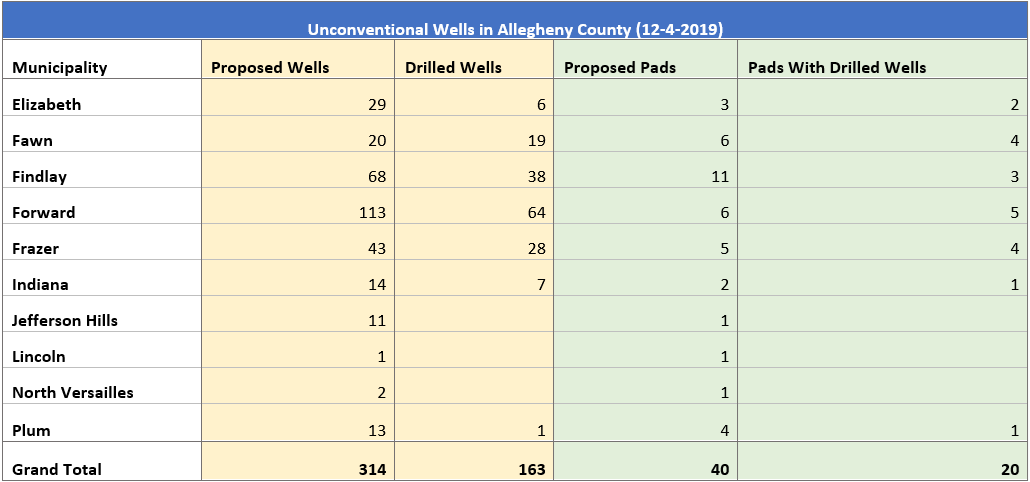
As of December, 2019, operators have drilled 163 fracking wells in the county (Table 1) and constructed nine compressor stations. Additional pollution caused by the oil and gas industry is attributable to the thousands of truck trips required to frack a well.
Table 1. Fracked wells in Allegheny County by municipality
The fracking process releases emissions that can affect human health at every stage of its lifespan. Research has linked fracking to immediate health symptoms, such as burning eyes, sore throat, and headaches. Ongoing research has identified the potential for long term health impacts, such as cardiovascular disease and adverse birth outcomes.
Air pollution from the oil and gas industry does not impact everyone equally. An individual’s response to exposure varies depending on factors such as age and health conditions.
There is also a great deal of variation amongst wells and compressor stations when it comes to emissions. As such, the best way to understand someone’s exposure is to monitor the places they frequent, such as the home, school, or workplace.
Types of Pollutants
The process of drilling and fracking a well releases a variety of pollutants, including particulate matter, volatile organic compounds (VOCs), and nitrous oxides (NOx). Table 2, below, shows reported emissions from gas wells in Allegheny County for 2017.
Table 2. Reported emissions from Allegheny County gas wells in 2017, from the PA DEP
POLLUTANT
Emission Amount (Tons)
2,2,4-Trimethylpentane
0.00093
Benzene
0.10466
Carbon Dioxide
22982.68774
CO
66.20016
Ethyl Benzene
0.00053
Formaldehyde
0.02366
Methane
714.90485
n-Hexane
0.16083
Nitrous Oxide
0.2332
NOX
270.81382
PM10
8.87066
PM2.5
8.74341
SOX
0.23478
Toluene
0.04636
VOC
21.68682
Xylenes (Isomers And Mixture)
0.03487
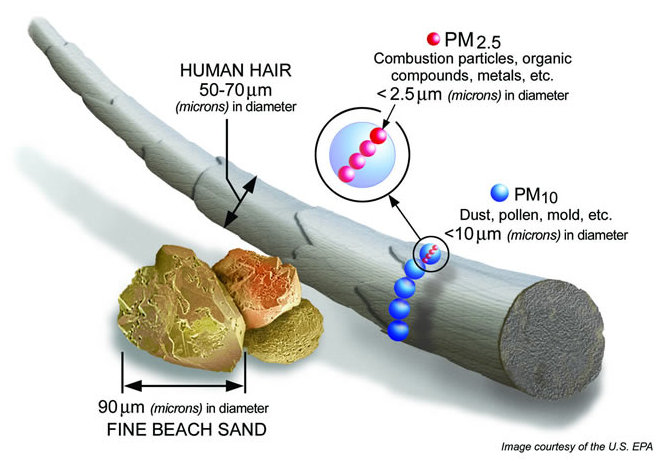
Our study looked at particulate matter (PM) – a mix of solid particles and liquids found in the air, like dust, soot, and smoke. Specifically, the study focused on PM2.5, which are particles less than 2.5 microns in diameter (Figure 2). PM forms during construction activities, combustion processes such as those in diesel engines, and from industrial sites and facilities.
Fracking and its associated processes release hazardous chemicals into the air, which then attach to PM2.5. Additionally, combustion engines of trucks and machinery used to construct well sites and drill wells release diesel emissions, including PM2.5. Compressor stations and flaring are additional sources.
PM2.5 is small enough to enter our lungs and bloodstream and therefore poses a great risk to human health. Their health impacts include reduced lung function and cardiovascular disease, as well as short term effects such as sinus irritation.
Figure 2. Particulate matter diagram, from the US EPA
The monitors were placed at varying distances and directions from the facility in question, not exceeding 1.5 miles from the facility in question. We used Speck monitors indoors and Purple Air monitors outdoors; both types measured the concentration of particulate matter over roughly one month.
The EPA’s guideline for exposure to PM2.5 is 35 μg/m3 averaged over 24 hours. However, averaging exposure over 24 hours can obscure peaks- relatively short time spans of elevated PM2.5 concentrations. While it is normal for peaks to occur occasionally, high, long, or frequent peaks in pollution can affect people’s health, particularly with acute impacts such as asthma attacks.
Results
The graphs below show our results. On each graph, you’ll see three to five lines, one for each outdoor monitor. Lines that follow similar trends show data that is likely an accurate representation of air quality in the community. Lines that stray from the pack may represent a unique situation that only that house is experiencing.
In addition to graphing the results, EHP used the following parameters to analyze the data:
Frequency of peaks
Duration of peaks
Time between peak exposures
Baseline (level of particles generally found outside when peaks are not occurring)
Total sum (or quantity) of peak exposure
These five parameters were compared to EHP’s data gathered from roughly 400 sites in Ohio, West Virginia, New York, and Pennsylvania. This database compiles air quality data from locations that have no infrastructure present as well as nearby sites such as well pads, compressor stations, frac-sand terminals, processing facilities, etc.
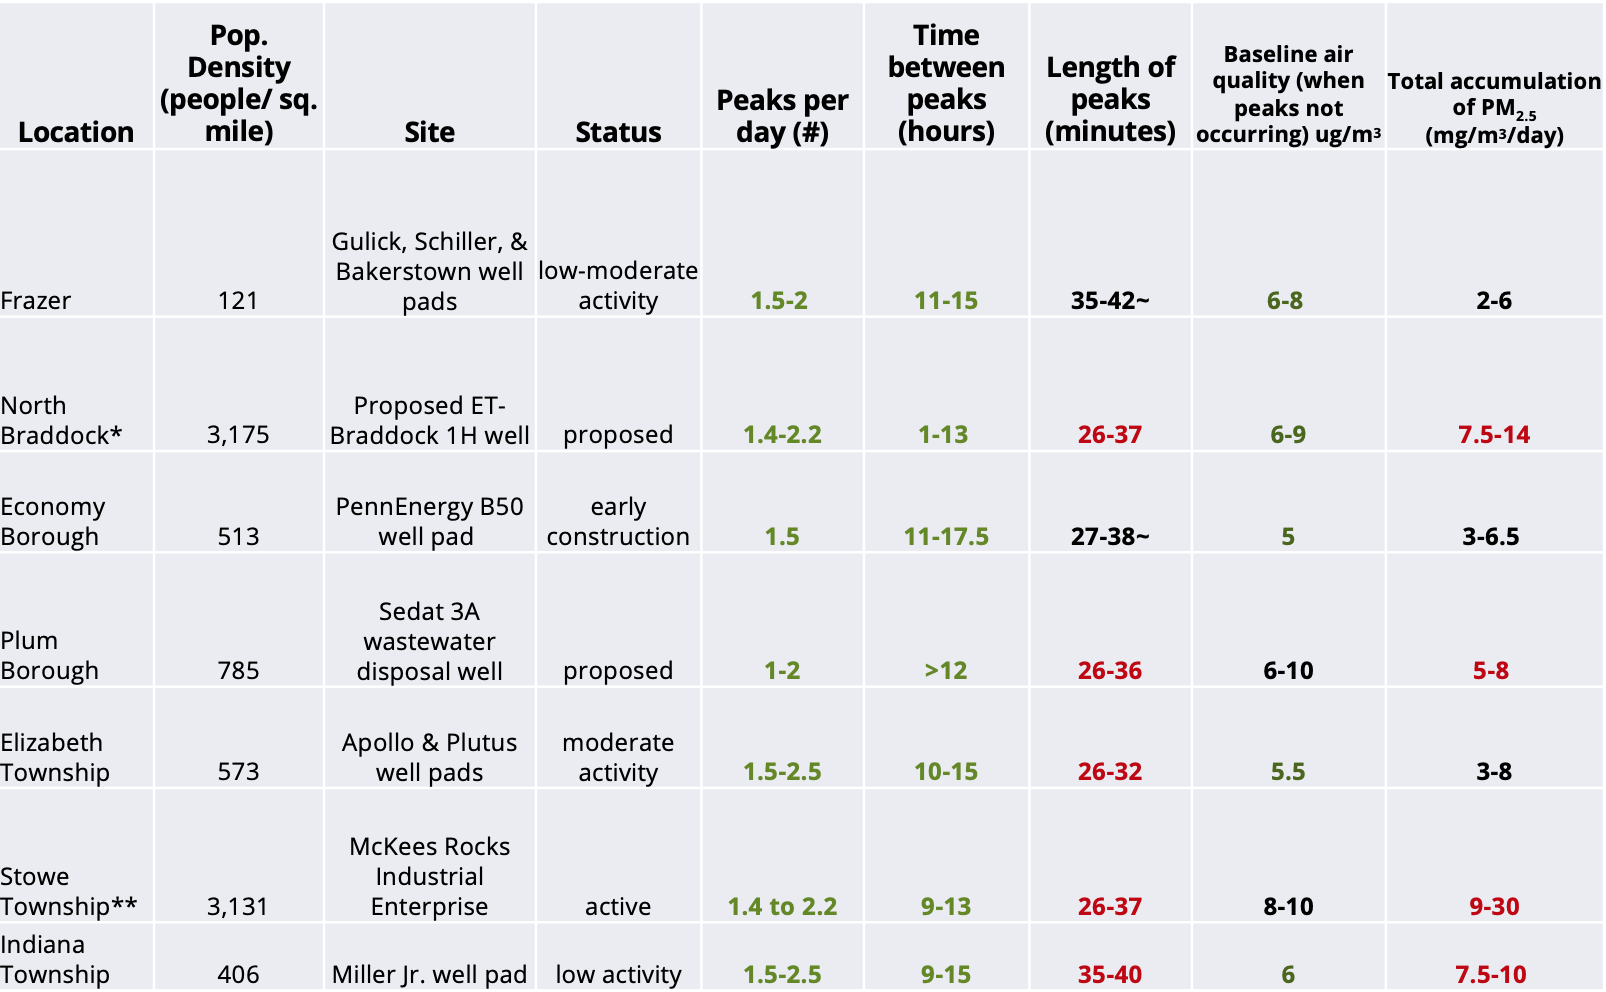
In the table below, numbers in green indicate values that are better than EHP’s averages, while red values show values that are worse than the average of EHP’s dataset. Black numbers show values that are average.
Table 3. EHP/FracTracker sites of air quality investigation in Allegheny County
*The proposed well is near the intersection of East Pittsburgh, North Braddock, and North Versailles
**Monitors were also placed in neighboring McKees Rocks
~In homes where baseline levels of PM2.5 are low, such as in Frazer and Economy, peaks are more easily registered in our analysis, but they typically have a smaller magnitude compared to homes that have high baselines.
Discussion
Communities with proposed sites
In North Braddock and Plum Borough, the outdoor air monitors collected data around sites of future and/or proposed activity. This baseline monitoring helps us understand what the air is like before oil and gas activity and is essential for understanding the future impact of oil and gas development in a community.
In these neighborhoods, we found worse than average values for total accumulation of PM2.5. This may be due to other patterns of PM2.5 movement in the area related to weather and surrounding sources of pollution. North Braddock is an urban environment, and therefore has pollution from traffic and buildings. Another source is the Edgar Thomson Steel Works, one of the county’s top polluters. While Plum Borough is more rural, it also contains an active fracking well pad and is near a coal-fired power plant and a gas power plant.
If constructed, the proposed fracking well and the proposed wastewater disposal well will add additional pollution from construction, truck traffic, and in North Braddock’s case, emissions from the well itself. This may pose a significant health risk, especially in vulnerable populations like children and those with preexisting health conditions.
Communities with constructed well pads
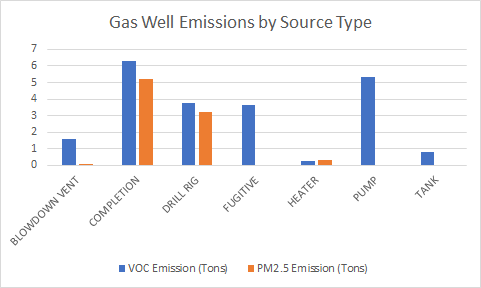
Emissions vary across the timeline of drilling and fracking a well. Figure 2 below shows reported emissions of PM2.5 and VOCs from different components of a fracking operation. PM2.5 emissions are highest during drilling (when the well bore is formed) and completion (when the well is fracked by injecting high volumes of water, sand, and chemicals at tremendous pressure). For a step by step outline of the fracking process, check out FracTracker’s fracking operation virtual tour.
Figure 2. 2017 emissions from Allegheny County gas wells at different stages in the fracking process, reported to the PA DEP
Our monitoring in Economy Borough, where construction on PennEnergy Resources’ B50 well pad had just begun, showed air quality that is better than EHP’s averages. However, if the wells on the well pad are drilled and fracked, EHP hopes to provide monitors again to track changes in air quality. In addition to emissions from the fracking well, which is close to the Chestnut Ridge housing development, residents are concerned about truck traffic along Amsler Ridge Road.
In Indiana, while residents reported truck traffic to the site, the wells were not fracked during the monitoring period. The measurements were average or slightly above the average EHP typically sees near homes. Looking at these results, peak duration was flagged, and the total sum of particulate matter was slightly elevated compared to our average suggesting that the long durations may ignite a health response in sensitive individuals. Other sources that could be contributing to pollution include the PA Turnpike and the Redland Brick manufacturer.
In Frazer, there was reported fracking activity on one well and drilling activity on another; these time periods were only slightly elevated on the hourly average charts. Monitors were left at two households in Frazer because there was an indication that fracking would start soon.
In Elizabeth Township, air quality measurements were generally better compared to the rest of EHP’s data, but there were clear peaks that all monitors registered which generated a similar, if not potentially higher, amounts of accumulated PM2.5.
Frac sand facility
Finally, monitors around MRIE, the frac sand processing facility in Stowe Township, showed air quality that may pose a health risk. The peaks in these neighborhoods generated a higher amount of accumulated PM2.5 and lasted longer compared to the rest of our data. In addition to pollution from MRIE and its associated trucks and trains, the neighborhood has many sources of pollution, including highways and industrial facilities on Neville Island.
Limitations
This study is limited in that PM2.5 was the only pollutant that the Purple Air and Speck monitors captured. To understand the complete burden of air pollution residents are exposed to, other pollutants such as VOCs, must be monitored.
Additionally, monitoring occurred over a short time period. Further investigations will need to monitor air quality throughout different stages of development and during different seasons in order to provide meaningful comparisons of changes in air quality that could be correlated with oil and gas development. EHP will continue to monitor around certain active sites to watch for changes in the data.
Get Involved
If you’re concerned about health or environmental impacts from a well in your neighborhood, make sure to document the issue by taking notes, photos, and videos, and file a complaint with the state’s Department of Environmental Protection. To report an environmental health concern, reach out to the Department of Health by phone at 1-877 PA Health (1-877-724-32584) or email (RA-DHENVHEALTH@pa.gov). If you’re an employer or worker and have health or safety concerns, reach out to your area’s OSHA office or call 1-800-321-OSHA (6742).
While cleaning up the air in your community is difficult, there are steps you can take to protect the air in your home. With the average American spending 90% of their time indoors, the air inside can greatly impact your health. For this project, we also set up air monitors in residents’ homes so participants could better understand these risks. Visit EHP’s resources under the section “What You Can Do” to learn more about protecting your indoor air quality. To learn more about how fracking is impacting residents in southwest Pennsylvania, explore the Environmental Health Channel.
Finally, help us crowdsource new data on the impacts and status of oil and gas development in your community by reporting what you see, hear, smell, and question on the FracTracker mobile app (also available from your computer!). Those living near oil and gas infrastructure are the best source of knowledge when it comes to understanding the impacts of this industry. With your help, we want to make sure all of these impacts are being documented to inform decision makers and residents about the risks of fracking.
Many thanks to the Southwest Environmental Health Project for including us as collaborators on this study.
https://www.fractracker.org/a5ej20sjfwe/wp-content/uploads/2019/12/drilling-rig-scaled.jpg6671500Erica Jacksonhttps://www.fractracker.org/a5ej20sjfwe/wp-content/uploads/2021/04/2021-FracTracker-logo-horizontal.pngErica Jackson2019-12-18 10:56:062021-04-15 14:55:33Allegheny County Air Quality Monitoring Project
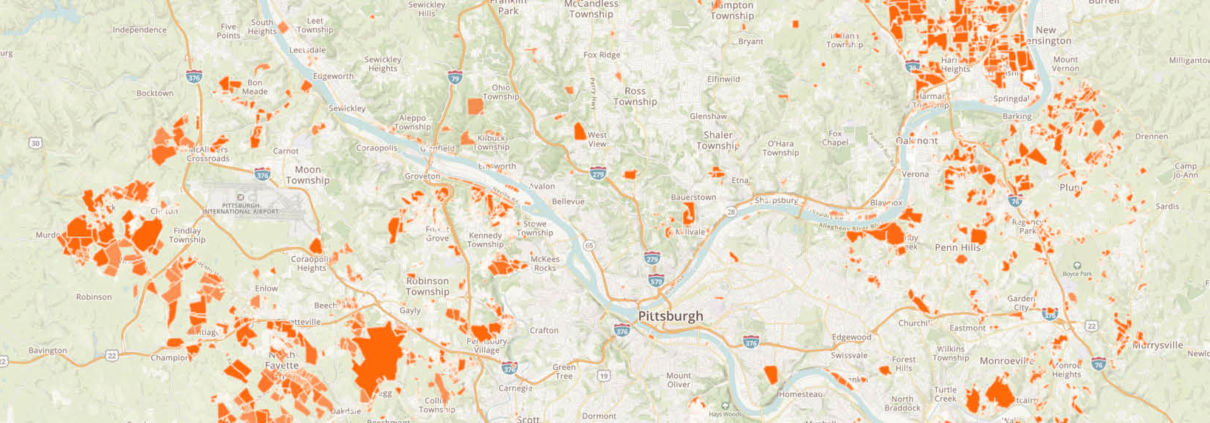
https://www.fractracker.org/a5ej20sjfwe/wp-content/uploads/2019/12/Allegheny-Lease-Map-front-page.jpg5732000Matt Kelso, BAhttps://www.fractracker.org/a5ej20sjfwe/wp-content/uploads/2021/04/2021-FracTracker-logo-horizontal.pngMatt Kelso, BA2019-12-02 14:05:562021-04-15 14:55:35Prizio Increases Transparency in Oil & Gas Data in Allegheny County
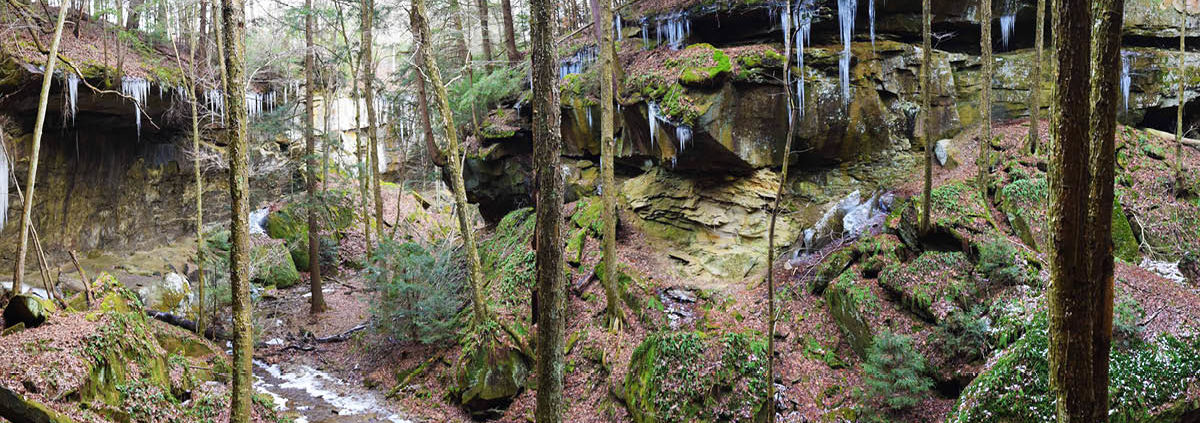 Photo by Ted Auch, FracTracker Alliance