

By Matt Kelso, Manager of Data and Technology
The FracTracker Alliance periodically takes a deeper look into the unconventional oil and gas data in Pennsylvania, in order to provide updates for some frequently requested statistics on the industry. Here we provide updated PA data and trends as of December 4, 2014. Since unconventional drilling began in the Commonwealth permits have been issued to drill 15,573 unconventional wells, according to data from the Pennsylvania DEP. Many – 8,696 (56%) – of those permits have actually been drilled. In terms of violations, there have been 5,983 entries on the statewide Compliance Report for unconventional wells throughout the state, which are attributed to 1,790 distinct wells.
Please click here for the full screen version, with additional map tools and controls.
The number of permits, wells, and violations vary significantly from month to month, but each category is well off of its peak. The largest number of unconventional permits issued in a single month was 402, which was in December 2010, more than twice as many as were issued last month. In that year, there were six months with 300 or more permits issued, whereas there has only been one such month to date in 2014.
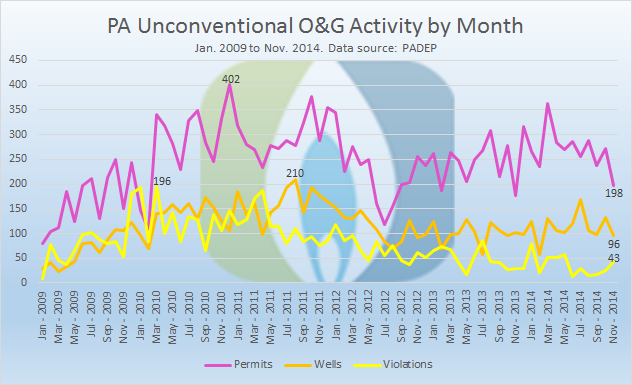
PA unconventional O&G activity per month from Jan. 2009 to Nov. 2014. Source: PADEP
The 210 wells spudded (drilled) in August 2011 represents the high water mark, and is more than two times the amount of wells drilled last month. In the 28 months between March 2010 and June 2012, the industry failed to spud 100 wells only once, reaching 98 in April 2011. In the first 11 months of 2014, that plateau was missed three times, with a low of 58 spuds in February.
There was a significant spike in violations appearing on the compliance report from December 2009 through August 2011. More than 100 violations were issued in 17 out of 21 months, including 196 in March 2010. The number of violations issued has slowed down considerably since then, with November 2014 being the 34th straight month with fewer than 100 violations. Only 14 violations were issued in June 2014.
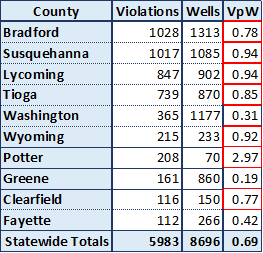
Unconventional violations per well by county in PA, showing the 10 counties with the largest number of violations. Counties with an above average Violations per Well (VpW) score are highlighted in red.
We often ask whether drilling is more problematic in some areas than others. Since the number of wells varies depending upon the location, we must approach this question by looking at the number of violations issued per well drilled (VpW). However, there is an important caveat to consider. Put simply, what is a violation? The Pennsylvania DEP publishes a Compliance Report for unconventional wells, which has 5,983 incidents listed from 2000 through December 4, 2014. However, it used to be common for the DEP to lump several incidents into the same Violation ID number, although this is not the case for more recent infractions. When the DEP counts violations issued, they look at the total number of unique Violation ID numbers that have been issued, not the total number of incidents on the report. Here, we include the more inclusive list of items on the compliance report.
Of the 10 counties with the largest number of violations issued, only 3 counties have a violations per well mark below the statewide average. Notably, each of those three counties are located in Southwestern Pennsylvania. It is unclear from these numbers what is going on in Potter County, but clearly there is a significant problem in that location – with almost three violations issued per well drilled, Potter County has a VpW score 4.3 times the statewide average.
Before we look at the operators with the most violations, there is an additional caveat to consider: It is relatively common for wells to change hands over their operational lifetimes. This characteristic could be due to one company buying another out, or simply transferring some of their assets. Still, wells changing from one operator to another is a normal aspect of the oil and gas industry. Such a fact matters for this analysis because while violations issued always stick with the responsible party in the DEP data, the name of the operator changes on the Spud Report to the current operator.

Unconventional violations per well by operator in PA, showing the 10 operators with the largest number of violations. Operators with an above average Violations per Well (VpW) score are highlighted in red.
Because of how these datasets are maintained, we see that East Resources has 261 violations for zero wells, which is of course an impossibly large ratio. That is because East sold off its stake in the Marcellus to Royal Dutch Shell, which does business as SWEPI in Pennsylvania. SWEPI, by the way, is 13th on the list of violations in its own right, with 154 violations for 675 wells, resulting in a 0.23 VpW. If the legacy violations for the old East wells were included, the result would be a 0.61 ViW score, which is almost three times as high, but still below the statewide average. FracTracker doesn’t do the analysis that way, both because it is unfair to the new operator to charge them with violations that they had nothing to do with, as well as being nearly impossible to keep track of the various transactions that result in wells changing hands over the years.
Cover image by Pete Stern, 2013.
By Kyle Ferrar, CA Program Coordinator, FracTracker Alliance
As my first year in The Bay Area of California comes to a conclusion and the summer once again turns into fall I realize how much more this time of year meant for me living on the east coast. For us lucky ducks living in the Bay Area, fall is perpetual. With the California drought seasons blur together, but back home in Pennsylvania and New York, fall marks a much appreciated relief from 90°F+ days. Regardless of where you live certain fall activities are universal, including hockey, postseason baseball, football, and most importantly for kids – going back to school.
In California alone, almost 6.24 million students from kindergarten to 12th grade are enrolled and attend classes at one of the 10,366 state “campuses.” State-recognized schools range in size from under a dozen students to a maximum 2013/2014 enrollment of 5,229. When so many children are together in one space, they share much more than just the scholarship, social development, and the occasional but inevitable flu virus. They share the same environmental media (air, water, soil) and are therefore exposed to the same environmental contaminants.
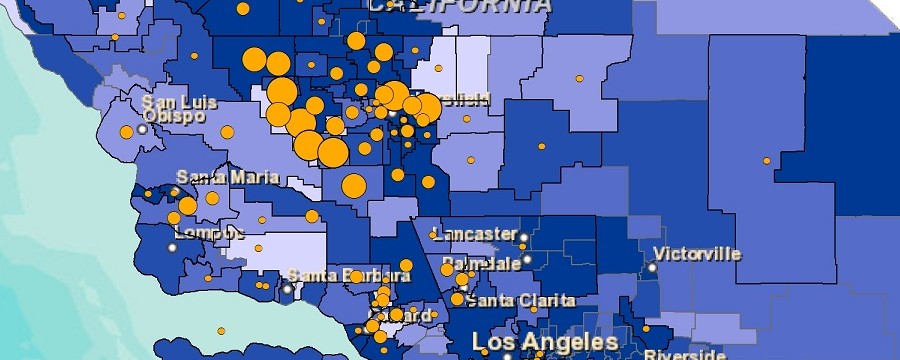
To understand who among this vulnerable population is subject to potential health impacts, the FracTracker Alliance has put together a report analyzing the demographic characteristics of schools located near oil and gas extraction activity. An interactive map of the data that was analyzed is shown below, as are the points of the report. The full report can be found here:
Disproportionate Burdens for Hispanic and Non-White Students in California

Sequoia Elementary School located in Shafter, CA.
In the background, less than 1,200 feet from the school is
an oil well (API 403043765) that was hydraulically fractured.
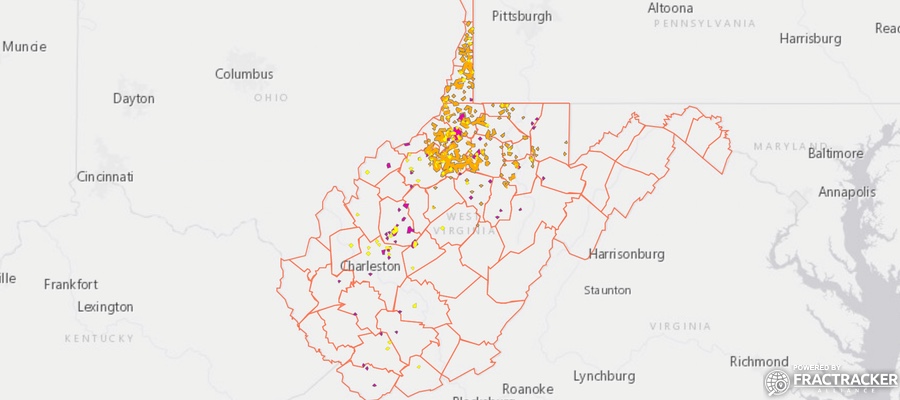
The interactive map below allows the user to compare the demographical profiles of school districts with oil and gas drilling and stimulation activity. Non-white enrollment percentages of school districts are displayed in shades of blue. Overlaid with red are the relative counts of stimulated and/or non-stimulated oil and gas wells. The highest counts of wells are hosted in school districts located in the Central (San Joaquin) Valley and along California’s south coast. Geologically, these areas lay above the Monterey Shale – the 50 million year sedimentary basin producing California’s oil reserves.
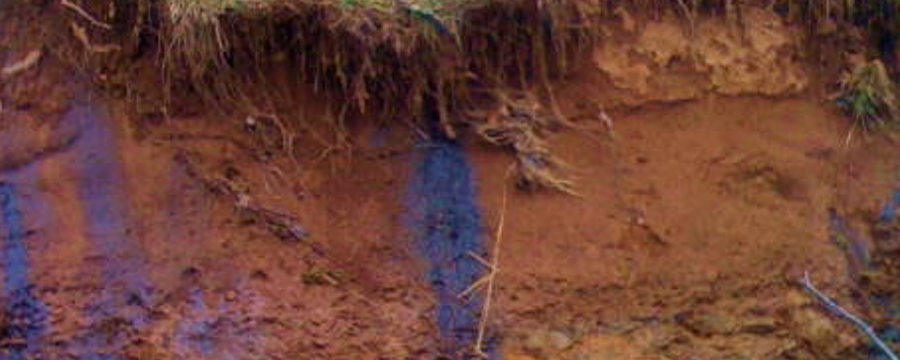
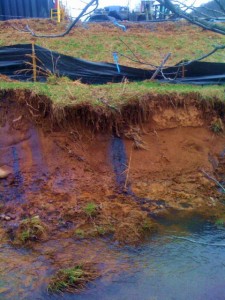
Well pad spill, wetland. Photo courtesy of WV Host Farms Program
By Matt Unger, FracTracker GIS Intern
When the unconventional oil and gas extraction boom hit Pennsylvania in the mid-2000s small, local operators were among the first on the scene. As shale plays continued to develop, many of these smaller companies were bought out by larger, national corporations. Larger oil and gas development companies often maintain that they are better able to handle the expected regulatory requirements, and so FracTracker wanted to determine if there was a change in the compliance record for wells that changed hands. Does having more resources available to them translate into stronger compliance standards for oil and gas drillers, better training for their employees, and a greater burden to get things right? Investigating these questions by looking into compliance data and the sale of wells, however, was no easy task.
There are no indications in either the drilled wells or permits datasets available from the DEP that a well has changed hands; in both of these sources, one operator’s name is simply substituted for the other. It is possible to comb through old news stories, and find that East Resources sold its assets to Shell in 2010, for example. However, this approach is piecemeal, and would not lead to satisfactory results on an industry-wide analysis.
Major obstacles to our analysis included:
Unlike wells and permits, any items on the compliance dataset are attributed to whichever company was operating the well at the time the violation was issued. So while FracTracker could not do the analysis that we wanted to because of the limitations of available data, we were able to isolate 30 wells that have changed hands between January 1, 2000 and November 4, 2014 (Table 1). One well has been bought and sold twice, with each of the three operators being issued violations.
In some instances the original well owner was reported to be out of compliance more times than the second owner. For example, API Number 013-20012 had 11 violations reported under its first owner and only 1 since it has been sold. The contrary also occurred, however, such as in the case of API Number 065-26481, which had 4 violations reported under its first owner and 14 under its second owner. There are not enough data points to determine which scenario is the trend in the data – if in fact there is one.
Due to limitations in the data, we cannot currently evaluate whether the notion that larger companies can improve the track record of problematic wells. In fact, many of the wells that were issued violations for multiple operators really just changed hands from one big operator who wanted to get out of the Marcellus to another big operator who wanted to get in. Our small sample doesn’t include any of the wells that were issued violations to only one company, of all the wells that changed hands over the years. To accurately assess the scenario, more data would have to be released, specifically the date when wells changed hands from one company to another.
Table 1. Wells with violations by API number that have changed ownership
| API Number | First Owner | Last Known Date Of Ownership | Second Owner | First Known Date Of Ownership | Third Owner | First Known Date Of Ownership |
| 013-20012 | Chief Oil & Gas LLC | 5/24/10 | Chevron Appalachia LLC | 2/5/13 | ||
| 015-20033 | Belden & Blake Corp | 4/10/09 | Chesapeake Appalachia LLC | 12/7/11 | ||
| 015-20051 | Consol Gas Co | 6/16/04 | Range Resources Appalachia LLC | 8/9/05 | Talisman Energy USA Inc | 11/16/11 |
| 019-21494 | Phillips Exploration Inc | 6/10/08 | XTO Energy Inc | 7/24/13 | ||
| 019-21680 | Phillips Exploration Inc | 4/6/10 | XTO Energy Inc | 3/13/13 | ||
| 065-26481 | Dannic Energy Corp | 5/11/11 | Mieka LLC | 11/10/11 | ||
| 065-26832 | Dannic Energy Corp | 3/2/11 | Mieka LLC | 4/11/12 | ||
| 081-20062 | Chief Oil & Gas LLC | 1/6/09 | Exco Resources Pa LLC | 8/16/11 | ||
| 081-20069 | Chief Oil & Gas LLC | 5/21/08 | Exco Resources Pa LLC | 3/28/11 | ||
| 081-20128 | Chief Oil & Gas LLC | 11/15/10 | Exco Resources Pa LLC | 6/27/11 | ||
| 081-20144 | Chief Oil & Gas LLC | 7/21/10 | Exco Resources Pa LLC | 3/15/12 | ||
| 081-20149 | Chief Oil & Gas LLC | 1/10/11 | Exco Resources Pa LLC | 2/21/12 | ||
| 081-20244 | Chief Oil & Gas LLC | 5/20/10 | Exco Resources Pa LLC | 11/15/12 | ||
| 081-20255 | Chief Oil & Gas LLC | 11/15/10 | Exco Resources Pa LLC | 11/29/11 | ||
| 081-20279 | Chief Oil & Gas LLC | 12/3/10 | Exco Resources Pa LLC | 4/20/12 | ||
| 081-20298 | Chief Oil & Gas LLC | 5/26/10 | Exco Resources Pa LLC | 6/27/11 | ||
| 083-53843 | Anschutz Exploration Corp | 4/7/09 | Chesapeake Appalachia LLC | 3/20/13 | ||
| 113-20025 | Chief Oil & Gas LLC | 2/15/11 | Exco Resources Pa LLC | 3/16/11 | ||
| 113-20049 | Chief Oil & Gas LLC | 11/30/10 | Exco Resources Pa LLC | 4/13/11 | ||
| 115-20052 | Turm Oil Inc | 9/24/08 | Chesapeake Appalachia LLC | 8/21/14 | ||
| 115-20169 | Alta Opr Co LLC | 11/24/09 | WPX Energy Appalachia LLC | 4/13/11 | ||
| 115-20174 | Alta Opr Co LLC | 4/16/10 | Wpx Energy Appalachia LLC | 4/29/11 | ||
| 115-20191 | Alta Opr Co LLC | 12/1/09 | Wpx Energy Appalachia LLC | 6/1/11 | ||
| 115-20214 | Alta Opr Co LLC | 7/19/10 | Wpx Energy Appalachia LLC | 8/16/10 | ||
| 115-20231 | Alta Opr Co LLC | 4/8/10 | Wpx Energy Appalachia LLC | 6/1/11 | ||
| 117-20197 | East Resources Inc | 4/8/08 | Talisman Energy USA Inc | 1/26/11 | ||
| 117-20280 | East Resources Inc | 5/19/10 | Swepi LP | 8/28/14 | ||
| 117-20330 | East Resources Inc | 12/18/09 | Talisman Energy USA Inc | 2/20/13 | ||
| 117-20394 | East Resources Inc | 12/14/09 | Swepi LP | 10/25/11 | ||
| 117-20538 | East Resources Inc | 12/18/10 | Swepi LP | 5/27/10 |

Aging well in McKean County, PA. Source: saveourstreamspa.org
One of the potentially troubling aspects of oil and gas development is that there are usually people who live in the vicinity of the wells. Pennsylvania now has over 8,000 active unconventional wells; there are any number of issues that can occur with these modern, industrial-scale sites, including road degradation, contaminated water, and health impacts, among others. In addition, there are over 93,000 of the smaller, conventional wells in operation throughout the Commonwealth. While these garner far less attention than their unconventional counterparts, they are also prone to producing similar impacts, not to mention that since many of them are older wells, they not only have potentially been subject to deterioration and occasional neglect, but were constructed during a period with less stringent requirements than are currently expected.
Petroleum engineers are now capable of drilling horizontally for tens of thousands of feet. For the most part, however, this technology is employed to maximize production, rather than to ameliorate impacts on people who live near the product. But who are these people? To help to answer this question, the FracTracker Alliance calculated the number of people living in a half-mile radius around active wells in the state.
More than 1.2 million Pennsylvanians live within the impact area.
Of the 93,754 wells that have been drilled in the state since 1950 that have not yet been plugged, the Pennsylvania DEP only has location data for 79,118 of them. All but one of the 14,636 missing locations are for wells that are categorized as Conventional. While one must presume that there is some overlap in coverage within the half-mile zone, the extent of this region – and therefore the population that lives within it – cannot be determined.
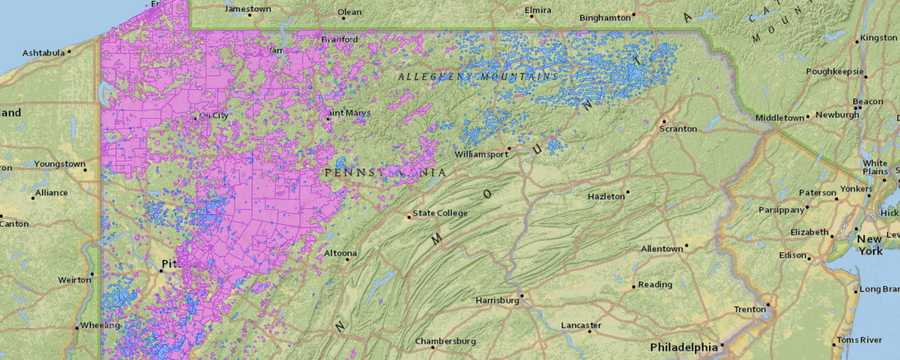
Fig. 1. PA Populations Near Oil and Gas Wells. Click here to access written description and additional map tools.
To maximize the reliability of our calculations, this map was created using a custom Albers equal-area projection centered on Pennsylvania. A half-mile buffer around each well type was created, and the resulting layer was clipped to Census tract data. The ratio of the smaller clipped area to the full Census tract area was calculated, and that ratio was then multiplied by the population totals from the 2010 Census to obtain our population estimates of the half-mile zone. The area in the study area is larger than six states, while the calculated population is larger than that of eight states.
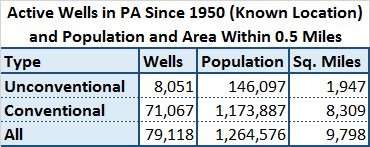
Fig. 2. Number of people in PA near oil and gas wells (79,118 active wells for which location data are available). Note that some regions are with a half-mile of both conventional and unconventional wells.
The county most impacted, in terms of area, for unconventional wells is Bradford, with 353 square miles (See Figure 2). Washington County had the most people living in the zone, however, with 20,566. For conventional wells, the drilling landscape is the largest in Indiana County, affecting 761 square miles, while Erie County has the most people in the half-mile zone, with 212,900. When considering all wells together, the numbers are almost identical to conventional wells. Indiana County leads with 762 square miles, while the drill zone in Erie County represents 211,903 people, or 76% of the county’s population in 2010.
![]()
216 Franklin St, Suite 400, Johnstown, PA 15901
Phone: +1 (717) 303-0403 | info@fractracker.org
FracTracker Alliance is a 501(c)3 non-profit: Tax identification number: 80-0844297