Ohio
As of February 1, 2025, there are records of 240,058 oil and gas wells (including both proposed and drilled) in Ohio.
As of February 1, 2025, there are records of 240,058 oil and gas wells (including both proposed and drilled) in Ohio.
-23")
Drilled horizontal wells as of September 2025
-21")
Oil and gas related incidents between 2015 – May 2025
-22")
Operating class II brine/waste disposal wells as of 2024
By Partnership for Policy Integrity with mapping and analysis by FracTracker Alliance
Report finds the widespread use of secret fracking chemicals in Ohio poses risks to water supplies and public health. Learn more and take action.

FracTracker provides state-specific data on issues such as:
The data folders may also contain information on other energy generation locations, data from different years, and data on violations committed by oil and gas facilities. Amount of information and types of information will vary by state. Get data.
Ohio Department of Natural Resources provides data on horizontal Utica and Marcellus permits and laterals, horizontal Utica permits (for waste).
 https://www.fractracker.org/a5ej20sjfwe/wp-content/uploads/2025/05/51382261216_f8af819a45_o.jpg
1125
1500
Guest Author
https://www.fractracker.org/a5ej20sjfwe/wp-content/uploads/2025/09/2025-Wordmark-Logo.png
Guest Author2025-05-31 12:00:592026-03-13 12:05:07Power Plant Locations and Unemployment Rates
https://www.fractracker.org/a5ej20sjfwe/wp-content/uploads/2025/05/51382261216_f8af819a45_o.jpg
1125
1500
Guest Author
https://www.fractracker.org/a5ej20sjfwe/wp-content/uploads/2025/09/2025-Wordmark-Logo.png
Guest Author2025-05-31 12:00:592026-03-13 12:05:07Power Plant Locations and Unemployment Rates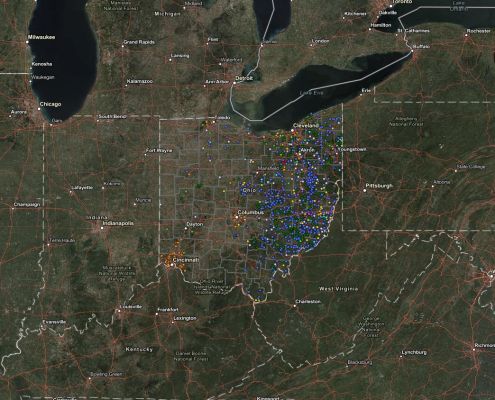 FracTracker Alliance, 2024
https://www.fractracker.org/a5ej20sjfwe/wp-content/uploads/2024/03/ODNR-Oil-and-Gas-Incidents-2018-2023.jpg
844
1500
Gwen Klenke
https://www.fractracker.org/a5ej20sjfwe/wp-content/uploads/2025/09/2025-Wordmark-Logo.png
Gwen Klenke2025-01-06 11:47:452025-01-06 14:49:36Data Gaps: A Critical Examination of Oil and Gas Well Incidents in Ohio
FracTracker Alliance, 2024
https://www.fractracker.org/a5ej20sjfwe/wp-content/uploads/2024/03/ODNR-Oil-and-Gas-Incidents-2018-2023.jpg
844
1500
Gwen Klenke
https://www.fractracker.org/a5ej20sjfwe/wp-content/uploads/2025/09/2025-Wordmark-Logo.png
Gwen Klenke2025-01-06 11:47:452025-01-06 14:49:36Data Gaps: A Critical Examination of Oil and Gas Well Incidents in Ohio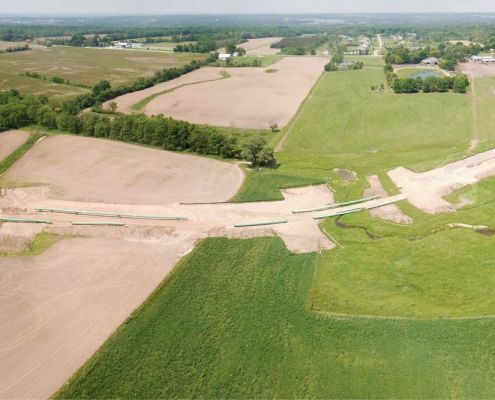 https://www.fractracker.org/a5ej20sjfwe/wp-content/uploads/2025/09/2025-Wordmark-Logo.png
0
0
FracTracker Alliance
https://www.fractracker.org/a5ej20sjfwe/wp-content/uploads/2025/09/2025-Wordmark-Logo.png
FracTracker Alliance2024-06-05 17:41:582024-06-06 09:18:40A Closer Look at Risks of the Appalachian Hydrogen Hub
https://www.fractracker.org/a5ej20sjfwe/wp-content/uploads/2025/09/2025-Wordmark-Logo.png
0
0
FracTracker Alliance
https://www.fractracker.org/a5ej20sjfwe/wp-content/uploads/2025/09/2025-Wordmark-Logo.png
FracTracker Alliance2024-06-05 17:41:582024-06-06 09:18:40A Closer Look at Risks of the Appalachian Hydrogen Hub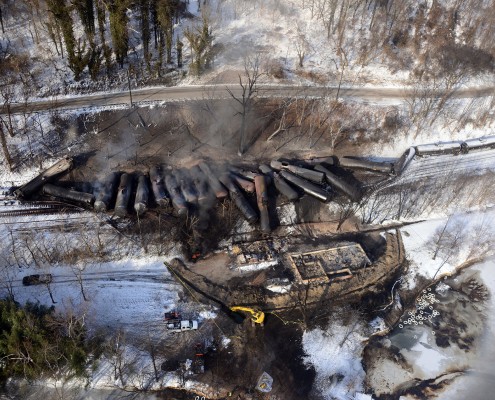 https://www.fractracker.org/a5ej20sjfwe/wp-content/uploads/2016/04/Mount-Carbon-WV-Large.jpg
1429
1888
Ted Auch, PhD
https://www.fractracker.org/a5ej20sjfwe/wp-content/uploads/2025/09/2025-Wordmark-Logo.png
Ted Auch, PhD2024-06-04 14:18:082024-06-04 16:39:12Exploring the Fallout of Precision Scheduled Rail: A Rail Worker’s Perspective on Precision Scheduled Rail
https://www.fractracker.org/a5ej20sjfwe/wp-content/uploads/2016/04/Mount-Carbon-WV-Large.jpg
1429
1888
Ted Auch, PhD
https://www.fractracker.org/a5ej20sjfwe/wp-content/uploads/2025/09/2025-Wordmark-Logo.png
Ted Auch, PhD2024-06-04 14:18:082024-06-04 16:39:12Exploring the Fallout of Precision Scheduled Rail: A Rail Worker’s Perspective on Precision Scheduled Rail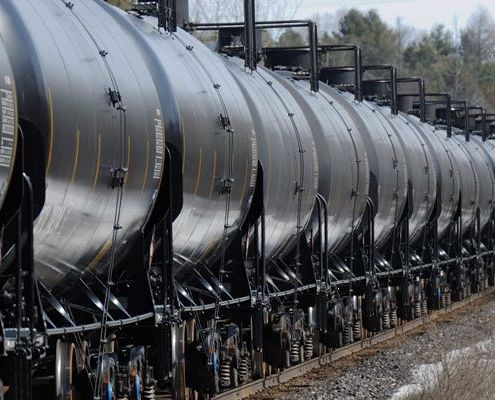 https://www.fractracker.org/a5ej20sjfwe/wp-content/uploads/2015/05/Oil-train-feature-Wash-House-Dem.jpg
400
900
Ted Auch, PhD
https://www.fractracker.org/a5ej20sjfwe/wp-content/uploads/2025/09/2025-Wordmark-Logo.png
Ted Auch, PhD2024-06-01 13:21:392024-06-04 16:42:40Exploring the Fallout of Precision Scheduled Rail: How Precision Scheduled Rail Led to One of the Worst Environmental Disasters in US History
https://www.fractracker.org/a5ej20sjfwe/wp-content/uploads/2015/05/Oil-train-feature-Wash-House-Dem.jpg
400
900
Ted Auch, PhD
https://www.fractracker.org/a5ej20sjfwe/wp-content/uploads/2025/09/2025-Wordmark-Logo.png
Ted Auch, PhD2024-06-01 13:21:392024-06-04 16:42:40Exploring the Fallout of Precision Scheduled Rail: How Precision Scheduled Rail Led to One of the Worst Environmental Disasters in US History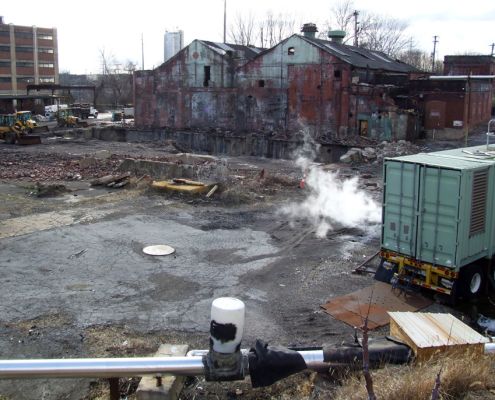 https://www.fractracker.org/a5ej20sjfwe/wp-content/uploads/2024/05/sobeYtownMar202024_0047.jpg
686
1000
Guest Author
https://www.fractracker.org/a5ej20sjfwe/wp-content/uploads/2025/09/2025-Wordmark-Logo.png
Guest Author2024-05-06 10:42:112024-05-12 11:21:18Youngstown Residents Stand Against Pyrolysis Plant: A Community’s Fight for Environmental Justice
https://www.fractracker.org/a5ej20sjfwe/wp-content/uploads/2024/05/sobeYtownMar202024_0047.jpg
686
1000
Guest Author
https://www.fractracker.org/a5ej20sjfwe/wp-content/uploads/2025/09/2025-Wordmark-Logo.png
Guest Author2024-05-06 10:42:112024-05-12 11:21:18Youngstown Residents Stand Against Pyrolysis Plant: A Community’s Fight for Environmental Justice https://www.fractracker.org/a5ej20sjfwe/wp-content/uploads/2022/02/Delaware-River-Feature.jpg
667
1500
FracTracker Alliance
https://www.fractracker.org/a5ej20sjfwe/wp-content/uploads/2025/09/2025-Wordmark-Logo.png
FracTracker Alliance2024-03-04 14:25:182024-03-04 14:25:18Staff Spotlight: Katie Jones
https://www.fractracker.org/a5ej20sjfwe/wp-content/uploads/2022/02/Delaware-River-Feature.jpg
667
1500
FracTracker Alliance
https://www.fractracker.org/a5ej20sjfwe/wp-content/uploads/2025/09/2025-Wordmark-Logo.png
FracTracker Alliance2024-03-04 14:25:182024-03-04 14:25:18Staff Spotlight: Katie Jones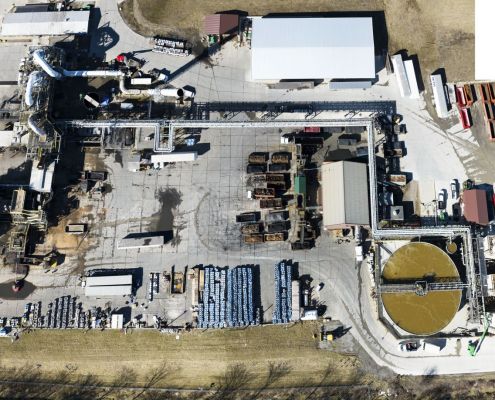 Ross incinerator in Eaton Township. Photo by Ted Auch, FracTracker Alliance, 2023
https://www.fractracker.org/a5ej20sjfwe/wp-content/uploads/2024/02/52748252528_19364d2943_k.jpg
918
1500
Guest Author
https://www.fractracker.org/a5ej20sjfwe/wp-content/uploads/2025/09/2025-Wordmark-Logo.png
Guest Author2024-02-07 21:56:582024-02-09 13:47:09Stop Toxic Threat: A Heavy Industrial Zoning Battle
Ross incinerator in Eaton Township. Photo by Ted Auch, FracTracker Alliance, 2023
https://www.fractracker.org/a5ej20sjfwe/wp-content/uploads/2024/02/52748252528_19364d2943_k.jpg
918
1500
Guest Author
https://www.fractracker.org/a5ej20sjfwe/wp-content/uploads/2025/09/2025-Wordmark-Logo.png
Guest Author2024-02-07 21:56:582024-02-09 13:47:09Stop Toxic Threat: A Heavy Industrial Zoning Battle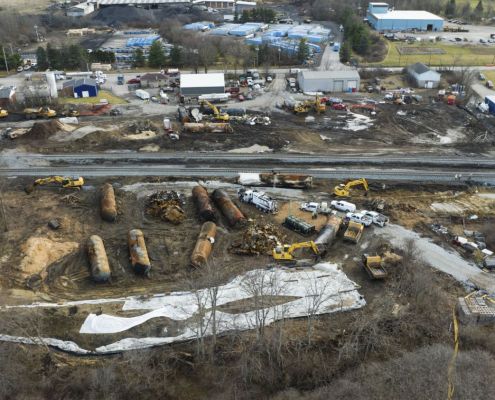 Ted Auch, FracTracker Alliance, 2023
https://www.fractracker.org/a5ej20sjfwe/wp-content/uploads/2023/04/1-e1680543676237.jpg
843
1500
Guest Author
https://www.fractracker.org/a5ej20sjfwe/wp-content/uploads/2025/09/2025-Wordmark-Logo.png
Guest Author2024-02-01 23:07:302024-02-09 13:46:16Where Do We Cross the Line: From Public Service to Public Threat
Ted Auch, FracTracker Alliance, 2023
https://www.fractracker.org/a5ej20sjfwe/wp-content/uploads/2023/04/1-e1680543676237.jpg
843
1500
Guest Author
https://www.fractracker.org/a5ej20sjfwe/wp-content/uploads/2025/09/2025-Wordmark-Logo.png
Guest Author2024-02-01 23:07:302024-02-09 13:46:16Where Do We Cross the Line: From Public Service to Public Threat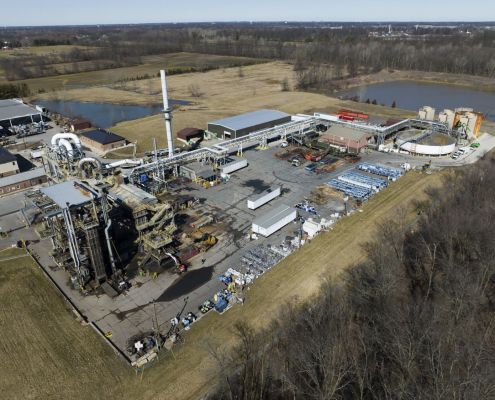 Ross Environmental Hazardous Waste Incinerator in Eaton Township, Ohio. Ted Auch, FracTracker Alliance, 2023
https://www.fractracker.org/a5ej20sjfwe/wp-content/uploads/2024/02/52747231757_2834f8bd30_k.jpg
1124
1500
Guest Author
https://www.fractracker.org/a5ej20sjfwe/wp-content/uploads/2025/09/2025-Wordmark-Logo.png
Guest Author2024-02-01 22:00:352024-02-09 13:45:10East Palestine Warning: The Growing Threat From Hazardous Waste Storage
Ross Environmental Hazardous Waste Incinerator in Eaton Township, Ohio. Ted Auch, FracTracker Alliance, 2023
https://www.fractracker.org/a5ej20sjfwe/wp-content/uploads/2024/02/52747231757_2834f8bd30_k.jpg
1124
1500
Guest Author
https://www.fractracker.org/a5ej20sjfwe/wp-content/uploads/2025/09/2025-Wordmark-Logo.png
Guest Author2024-02-01 22:00:352024-02-09 13:45:10East Palestine Warning: The Growing Threat From Hazardous Waste Storage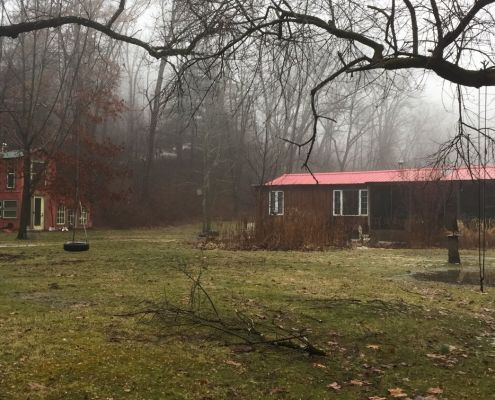 The cottage along Slope Creek, months after being vacated due to health concerns caused by nearby oil and gas operations. Photo courtesy of Chloe Mankin
https://www.fractracker.org/a5ej20sjfwe/wp-content/uploads/2024/01/slopecreek2018.jpg
845
1500
Chloe Mankin
https://www.fractracker.org/a5ej20sjfwe/wp-content/uploads/2025/09/2025-Wordmark-Logo.png
Chloe Mankin2024-01-12 12:51:302024-01-12 16:32:21Calling for Change: Life on the Fracking Frontlines
The cottage along Slope Creek, months after being vacated due to health concerns caused by nearby oil and gas operations. Photo courtesy of Chloe Mankin
https://www.fractracker.org/a5ej20sjfwe/wp-content/uploads/2024/01/slopecreek2018.jpg
845
1500
Chloe Mankin
https://www.fractracker.org/a5ej20sjfwe/wp-content/uploads/2025/09/2025-Wordmark-Logo.png
Chloe Mankin2024-01-12 12:51:302024-01-12 16:32:21Calling for Change: Life on the Fracking Frontlines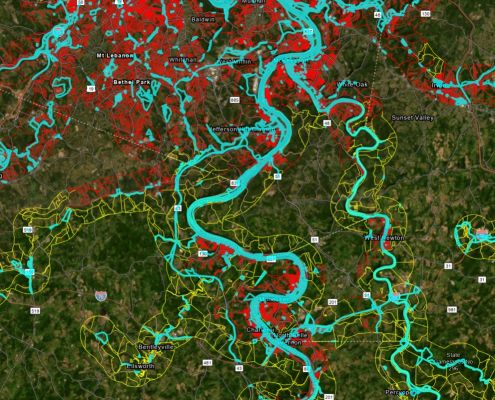 https://www.fractracker.org/a5ej20sjfwe/wp-content/uploads/2023/12/Figure-6-Rail-Population.jpg
801
1498
Matt Kelso, BA
https://www.fractracker.org/a5ej20sjfwe/wp-content/uploads/2025/09/2025-Wordmark-Logo.png
Matt Kelso, BA2023-12-14 16:26:372023-12-15 11:47:53On the Wrong Track: Risks to Residents of the Upper Ohio River Valley From Railroad Incidents
https://www.fractracker.org/a5ej20sjfwe/wp-content/uploads/2023/12/Figure-6-Rail-Population.jpg
801
1498
Matt Kelso, BA
https://www.fractracker.org/a5ej20sjfwe/wp-content/uploads/2025/09/2025-Wordmark-Logo.png
Matt Kelso, BA2023-12-14 16:26:372023-12-15 11:47:53On the Wrong Track: Risks to Residents of the Upper Ohio River Valley From Railroad Incidents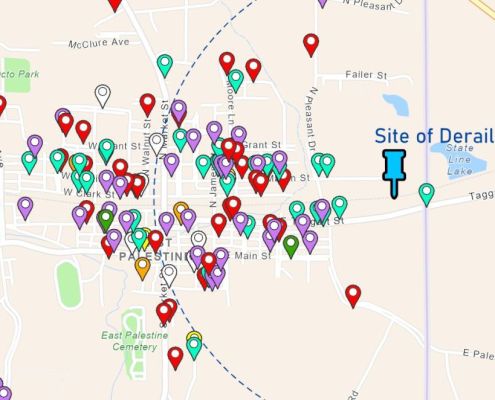 https://www.fractracker.org/a5ej20sjfwe/wp-content/uploads/2023/06/East-Palestine-Featured-Map.jpg
662
1500
Erica Jackson
https://www.fractracker.org/a5ej20sjfwe/wp-content/uploads/2025/09/2025-Wordmark-Logo.png
Erica Jackson2023-06-30 10:58:572023-06-30 10:58:57Widespread, Lingering Impacts of Norfolk Southern Warrant an Emergency Response
https://www.fractracker.org/a5ej20sjfwe/wp-content/uploads/2023/06/East-Palestine-Featured-Map.jpg
662
1500
Erica Jackson
https://www.fractracker.org/a5ej20sjfwe/wp-content/uploads/2025/09/2025-Wordmark-Logo.png
Erica Jackson2023-06-30 10:58:572023-06-30 10:58:57Widespread, Lingering Impacts of Norfolk Southern Warrant an Emergency Response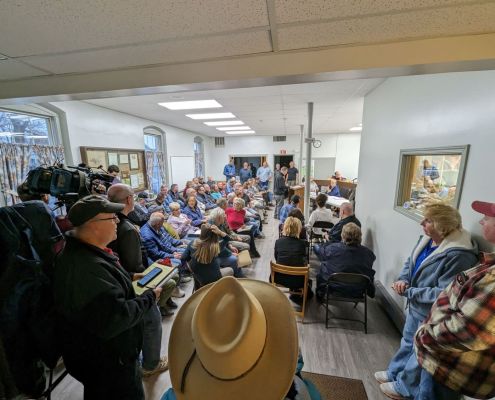 https://www.fractracker.org/a5ej20sjfwe/wp-content/uploads/2023/04/EatonTwnshp_Zoning_CommissionMeeting_Capacity_March_22_2023.jpg
1129
1500
Ted Auch, PhD
https://www.fractracker.org/a5ej20sjfwe/wp-content/uploads/2025/09/2025-Wordmark-Logo.png
Ted Auch, PhD2023-04-03 13:49:182023-04-25 13:22:55East Palestine Train Derailment Waste: Community Impacts
https://www.fractracker.org/a5ej20sjfwe/wp-content/uploads/2023/04/EatonTwnshp_Zoning_CommissionMeeting_Capacity_March_22_2023.jpg
1129
1500
Ted Auch, PhD
https://www.fractracker.org/a5ej20sjfwe/wp-content/uploads/2025/09/2025-Wordmark-Logo.png
Ted Auch, PhD2023-04-03 13:49:182023-04-25 13:22:55East Palestine Train Derailment Waste: Community Impacts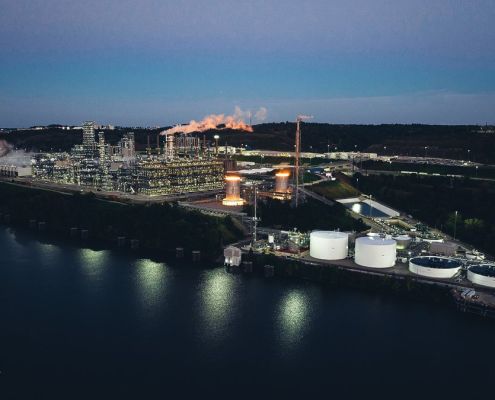 https://www.fractracker.org/a5ej20sjfwe/wp-content/uploads/2022/11/Fhn3YgeXkAI0QiX.jpg
675
1200
Erica Jackson
https://www.fractracker.org/a5ej20sjfwe/wp-content/uploads/2025/09/2025-Wordmark-Logo.png
Erica Jackson2022-11-17 16:43:392022-11-18 13:41:39Falcon Pipeline Online, Begins Operations Following Violations of Clean Streams Law
https://www.fractracker.org/a5ej20sjfwe/wp-content/uploads/2022/11/Fhn3YgeXkAI0QiX.jpg
675
1200
Erica Jackson
https://www.fractracker.org/a5ej20sjfwe/wp-content/uploads/2025/09/2025-Wordmark-Logo.png
Erica Jackson2022-11-17 16:43:392022-11-18 13:41:39Falcon Pipeline Online, Begins Operations Following Violations of Clean Streams Law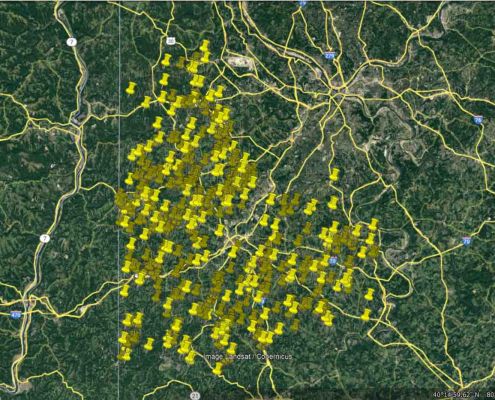 https://www.fractracker.org/a5ej20sjfwe/wp-content/uploads/2022/11/Washington-County-PA-2022-Google-Earth.jpg
933
1920
FracTracker Alliance
https://www.fractracker.org/a5ej20sjfwe/wp-content/uploads/2025/09/2025-Wordmark-Logo.png
FracTracker Alliance2022-11-04 12:55:532022-11-04 13:04:53FracTracker Receives Two Federal Grants to Support Community Air Monitoring Initiatives in the Ohio River Valley
https://www.fractracker.org/a5ej20sjfwe/wp-content/uploads/2022/11/Washington-County-PA-2022-Google-Earth.jpg
933
1920
FracTracker Alliance
https://www.fractracker.org/a5ej20sjfwe/wp-content/uploads/2025/09/2025-Wordmark-Logo.png
FracTracker Alliance2022-11-04 12:55:532022-11-04 13:04:53FracTracker Receives Two Federal Grants to Support Community Air Monitoring Initiatives in the Ohio River Valley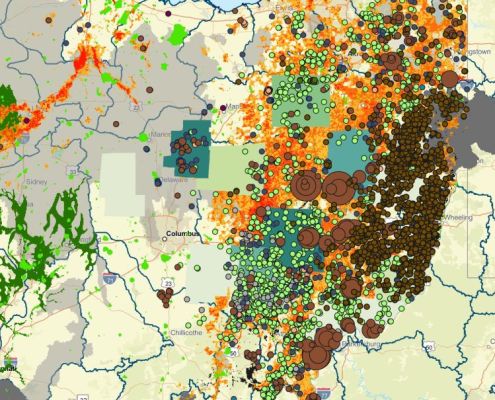 https://www.fractracker.org/a5ej20sjfwe/wp-content/uploads/2022/10/Columbus-Source-Water.jpg
605
1500
Guest Author
https://www.fractracker.org/a5ej20sjfwe/wp-content/uploads/2025/09/2025-Wordmark-Logo.png
Guest Author2022-10-31 21:39:022022-11-29 14:24:38Synopsis: Risks to the Greater Columbus Water Supply from Oil and Gas Production
https://www.fractracker.org/a5ej20sjfwe/wp-content/uploads/2022/10/Columbus-Source-Water.jpg
605
1500
Guest Author
https://www.fractracker.org/a5ej20sjfwe/wp-content/uploads/2025/09/2025-Wordmark-Logo.png
Guest Author2022-10-31 21:39:022022-11-29 14:24:38Synopsis: Risks to the Greater Columbus Water Supply from Oil and Gas Production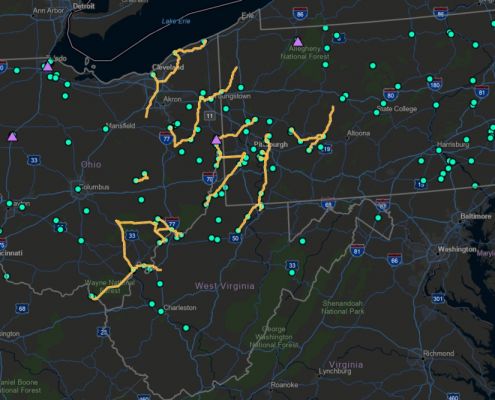 https://www.fractracker.org/a5ej20sjfwe/wp-content/uploads/2022/06/CCSHFeatureImage.jpg
667
1500
Guest Author
https://www.fractracker.org/a5ej20sjfwe/wp-content/uploads/2025/09/2025-Wordmark-Logo.png
Guest Author2022-06-23 15:29:312022-06-30 12:30:43An Insider Take on the Appalachian Hydrogen & CCUS Conference
https://www.fractracker.org/a5ej20sjfwe/wp-content/uploads/2022/06/CCSHFeatureImage.jpg
667
1500
Guest Author
https://www.fractracker.org/a5ej20sjfwe/wp-content/uploads/2025/09/2025-Wordmark-Logo.png
Guest Author2022-06-23 15:29:312022-06-30 12:30:43An Insider Take on the Appalachian Hydrogen & CCUS Conference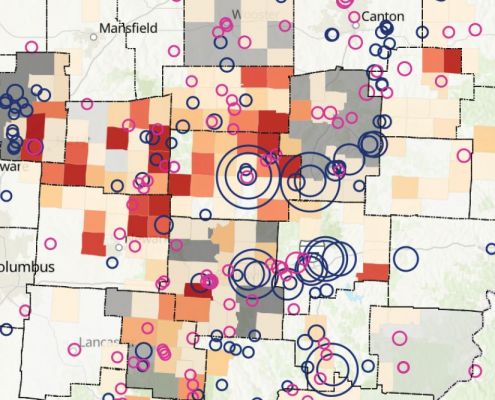 https://www.fractracker.org/a5ej20sjfwe/wp-content/uploads/2022/05/Brine-spreading-map-feature-1.jpg
667
1500
Guest Author
https://www.fractracker.org/a5ej20sjfwe/wp-content/uploads/2025/09/2025-Wordmark-Logo.png
Guest Author2022-05-13 16:19:112022-08-10 15:43:05Oil and Gas Brine in Ohio
https://www.fractracker.org/a5ej20sjfwe/wp-content/uploads/2022/04/TAuch_Cultural-Harvey_FamilyFarm_NEXUS_Pipeline-DTEEnergy_Enbridge-ChippewaLake_MedinaCounty_OH_May20183-feature.jpg
667
1500
Ted Auch, PhD
https://www.fractracker.org/a5ej20sjfwe/wp-content/uploads/2025/09/2025-Wordmark-Logo.png
Ted Auch, PhD2022-04-28 14:12:552022-04-28 14:12:55Real Talk on Pipelines
https://www.fractracker.org/a5ej20sjfwe/wp-content/uploads/2022/05/Brine-spreading-map-feature-1.jpg
667
1500
Guest Author
https://www.fractracker.org/a5ej20sjfwe/wp-content/uploads/2025/09/2025-Wordmark-Logo.png
Guest Author2022-05-13 16:19:112022-08-10 15:43:05Oil and Gas Brine in Ohio
https://www.fractracker.org/a5ej20sjfwe/wp-content/uploads/2022/04/TAuch_Cultural-Harvey_FamilyFarm_NEXUS_Pipeline-DTEEnergy_Enbridge-ChippewaLake_MedinaCounty_OH_May20183-feature.jpg
667
1500
Ted Auch, PhD
https://www.fractracker.org/a5ej20sjfwe/wp-content/uploads/2025/09/2025-Wordmark-Logo.png
Ted Auch, PhD2022-04-28 14:12:552022-04-28 14:12:55Real Talk on Pipelines![]()
216 Franklin St, Suite 400, Johnstown, PA 15901
Phone: +1 (717) 303-0403 | info@fractracker.org
FracTracker Alliance is a 501(c)3 non-profit: Tax identification number: 80-0844297


