2000 to 2010 Non Marcellus Waste Data
Yesterday, I provided our readers with a summary of long term non Marcellus Shale production data, which is self reported by the industry to the Pennsylvania Department of Environmental Protection (DEP). The DEP has recently made this information available retroactive to 2000, at least for oil and gas wells not drilled into the Marcellus Shale.
The following charts show the total reported waste for non Marcellus Shale wells over time, from 2000 to 2010.
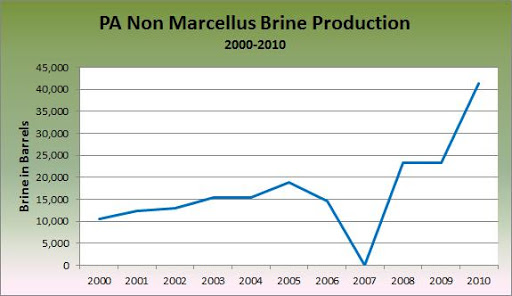
Non Marcellus Shale brine production in Pennsylvania: 2000 to 2010
What happened in 2007, you may ask? Instead of having tens of thousands of entries for waste production, that year’s report had only four. I contacted the DEP, and was told that they would look into it. Furthermore, there was a Department of Conservation and Natural Resources (DCNR) server crash that year, which might be related to the missing data. 2007 is therefore severely understated, which in my opinion isn’t really that crucial, as long as we understand it to be the case.
The reported production of brine waste quadrupled from 2000 to 2010.
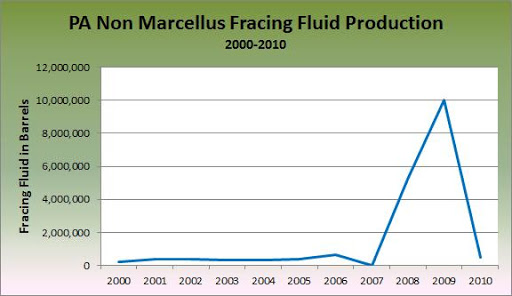
Non Marcellus Shale fracing fluid production in Pennsylvania: 2000 to 2010
We already discussed the problem for 2007, but what about the huge spike for 2009? 74 percent of the drilling fluid waste came from Atlas Resources. The most logical explanation is the old “Oops…those were gallons, not barrels” routine. If that’s what happened–and Atlas was the only company to do so–then the annual non Marcellus fracing fluid waste production would be reduced from about 10 million barrels to just over 2.75 million barrels.
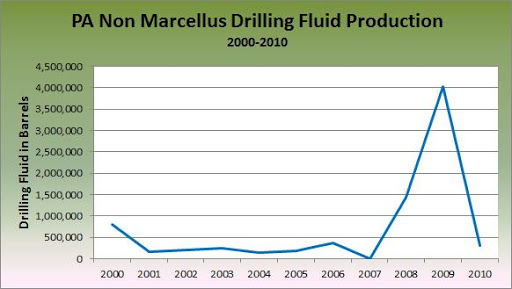
Non Marcellus Shale drilling fluid production in Pennsylvania: 2000 to 2010
Atlas may not have been the only culprit, however.
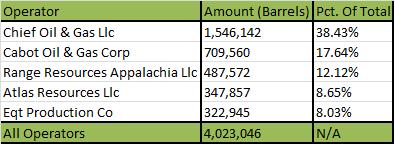
Leading producers of drilling fluid waste for non Marcellus Shale wells in 2009
On the one hand, some of the biggest oil and gas operators are represented on this list, so it wouldn’t be a surprise if they generated the most waste. But just as with fracing fluid, the spike in 2009 needs some sort of explanation. The simplest one is that some of the operators reported in gallons instead of barrels, thereby overstating their waste production by 42 times. While Chief is a major player, they were one of 303 oil and gas operators on the waste report for that year, so it seems unlikely that they accounted for 38 percent of this type of waste.
The total production of drilling fluid waste for non Marcellus Shale operators in 2010 was just over 309,000 barrels, meaning that all five of the companies above reported more of the waste for 2009 than the entire industry produced statewide the following year.
It is also entirely possible that the waste was not over-reported for 2009, but simply included Marcellus Shale operations as well. Indeed, while they may have had some non Marcellus wells, Chief, Cabot, Range, and Atlas are all Marcellus Shale specialists.
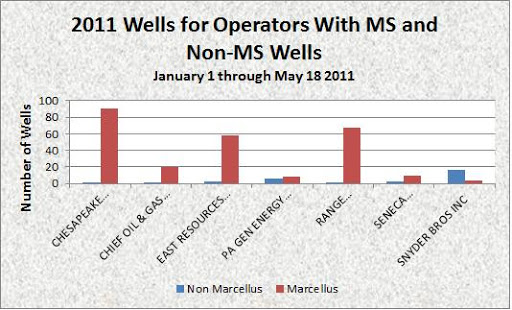
Number of Marcellus Shale and non Marcellus Shale wells between January 1 and May 18, 2011 for the seven companies who had at least one of each
While I haven’t done an analysis for 2009, in 2011, there is very little overlap between Marcellus and non Marcellus drillers, and for those few companies that do both, they still tend to specialize in one group or the other. If the inclusion of Marcellus Shale waste is the reason for the spike in 2009, then the spikes in the waste report would serve to show the dramatic increase of waste caused by drilling into that formation.
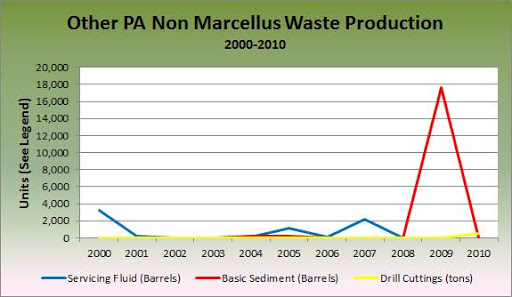
Other non Marcellus Shale waste production in Pennsylvania: 2000 to 2010
Servicing fluid, basic sediment, and drill cuttings only make occasional appearances on the waste production report. Drill cuttings, the only type of waste reported in tons instead of barrels, only appears on the 2010 report for non Marcellus Shale wells.
I’m very pleased that the DEP has released the waste and production data for non Marcellus Shale wells going back more than a decade. It gives the public the tools to analyze a variety of costs and benefits in relation to drilling activities. I’m hopeful that production and waste reports for the Marcellus Shale will also be made available from the early wells in 2006 through June of 2009, from which point the data is available already.
Also, stay tuned for the Marcellus Shale production and waste data for the six month period from January through June, 2011, which should be available in the next month or so.