Marcellus Shale Production Decline Over Time in Pennsylvania
There are now three different Marcellus Shale production reports available on FracTracker’s DataTool:
- Pennsylvania Marcellus Shale Production, 7-1-09 to 6-30-10
- PA Marcellus Shale Prduction Data: 7-1-2010 through 12-31-2010
- PA Marcellus Shale Production Report: January-June 2011
The production data, which is self-reported by the drilling operators, is also available from the Pennsylvania Department of Environmental Protection.
In this post, we will explore the change in production from the 756 Marcellus Shale wells that reported positive (nonzero) production on each of the three reports. Of these, exactly 300 were flagged as horizontal wells on the most recent report, leaving 456 to be classified as vertical wells.

Marcellus Shale production in Pennsylvania from January to June, 2011. Please click the image to see a zoomable and dynamic map.
Caveats
It is important to note that the first of the three production cycles is for a one year period, while the other two are for six months each. Luckily, each report includes not only production in thousands of cubic feet (Mcf), but also the number of days for which each well was in production. Therefore, we can look at the data in terms of thousands of cubic feet per day (McfPD), which solves not only the 12 month vs. 6 month problem, but also makes sure that we aren’t comparing six months of production to just a handful of days.
One important factor that this analysis does not account for, however, is when the well first entered production. This is significant, because gas wells typically have a very high initial production, which falls steeply in the months and years ahead. This produces a hyperbolic decline curve, such as this Department of the Interior graph found on Wikipedia.
In this case, we only know that the initial production was some time since 2006 and before June 30, 2010. Add to that fact that there are only three date ranges, and the result is definitely not a proper decline curve.
Results
However, there are results, and they do show decline over time. Interestingly, there are some differences to note between horizontal and vertical Marcellus Shale wells.
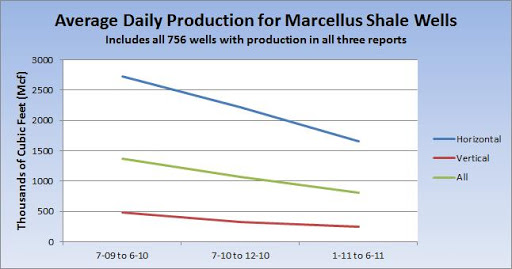
Average Marcellus Shale production in thousands of cubic feet (Mcf) for wells on all three production reports.
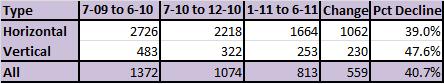
Average Marcellus Shale production showing rates of decline.
The overall production of the sample decreased 40.7 percent from the period ending June 2010 to the one ending one year later. Interestingly, the vertical wells are declining at a sharper rate than horizontal wells, although not dramatically so.
The chart also highlights the amazing difference in production that horizontal drilling provides to Marcellus Shale wells, with average production values 5.6 to 6.9 times higher than their vertical counterparts.
What’s Missing?
Not all of the Marcellus Shale wells from the July ’09 to June ’10 list were still reporting production for the period that ended one year later. These wells were not included in the above analysis, but are interesting in their own right:
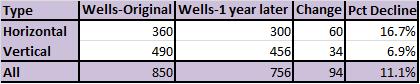
Number of Marcellus Shale wells on the production report for the period ending June 2010 that are also reporting production one year later.
Surprisingly, the rate for horizontal wells no longer producing gas is more than twice as high as their vertical counterparts. Does this mean that a side effect of horizontal drilling is a shorter well production life, as all of the gas is extracted faster? We’ll have to wait and see what future data shows to find out.
Thanks for the analysis, Matt.
You make it clear that trying to discern well performance from gross public DEP data is ‘doing it the hard way’ — the operators have exactly the right data (and the analysis tools) to tell precisely what’s happening, and could tell us if they would.
It would be surprising if the decline in output were actually as slow as your estimate (40% over 24 months). An obvious source of bias is that your population includes only wells which were in production in all three reports. Another is that you effectively use July 1, 2009, as the first day of production for all 300 of these wells, regardless of their true age.
Other people, using other sources of data, estimate that ‘Marcellus-style’ wells may decline 50% in only 6 to 9 months. I don’t think that the quality of data from DEP is good enough to say that your results have in any measure disproved those more pessimistic findings.
There needs to be a conversation about the ‘decline curves’ of Marcellus Shale wells. (And the Attorney General of NY, as well as the SEC, are ready to kick it off.) Thanks for beginning to shine a bit of light on the subject.