US Pipelines Incidents Are a Daily Occurrence
Recently, there has been a lot of attention focused on the Mayflower, Arkansas pipeline failure that resulted in a massive oil spill, particularly as it comes at a time when discussions of the controversial Keystone XL Pipeline project are once again heating up. However, the situation is far from unusual. In fact, according to data downloaded from the Pipeline and Hazardous Materials Safety Administration (PHMSA), there were 1,887 incidents in the nation’s gathering and transmission, distribution, and hazardous liquids pipelines between January 1, 2010 and March 29, 2013, or an average of 1.6 incidents per day.
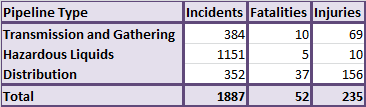
Pipeline incidents from 1/1/2010 through 3/29/2013. Data Source: PHMSA.
Obviously, not all of these failures are on par with the massive spill in Mayflower, and it should be noted that there are a variety of reasons for these lines to fail. Some of these reasons, such as excavation activity in the vicinity of a pipeline, are not necessarily the fault of the pipeline’s operator. The fact that these incidents are commonplace, however, is not one that can be dismissed.
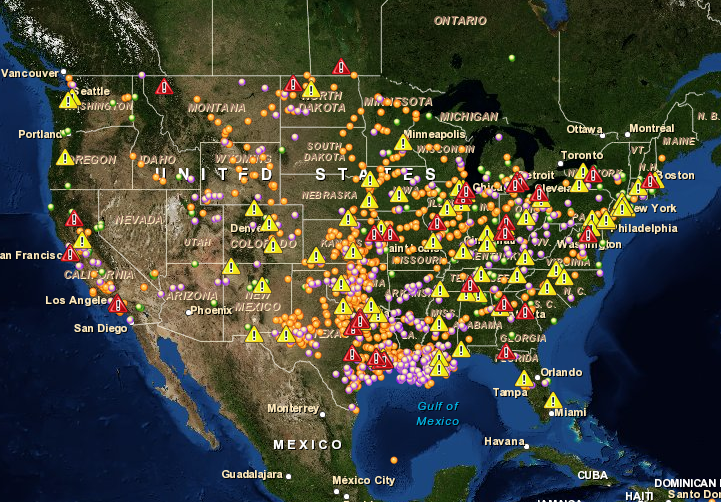
Pipeline incidents in the United States from 1/1/2010 through 3/29/2013. Source: PHMSA. Red Triangles represent incidents leading to fatalities, and yellow triangles represent those leading to injuries. To access the legend and other controls, click the “Fullscreen” icon at the top-right corner of the map.
It is clear from the map that there a few data entry errors, as a few of the data points draw in locations that aren’t even in the jurisdiction of the United States. However, each entry also contains a city and state that the incident is associated with, and for the most part, the data seem to be fairly reliable.
Take a look at the Center for Biological Diversity web site and the new time-lapse
video showing the significant pipeline incidents since 1986 in the continental US.
There have been nearly 8000 incidents and over 500 deaths. These are from the
data reported by the pipeline industry to the federal Pipeline and Hazardous
Materials Safety Administration. This is the same data set used for the plot shown
here, but over a longer period of time.
Despite the industry’s claim that pipelines are getting safer, the data show
that the rate of deaths per year has not gone down at all in the last 25 years.
I work for a telecommunications company in the KC, Mo. area and specialize in underground cable installation. I work hand in hand with power and light, water, phone, gas, and waste management services. This map is totally inaccurate. Please dont believe everything you see on the internet.
K,
If you observe errors in the datasets, please notify the US Department of Transportation Pipeline and Hazardous Materials Safety Administration, as these datasets are published by that agency. We linked to the data source above, but here is is again for good measure.
Just north of Charleston, WV this was reported as an “unintentional release of natural gas,”
http://www.npr.org/blogs/thetwo-way/2012/12/13/167169109/no-alarm-sounded-when-the-west-virginia-pipeline-exploded
I think “release” is a MAJOR understatement when you are looking at a massive flamethrower that cooked I-77. Great map though! Thanks for making this more visible…
David, you’re right, it is an understatement. The original data contains hundreds of columns of data, some of which are more descriptive about the event that occurred. FracTracker decided to limit the available data, both because the file size would slow down the map performance, but also because it’s pretty overwhelming to look through all of that data.
I live near a lot of pipelines and know that the Texas Railroad Commission doesn’t even know where all the pipelines in Texas lie.
You missed one: http://www.sltrib.com/sltrib/news/56049035-78/pipeline-lake-salt-willard.html.csp
Yikes. There could be a couple explanations for why this incident is not on the map. It could be that the incident is included, but was given faulty latitude and longitude data. For example, a deadly Allentown, PA event appears on the map in the middle of Greenland, because whoever entered the data mixed up the latitude and longitude values. Or it could be that the paperwork for that event had not been completed by the time the dataset was released on March 29, 2013.
Bottom of the barrel and we are going to Kill our Water? Just for those last few drops and dollars? I don’t buy this one!