Crime and the Utica Shale
By Ted Auch, OH Program Coordinator, FracTracker Alliance
No matter where you live in Ohio you have probably asked yourself if crime trends will be – or have already been – affected by the shale gas boom.
To quantify the relationship between crime rates and oil and gas development, we compared 14 OH counties (that have more than 10 Utica permits) to statewide safety metrics. Ohio State Highway Patrol’s Statistical Analysis Unit provided us with the necessary crime data. From this dataset, we chose to analyze several metrics:
a. three types of arrests,
b. two types of violations and accidents, and
c. misdemeanors and suspended licenses (as proxies for changes in safety).
 |
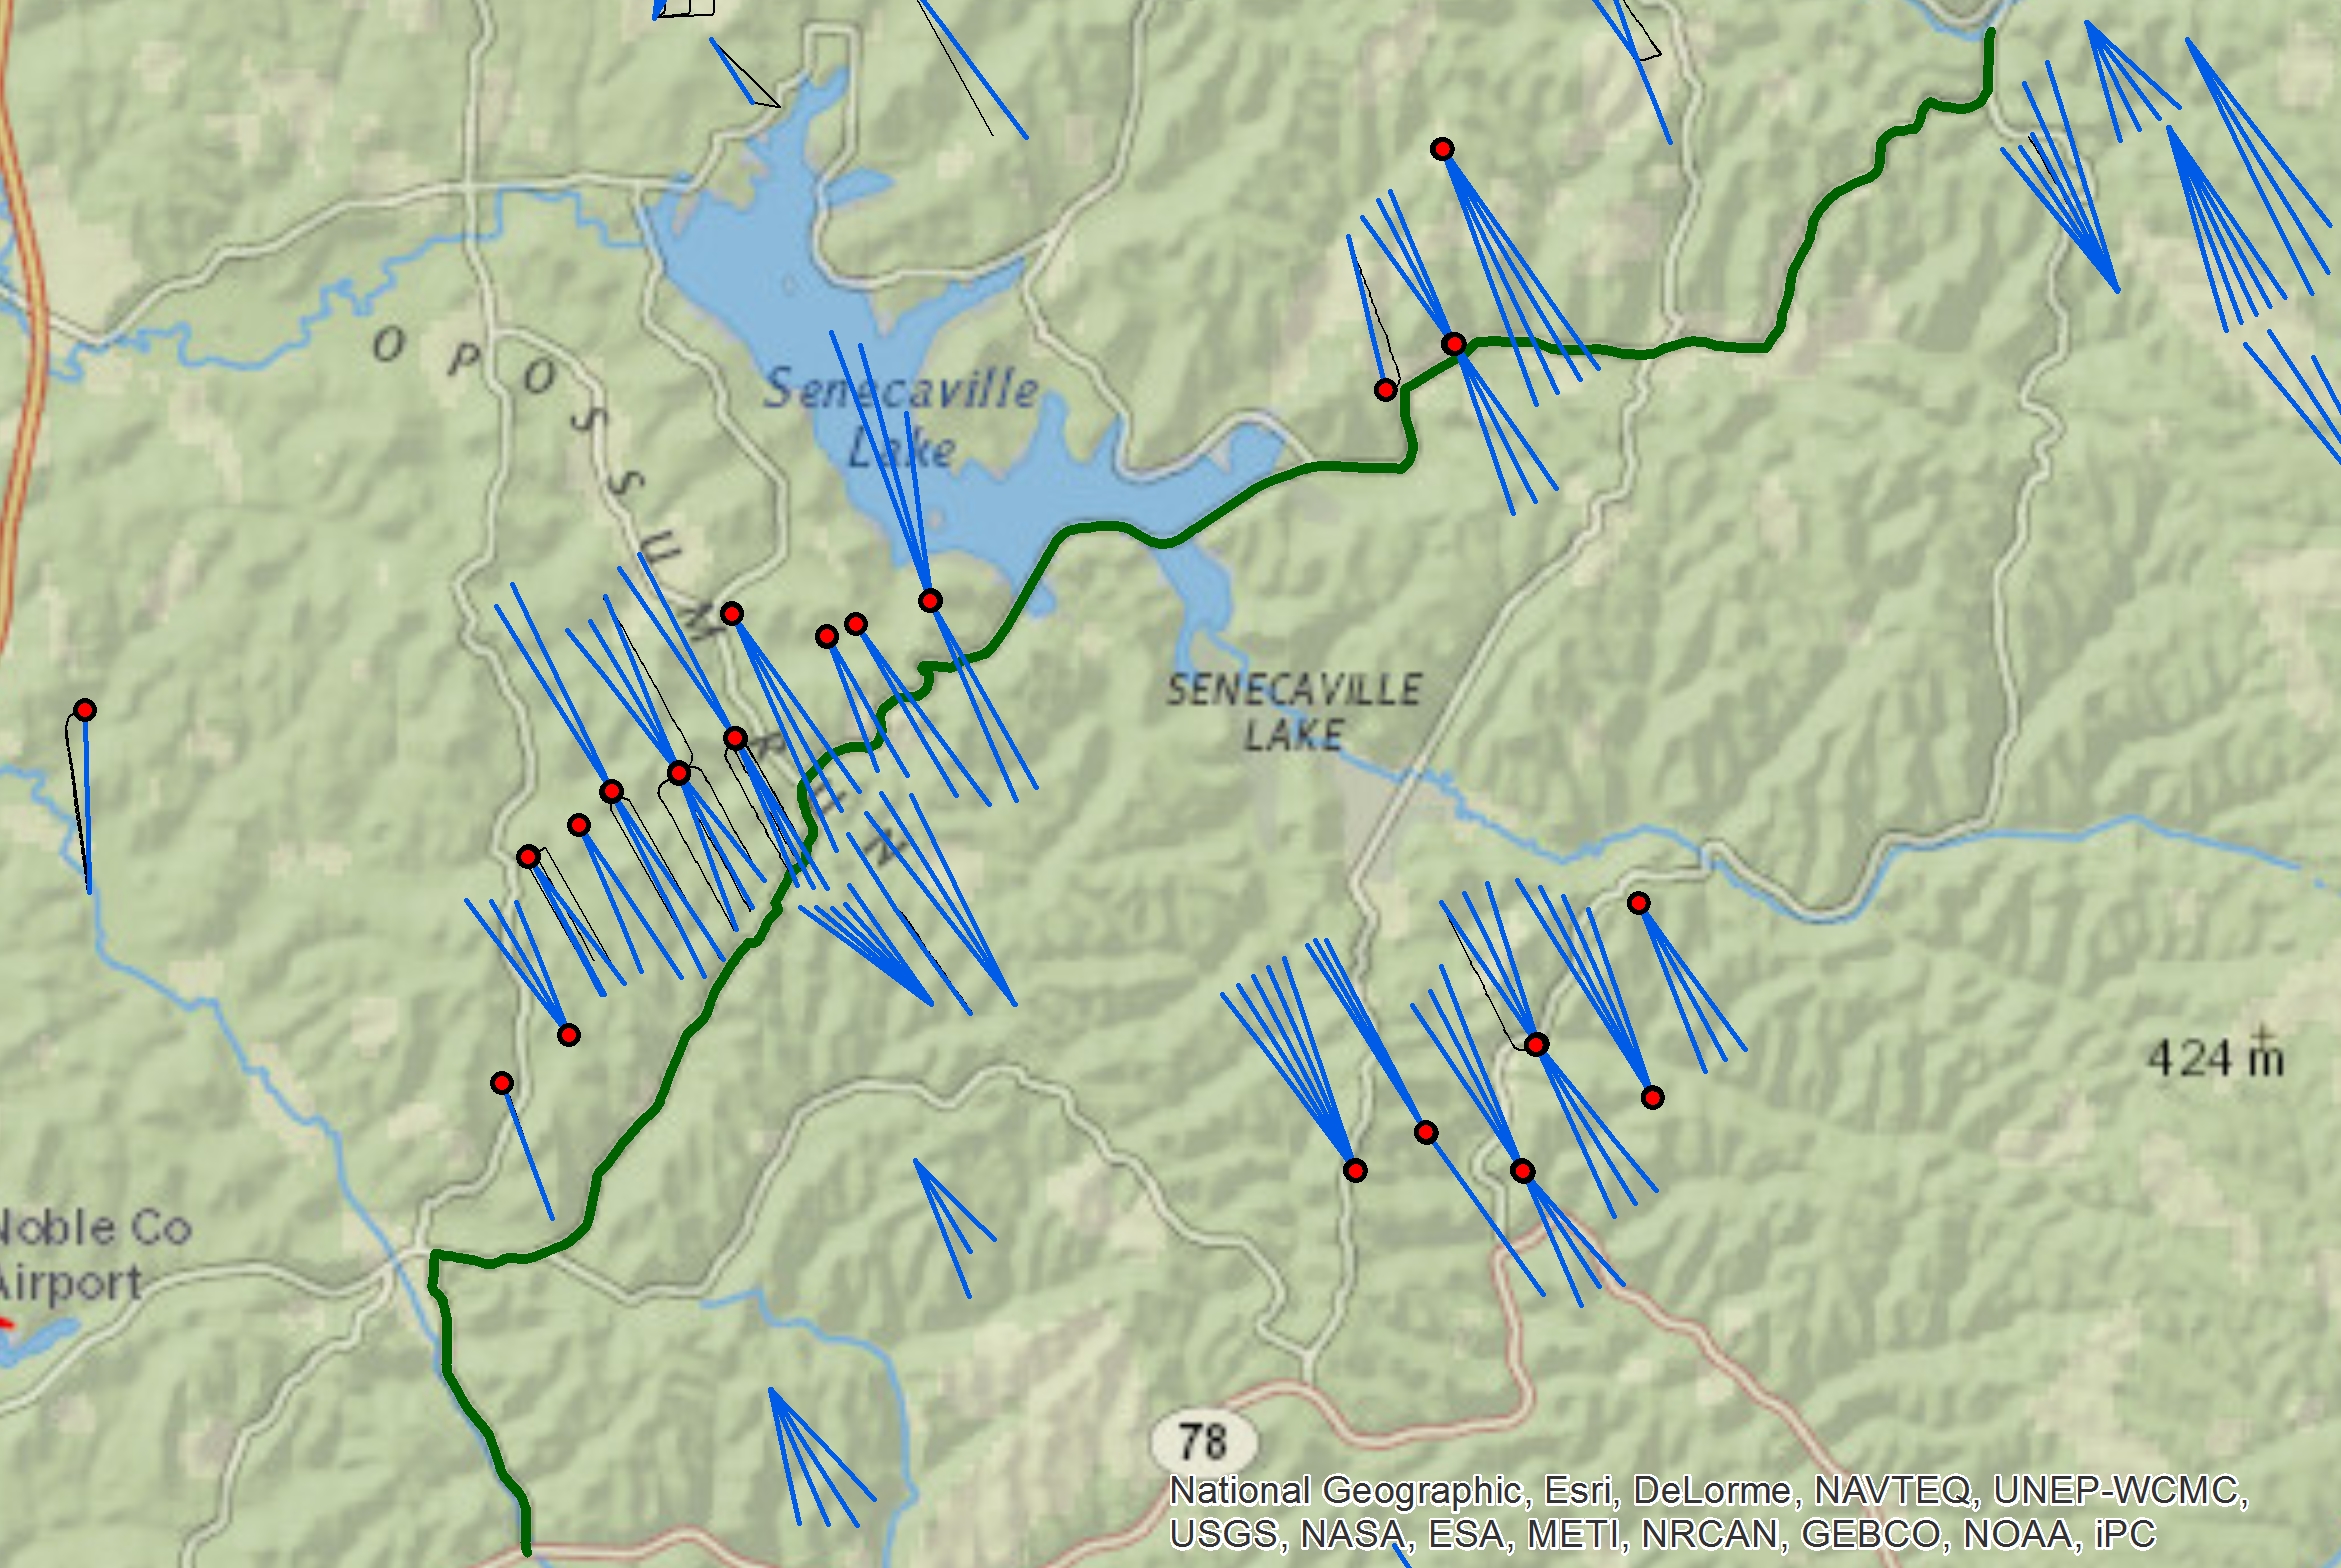 |
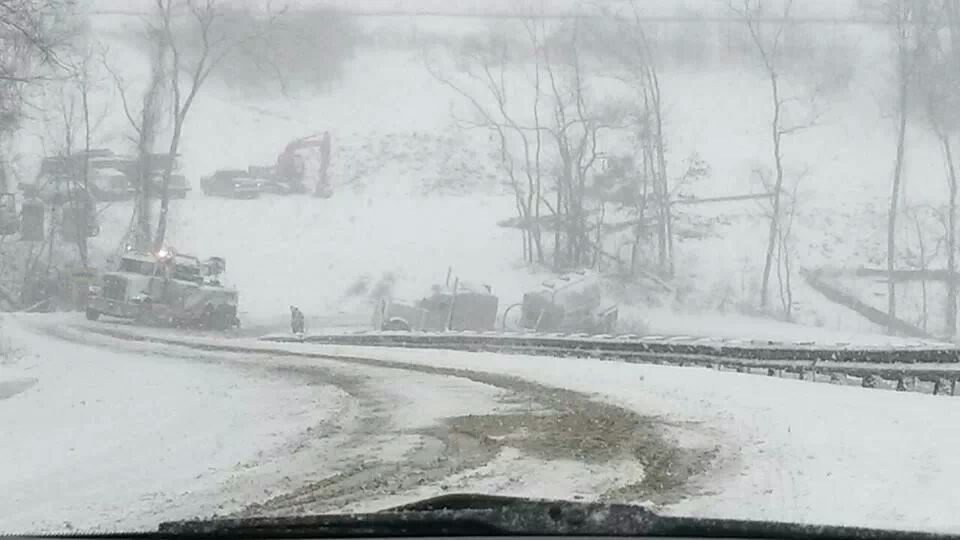
| Accident involving truck carrying freshwater for fracking between Jan. 20 and 27 of 2014 during snowstorm adjacent to Seneca Lake, Noble and Guernsey Counties, OH adjacent to Antero pad off State Route 147 | Map of Senaca Lake, OH Jan 2014 frackwater truck accident including producing or drilled Antero wells (Red Points) and laterals along with State Route 147 |
Crunching the Data
The data in Table 1 below are corrected for changes in population at the state level (+0.2% per year) and at the county level, with the annualized rate for the counties of interest ranging between -2.2% in Jefferson and -0.05 in Tuscarawas. We used the first four months of 2014 to determine an annualized rate for the rest of 2014. Since the first Utica permit was issued on Sept. 28, 2010, we assumed that the 2009 data would be an close measure for the ambient levels for the nine crime metrics we investigated across Ohio prior to shale gas development.
Statewide Crime Trends
Overturned frac sand trucks in Carroll County, OH May, 2014 (Courtesy of Carol McIntire, The Free Press Standard)
Commercial Vehicle Enforcements (CVE) and Crashes Investigated are the only metrics that increase by 8.9% and 6.9% per year, larger than the statewide averages of 2.8% and 6.0%. Respectively, 10 of the 14 shale gas counties have experienced rates that exceed the state average. Noble, Harrison, Columbiana, Carroll, and Monroe are experiencing annualized CVE increases that are 15-57% higher than Ohio as a whole.
Meanwhile, Crashes Investigated are increasing at a slower pace relative to the state wide average, with Carroll, Noble, and Jefferson counties experiencing >5% rate increases relative to the entire state (Table 1). There is a strong increasing linear relationship between the number of Utica permits and the average percent change in CVE and Crashes Investigated. The former accounts for a combined 66% change in the latter. From a macro perspective, the Utica counties accounted for 19.8% of all OH CVEs in 2009 prior to shale gas exploration and now account for 25.1% of all CVEs. Crashes Investigated as a percentage of state totals, however, only increased from 21.3% to 21.7%.
The other variable that is significantly and positively correlated with Utica permitting at the present time is the number of Suspended License reports, with the former explaining 22% of the average annual change in the latter since 2009.
Given that we investigated changes in nine public safety metrics we thought it would be worth categorizing the fourteen counties by state wide averages:
- Significantly Less Safe (SLS) – >5 of 9 metrics increasing,
- Noticeably Less Safe (NLS) – 4 metrics, and
- Marginally Less Safe (MLS) – <3 metrics.
Our findings support that about half the Utica counties fall within the SLS category, with Harrison, Jefferson, Columbiana, and Trumbull experiencing higher relative rates across seven or more of the metrics investigated. Trumbell specifically has had public safety rate increases that are greater than the state in all categories but for Suspended Licenses. Guernsey and Washington counties fall within the NLS category; both are seeing elevated Resisting Arrests and CVEs relative to changes in statewide rates. Surprisingly, Carroll County, home to 404 Utica permits as of the middle of May 2014, falls within the MLS category with only two of nine metrics increasing at a rate that exceeds the state’s. However, the two metrics that are worse than the state average (Crashes Investigated (+21.4%) and CVEs (59.8%)) are increasing at a rate that is significantly higher than the other Ohio Utica counties. Additional MLS counties include Belmont, Portage, and Monroe, which are in the upper, middle, and lower third of Utica permits at the present time.
Conclusion
While correlation does not mean causation, there is a significant correlation between certain public safety metrics and Utica permitting in Ohio’s primary shale gas counties, specifically when looking at Crashes Investigated and CVEs. Additionally, many of the Ohio Utica counties are experiencing notable increases in criminal activity. Whether this trend will continue to increase in the long-term is uncertain, but the short-term trends are concerning given that these counties populations are decreasing; there is more criminal activity within a smaller population. Finally, these trends will differ based on whether or not county sheriffs and emergency responders working with the Ohio State Highway Patrol have the necessary resources and manpower to address increasing criminal activity. This issue is of concern to most southeastern Ohioans regardless of their stance on fracking. We will continue to monitor these relationships and are working to generate a map in the coming months that illustrates these trends.
Table 1. Average percent change in select public safety metrics across Ohio’s primary Utica Shale Counties relative to parallel changes across the state of Ohio between 2009 and 2014.
|
Percent Change Between 2009 and 2014† |
|||||||||
|
Arrests |
Violations |
|
|
||||||
|
County |
Felony |
Resisting |
OVI |
Weapons |
Drug |
Crashes Investigated |
CVE |
Misdemeanor Issued |
Suspended License |
|
Noble (93, 6‡) |
87.7 |
0 |
10.5 |
16.9 |
16.8 |
11.2 |
50.5 |
11.8 |
7.4 |
|
Harrison (232, 0) |
22.3 |
0 |
35.8 |
0 |
34.3 |
10.1 |
34.7 |
67.1 |
33.3 |
|
Belmont (102, 2) |
12.7 |
5.5 |
2.2 |
17.2 |
20.3 |
10.5 |
4.0 |
16.6 |
10.2 |
|
Jefferson (39, 1) |
50.1 |
3.6 |
11.6 |
43.3 |
45.9 |
11.3 |
12.5 |
42.0 |
10.4 |
|
Columbiana (103, 0) |
20.3 |
-3.8 |
6.9 |
28.9 |
27.1 |
7.9 |
17.8 |
25.9 |
10.6 |
|
Tuscarawas (16, 6) |
41.2 |
28.9 |
7.0 |
0 |
0.8 |
7.6 |
12.0 |
61.4 |
3.6 |
|
Washington (10, 13) |
10.1 |
52.7 |
-2.7 |
47.3 |
19.8 |
8.3 |
4.6 |
19.2 |
2.6 |
|
Stark (13, 17) |
7.3 |
9.4 |
0.3 |
46.4 |
7.2 |
6.7 |
2.6 |
11.1 |
-0.5 |
|
Trumbull (15, 20) |
32.9 |
18.9 |
8.6 |
42.9 |
42.1 |
9.3 |
11.5 |
41.1 |
9.4 |
|
Mahoning (30, 10) |
21.4 |
20.7 |
3.6 |
81.4 |
31.8 |
6.0 |
8.5 |
27.7 |
10.2 |
|
Portage (15, 19) |
80.7 |
4.5 |
4.1 |
85.0 |
40.3 |
3.5 |
1.6 |
15.5 |
7.6 |
|
Guernsey (99, 5) |
22.8 |
32.9 |
8.1 |
14.7 |
10.4 |
2.7 |
11.0 |
10.8 |
7.6 |
|
Carroll (404, 4) |
0 |
0 |
-20.2 |
0 |
-29.1 |
21.4 |
59.8 |
-30.2 |
3.8 |
|
Monroe (80, 0) |
0 |
0 |
-4.1 |
0 |
0 |
97.4 |
50.8 |
20.4 |
27.0 |
|
County |
16.5 |
4.3 |
3.5 |
10.3 |
17.6 |
6.9 |
8.9 |
17.8 |
5.8 |
|
State |
17.4 |
6.7 |
7.3 |
16.5 |
23.6 |
6.0 |
2.8 |
24.5 |
10.5 |
|
% of State 2009 |
14.0 |
17.6 |
19.3 |
18.7 |
16.1 |
21.3 |
19.8 |
17.8 |
18.4 |
|
% of State 2014 |
12.9 |
15.2 |
16.7 |
16.8 |
14.0 |
21.7 |
25.1 |
13.1 |
14.5 |
† 2014 annualized using the first 4 months of the year.
‡ Number of Permitted Utica wells and Class II Salt Water Disposal (SWD) wells as of May, 2014
Interesting. Can you add Figure 2? I think it’s missing [“Meanwhile, Crashes Investigated are increasing at a slower pace relative to the state wide average, with Carroll, Noble, and Jefferson counties experiencing >5% rate increases relative to the entire state (Figure 2).”].
Sara
That was a mistake on my part. In the original format Figures referred to images. Best to simply refer to Table 1.
Thanks
thanks, for the stats on truck accidents and crime in Ohio…..see what more we can find out…..