Five Month Oil and Gas Inspection Data
Between January and May 2011, the Pennsylvania DEP conducted 977 inspections on oil and gas operations, issuing 1,751 violations to drilling and pipeline operators, and 311 enforcement actions. These totals are for all oil and gas operations, including the Marcellus Shale.
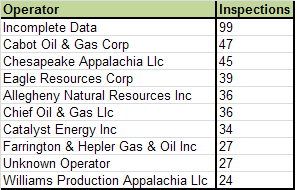
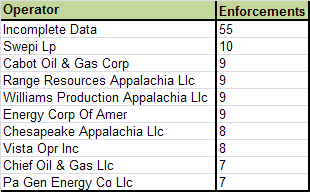
Most inspections by operator, January – May 2011
Two of these entries are similar: “Incomplete Data” and “Unknown Operator”. All but one entry listed as having an unknown operator involved failing to plug and abandoned well, and was issued either on the 17th or 18th of February. Everything else where the operator is unknown is listed as “Incomplete Data”.
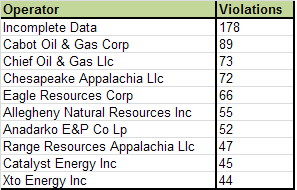
Most violations by operator, January – May 2011
Although this particular analysis does not include details about the wells which were flagged for violations, many of the operators on this list are focused on Marcellus Shale operations in Pennsylvania, including Cabot, Chief, Chesapeake, Anadarko, Range, and XTO. In May, I discussed how there was little overlap between Marcellus and non Marcellus drillers. At that point, the distribution of the only seven companies that drilled one or more of each kind of well in Pennsylvania was as follows:
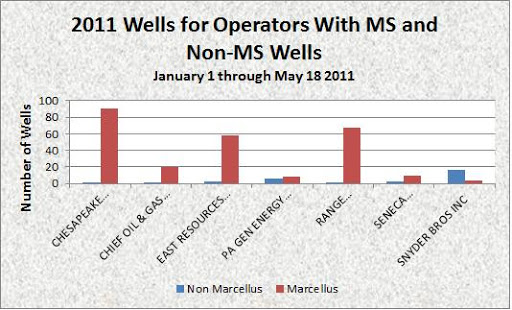
Operators with at least one Marcellus Shale and non Marcellus Shale well between January 1 and May 18, 2011.
Most enforcement actions by operator, January – May 2011
I’m not sure what the point of issuing an enforcement action is when the well operator is not known. There are 187 rows of incomplete data, detailing 178 violations, and 55 enforcement actions. The following columns are missing data for every single row: operator, permit number, county, municipality. It does, however, include penalty amounts issued and total amounts collected, which means that the DEP does have information about at least some of these wells, they just neglected to share it with the rest of us.
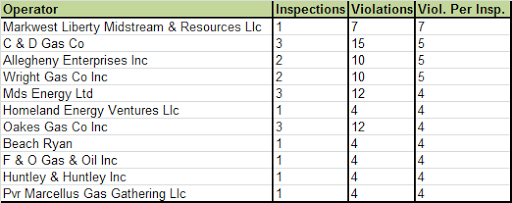
Most violations per inspection by operator, January – May 2011
The list of most violations per inspection is dominated by small, non Marcellus Shale operators, with relatively few inspections.
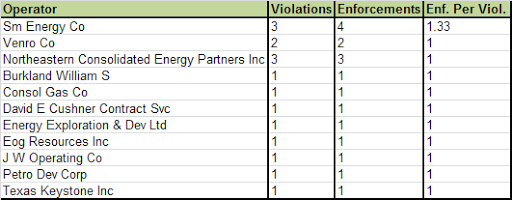
Most enforcement actions per violation by operator, January – May 2011
Similarly, the companies with the most enforcement actions per violation involve those with relatively low sample sizes.
It isn’t clear to me though, what constitutes an enforcement action, and when such an action is deemed appropriate.
Land of Confusion
The last time I checked on Consol, for example, they had no violations. This time, not only is there a violation, but an enforcement action as well. That doesn’t mean that they were given a fine, however–their enforcement description reads, “Notice of violation”. And yet, according to the report, there are 1,751 violations issued but only 311 enforcements, or roughly 18 percent. So when do they get the enforcement of “Notice of violation”?
Curious. But it gets more confusing than that. Although there are only 311 enforcements, there are 729 instances of “notice of violation”, 43 counts of “administrative orders”, 48 instances of “consent assessment of a civil penalty”, and “consent order and agreement” came up four times. That totals 824 enforcement descriptions for only 311 enforcements.
How can this be?
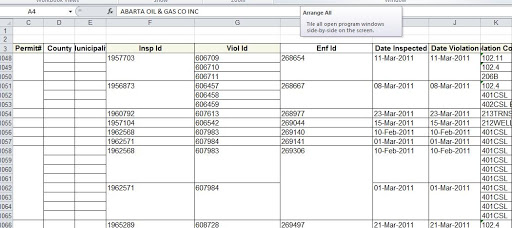
This is an example of what the violations report looks like. The report is set up so that a particular inspection is listed just once, even thought there might be multiple violations that occurred as a result, as is the case for rows 1048-1050. Additionally, multiple violations from different inspections might be covered by the same enforcement ID, as is the case for rows 1058-1065. Although not shown here, there are also instances where the same Violation ID is used more than once, non consecutively.

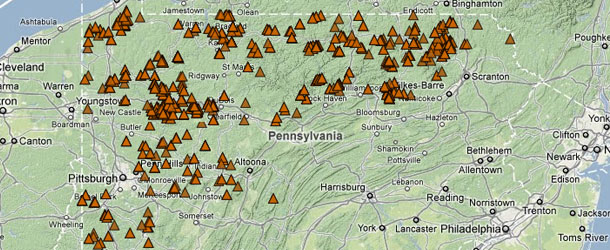
Location of oil and gas violations in PA, January to May, 2011. Click the “i” icon then any map feature for more information.
From my perspective, each row of data should be complete, not only because it is needed for our DataTool to associate all of the information with each map feature, but it also allows for looking deeper into the patterns of where the problems are.
For example, how many of the violations were for non Marcellus Shale wells? The report itself doesn’t say, although there is a separate Marcellus-only report, so you could subtract the total of that from the overall list. But what about horizontal wells? What if you want to know which companies have the worst record at certain types of violations? What if you want to compare the number of violations issued on a monthly basis?
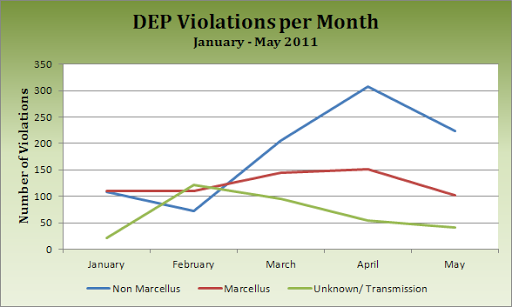
Violations issued by month, January – May, 2011. Values are between 4 and 6 percent overstated on average.
If you want to dig deeper, there is no choice but to fill in the blanks. When I did that for this five month period, however, the values for violations were increase by between four and six percent over the totals that the DEP provided, due to the factors stated above. While that may be a tolerable difference, the same process increases the number of enforcements by 165 percent. Both of these inflated numbers represent actual events. The differences arise more from the standpoint of how violations and enforcement actions are applied.
I applaud the DEP for releasing its oil and gas violation and inspection data so willingly and so thoroughly. At the same time, it could certainly stand to be simplified. As it stands, it isn’t enough to proclaim that “Operator A has seven violations” without answering whether there are any blanks in the data to be filled in, or whether any of the violations included multiple enforcement actions.