US Natural Gas Consumption Patterns
Ever wonder what we do with all the gas we’ve been producing?
In 2011, the United States consumed about 24.4 trillion cubic feet (Tcf) of natural gas, a 2.4 percent increase from 2010. From that total, just over 2 Tcf was used to fuel operations necessary to get the product to market, including production and recovery efforts as well as transportation of the product through pipelines. The remainder of the natural gas, about 22.3 Tcf, made its way to consumers.

Residential, commercial, and vehicle fuel usage have all been relatively flat over the past dozen years, save for a slight dip between 2005 and 2007, when the wellhead price of gas was around $6 to $8 per thousand cubic feet (Mcf). On the other hand, the amount used for electric power has increased 46 percent, while industrial usage has fallen 17 percent over the same period of time.
Much of this variation may be due to external factors, such as changes in industrial production or the fact that price of coal roughly doubled over the same time frame. And as a whole, the United States must have made significant progress in increased residential efficiency, because although there are 32 million more people now than in 2000, the residential sector actually saw a slight decrease in overall natural gas consumption.
But has the recent surge in domestic drilling activity reduced our dependence of foreign oil? Although oil imports were about one third less in 2011 than the 2005 peak, many experts think that is due to a combination of high prices (due mainly to Asian demand) and the less-than-robust US economy making fill-ups at the pump more painful, and therefore, less frequent.
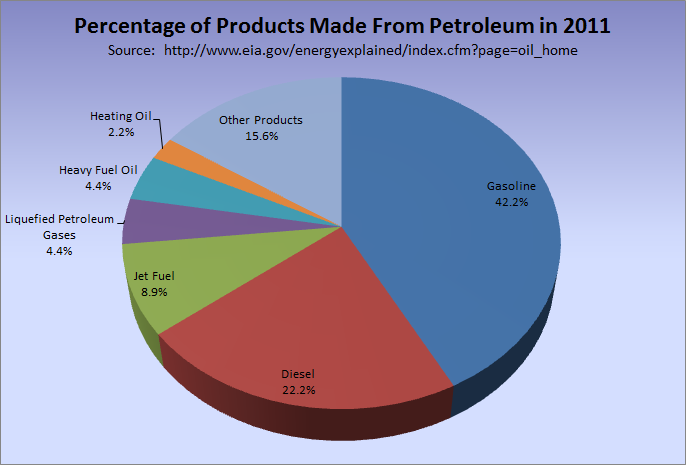
Consider that in the United States, the way we use natural gas and petroleum are really quite different. While many developing nations have millions of natural gas vehicles, the United States had fewer than 120,000 compressed natural gas (CNG) and liquefied natural gas (LNG) powered vehicles in 2010, explaining why vehicle fuel is barely a factor in the chart above. Compare that to petroleum, below, where gasoline, diesel, and jet fuel account for nearly three quarters of all petroleum usage:
Consumers can hardly be faulted for not buying natural gas powered vehicles: according to an interactive map on the US Department of Energy site, there are exactly seven CNG filling stations within a 100 mile radius of downtown Pittsburgh, and no LNG stations within that area.
So natural gas is not yet a major factor in replacing our primary use of petroleum, which is really to move people and things around. That could change though, if production remains high and prices remain low. That last part might be what has prevented a movement toward natural gas vehicles: currently, the price of CNG is about $2.13 per gallon equivalent, but if gas prices go back up to around $8 per Mcf (from the current $2.78) then gas may not seem like such a good deal again. One can only presume that fluctuations such as those factor into why the investments for CNG and LNG infrastructure is so limited.