Pennsylvania Unconventional Waste Data
As we recently learned with unconventional production report, one never quite knows when Pennsylvania Department of Environmental Protection (PADEP) datasets are complete. According to the Post-Gazette, PADEP considers the reports to speak for themselves, and information is shared with the public without preamble or fanfare as it becomes available. Therefore, we can’t know that self-reported data, in this case unconventional waste report, is ever truly complete. Hopefully at this point, which is now several weeks after the reporting deadline, we can let the report speak what it will, expecting that further changes will be fairly minor in scope.
In addition to all of that, some oil and gas operators were apparently confused about the difference between gallons and 42 gallon barrels in the past, leading to wildly erroneous reports. We’ll just have to hope that’s not the case.
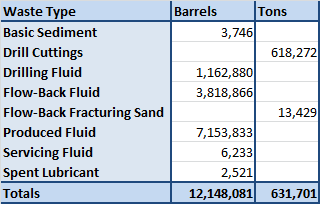
First, let’s take a look a the amount of waste produced by type for unconventional wells between January and June of 2012:
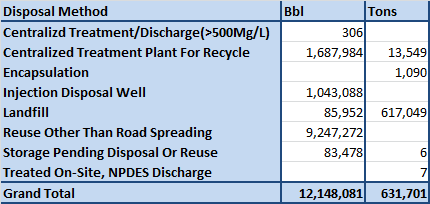
And here is the same dataset, arranged to show disposal method (with the waste types grouped together for the sake of simplicity):
Here are the data arranged by operator:
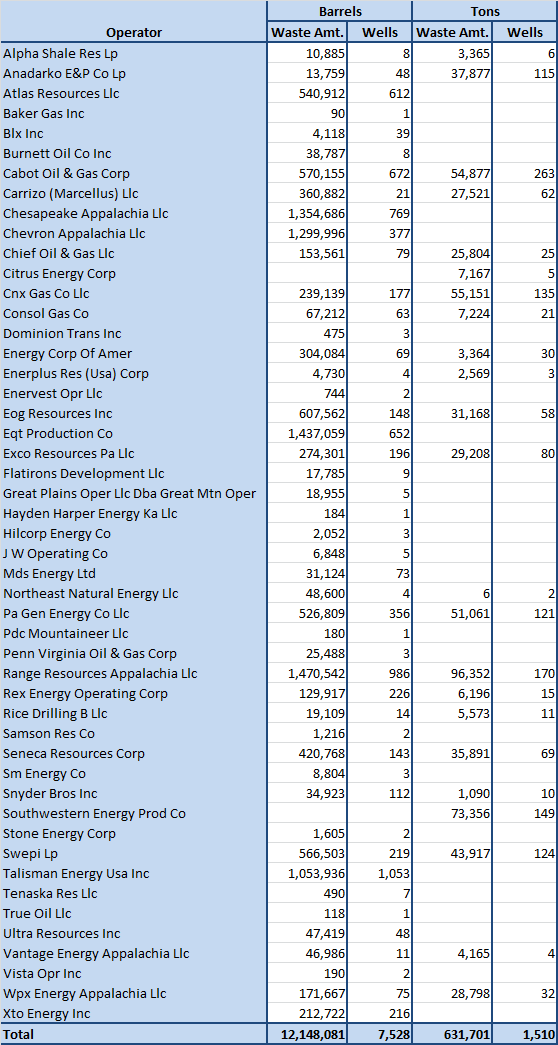
Please note that not all wells that are present on the report are producing waste, or have even been drilled for that matter. In fact, there is a column in the data where operators can explain why there is no waste being reported. Here are those results, summarized:

This does not mean, however, that there are 7,994 wells producing waste. In fact, there are only 5,651 instances of wells reporting at least some amount of one or more kinds of waste, a number roughly in line with the spud count. This number was actually more than I had expected, since it is known that not all of the spudded (drilled) wells have been put into production, and that reported totals for drill cuttings are remarkable modest for a series of holes in the ground that are roughly between 5,000 and 8,500 feet deep. The explanation, it turns out, is due to the architecture of the dataset, wherein each line of data is capable of handling only one type of waste, so that wells reporting multiple types of waste must appear more than once. Therefore, there are not 9,038 wells, or even 5,651. There are 3,922 unique wells on the report, as counted by the unique well API numbers. For this reason, in the charts above, it is best to think of the “Wells” columns as “Instances” instead.
It is also probable that different operators report their waste in different ways. For example, EQT and Chesapeake are both near the top of the list in the amount of barrels of liquid waste produced, but neither one reported any waste that was measured in tons (drill cuttings and flowback fracturing sand). Without having seen their operations in the field, we must assume that the waste produced is fundamentally similar to that of other operators–perhaps they reported the waste content as a viscous fluid rather than filtering out some of the solids, as other operators seem to do.