PA Unconventional Production Data Aggregated
The Pennsylvania Department of Environmental Protection (PADEP) publishes unconventional oil and gas production data twice a year. In its raw form, the data show the production values per well for a given six month period, either January to June or July to December. The FracTracker Alliance has aggregated the five most recent unconventional production reports in Pennsylvania, and organized the data by well.
PA Production data from July 2010 through December 2012. To learn more about the map and access additional tools, please click the Fullscreen icon. To access well production data, please zoom in to 1:750,000 (about the size of a county), then click any well icon.
In the thirty months represented in this data, unconventional wells in Pennsylvania produced almost 3.4 trillion cubic feet of gas, about 490,000 barrels of oil, and 2.8 million barrels of condensate. In terms of geographic distribution, there are thirty-three different counties producing gas, seven counties producing oil, and nine counties producing condensate.
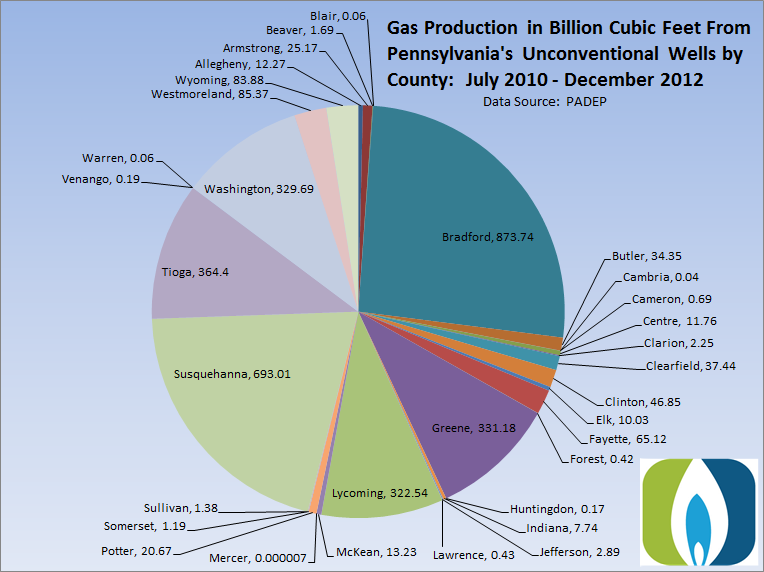
Gas production by PA county from July 2010 to December 2012. Source: PADEP
Over two trillion cubic feet (Tcf), or sixty-one percent of gas production, came from Bradford, Greene, Lycoming, Susquehanna, Tioga, and Washington counties during this period.
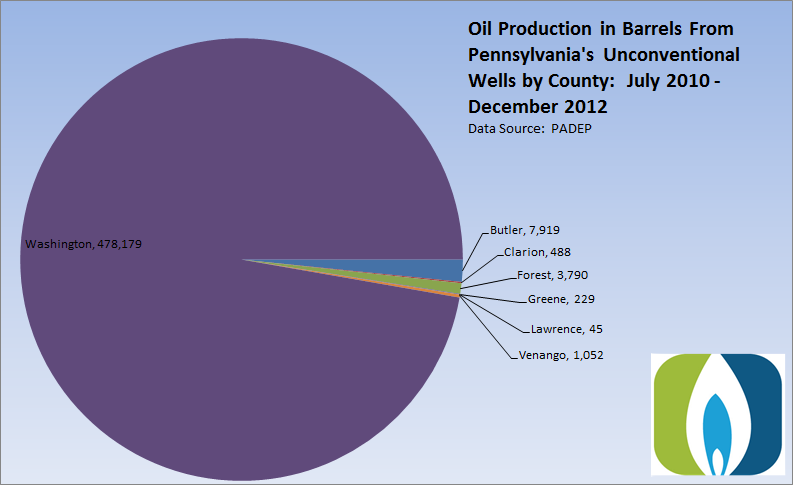
Oil production by PA county from July 2010 to December 2012. Source: PADEP
Over 97 percent of oil production from Pennsylvania’s unconventional wells during the two and a half year period was from Washington County.

Condensate production by PA county from July 2010 to December 2012. Source: PADEP
In addition to providing most of the oil, almost 92 percent of the condensate from Pennsylvania’s unconventional wells came from Washington County as well. Greene County reported 0.01 barrels of condensate production through the thirty month period, but the values here have been rounded to the nearest integer.
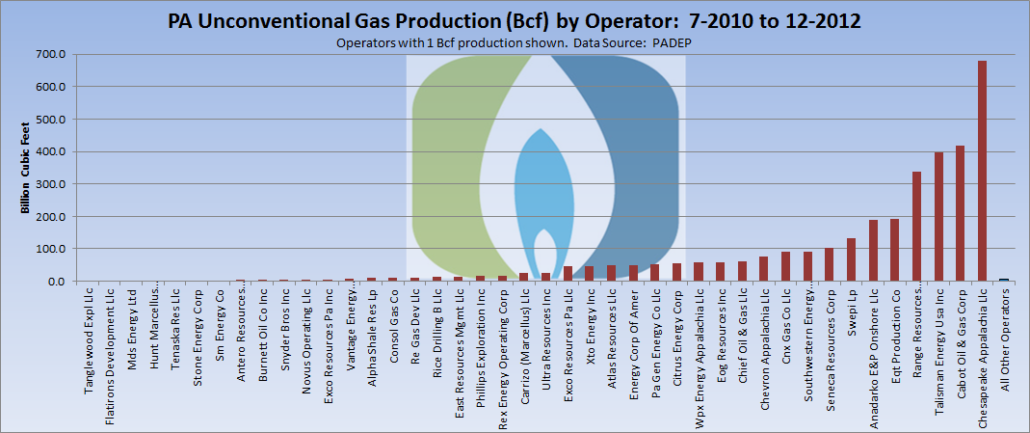
We can also look at the production data sorted by operator:

Gas production in Bcf by operator from July 2010 to December 2012. Source: PADEP
And finally, we can use this data to compare operators in terms of production per well. Below are the normalized production values for the state’s top 20 unconventional gas producers:
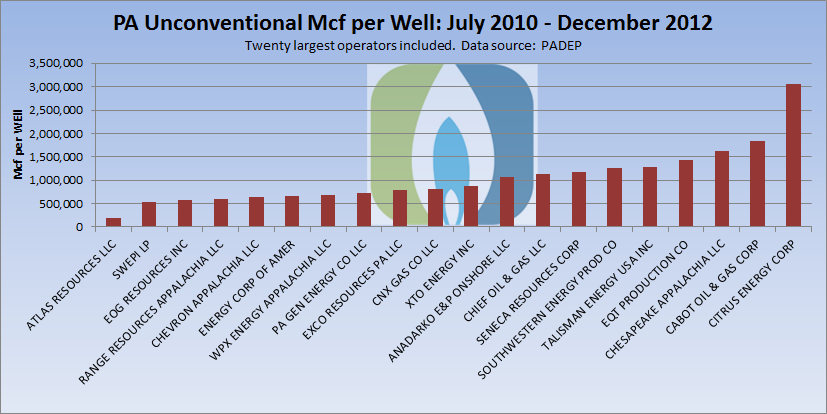
Production per well in thousands of cubic feet (Mcf) by Pennsylvania unconventional operator from July 2010 to December 2012. Note that the well count includes wells reporting production, not the total number of wells on the report.
The aggregated production data can be obtained from our Downloads page.