Is it getting hot in North Dakota?
By Samantha Malone, Manager of Education, Communications & Partnerships, FracTracker Alliance
North Dakota sure is popular recently. You might wonder why ND’s oil and gas development has been such a hot topic when the average monthly temperature there in November is only 27° F. Below we summarize the recent ND coverage and why the state has been the focus of several conversations lately.
The Intensity of Drilling
On November 22nd The New York Times launched a two-part series starting with The Downside of the Boom. Herein, the NY Times highlights how North Dakota’s regulatory system is insufficient to manage a hefty oil and gas industry. Part two in the series looks into Where Oil and Politics Mix in ND. This investigative journalism series questioned how well the state is managing oil and gas development, which was followed quickly by criticism of the series by state officials. If you haven’t checked out this series and its incredible visuals yet, I would highly recommend it.
FracTracker maintains a shale viewer map of North Dakota and its horizontal oil wells if you would like to explore where the industry is operating. Interestingly, ND is one of the few states where the horizontally drilled well data is available to the public. (Horizontal wells jut out from the vertical wells below ground.) Our interactive map of ND includes zooming features, well API information, and a measurement tool to examine horizontal well lengths. The screenshot below shows that one of the laterals on this map extends out two miles underground. Click the map to explore more:
Interactive Map of ND Wells on FracTracker, with Measurement Tool
Alternatively, here the New York Times shows what ND would look like if all of the state’s oil wells were aboveground:

NYTimes Graphic: What North Dakota Would Look Like if Its Oil Drilling Lines Were Aboveground
NPCA
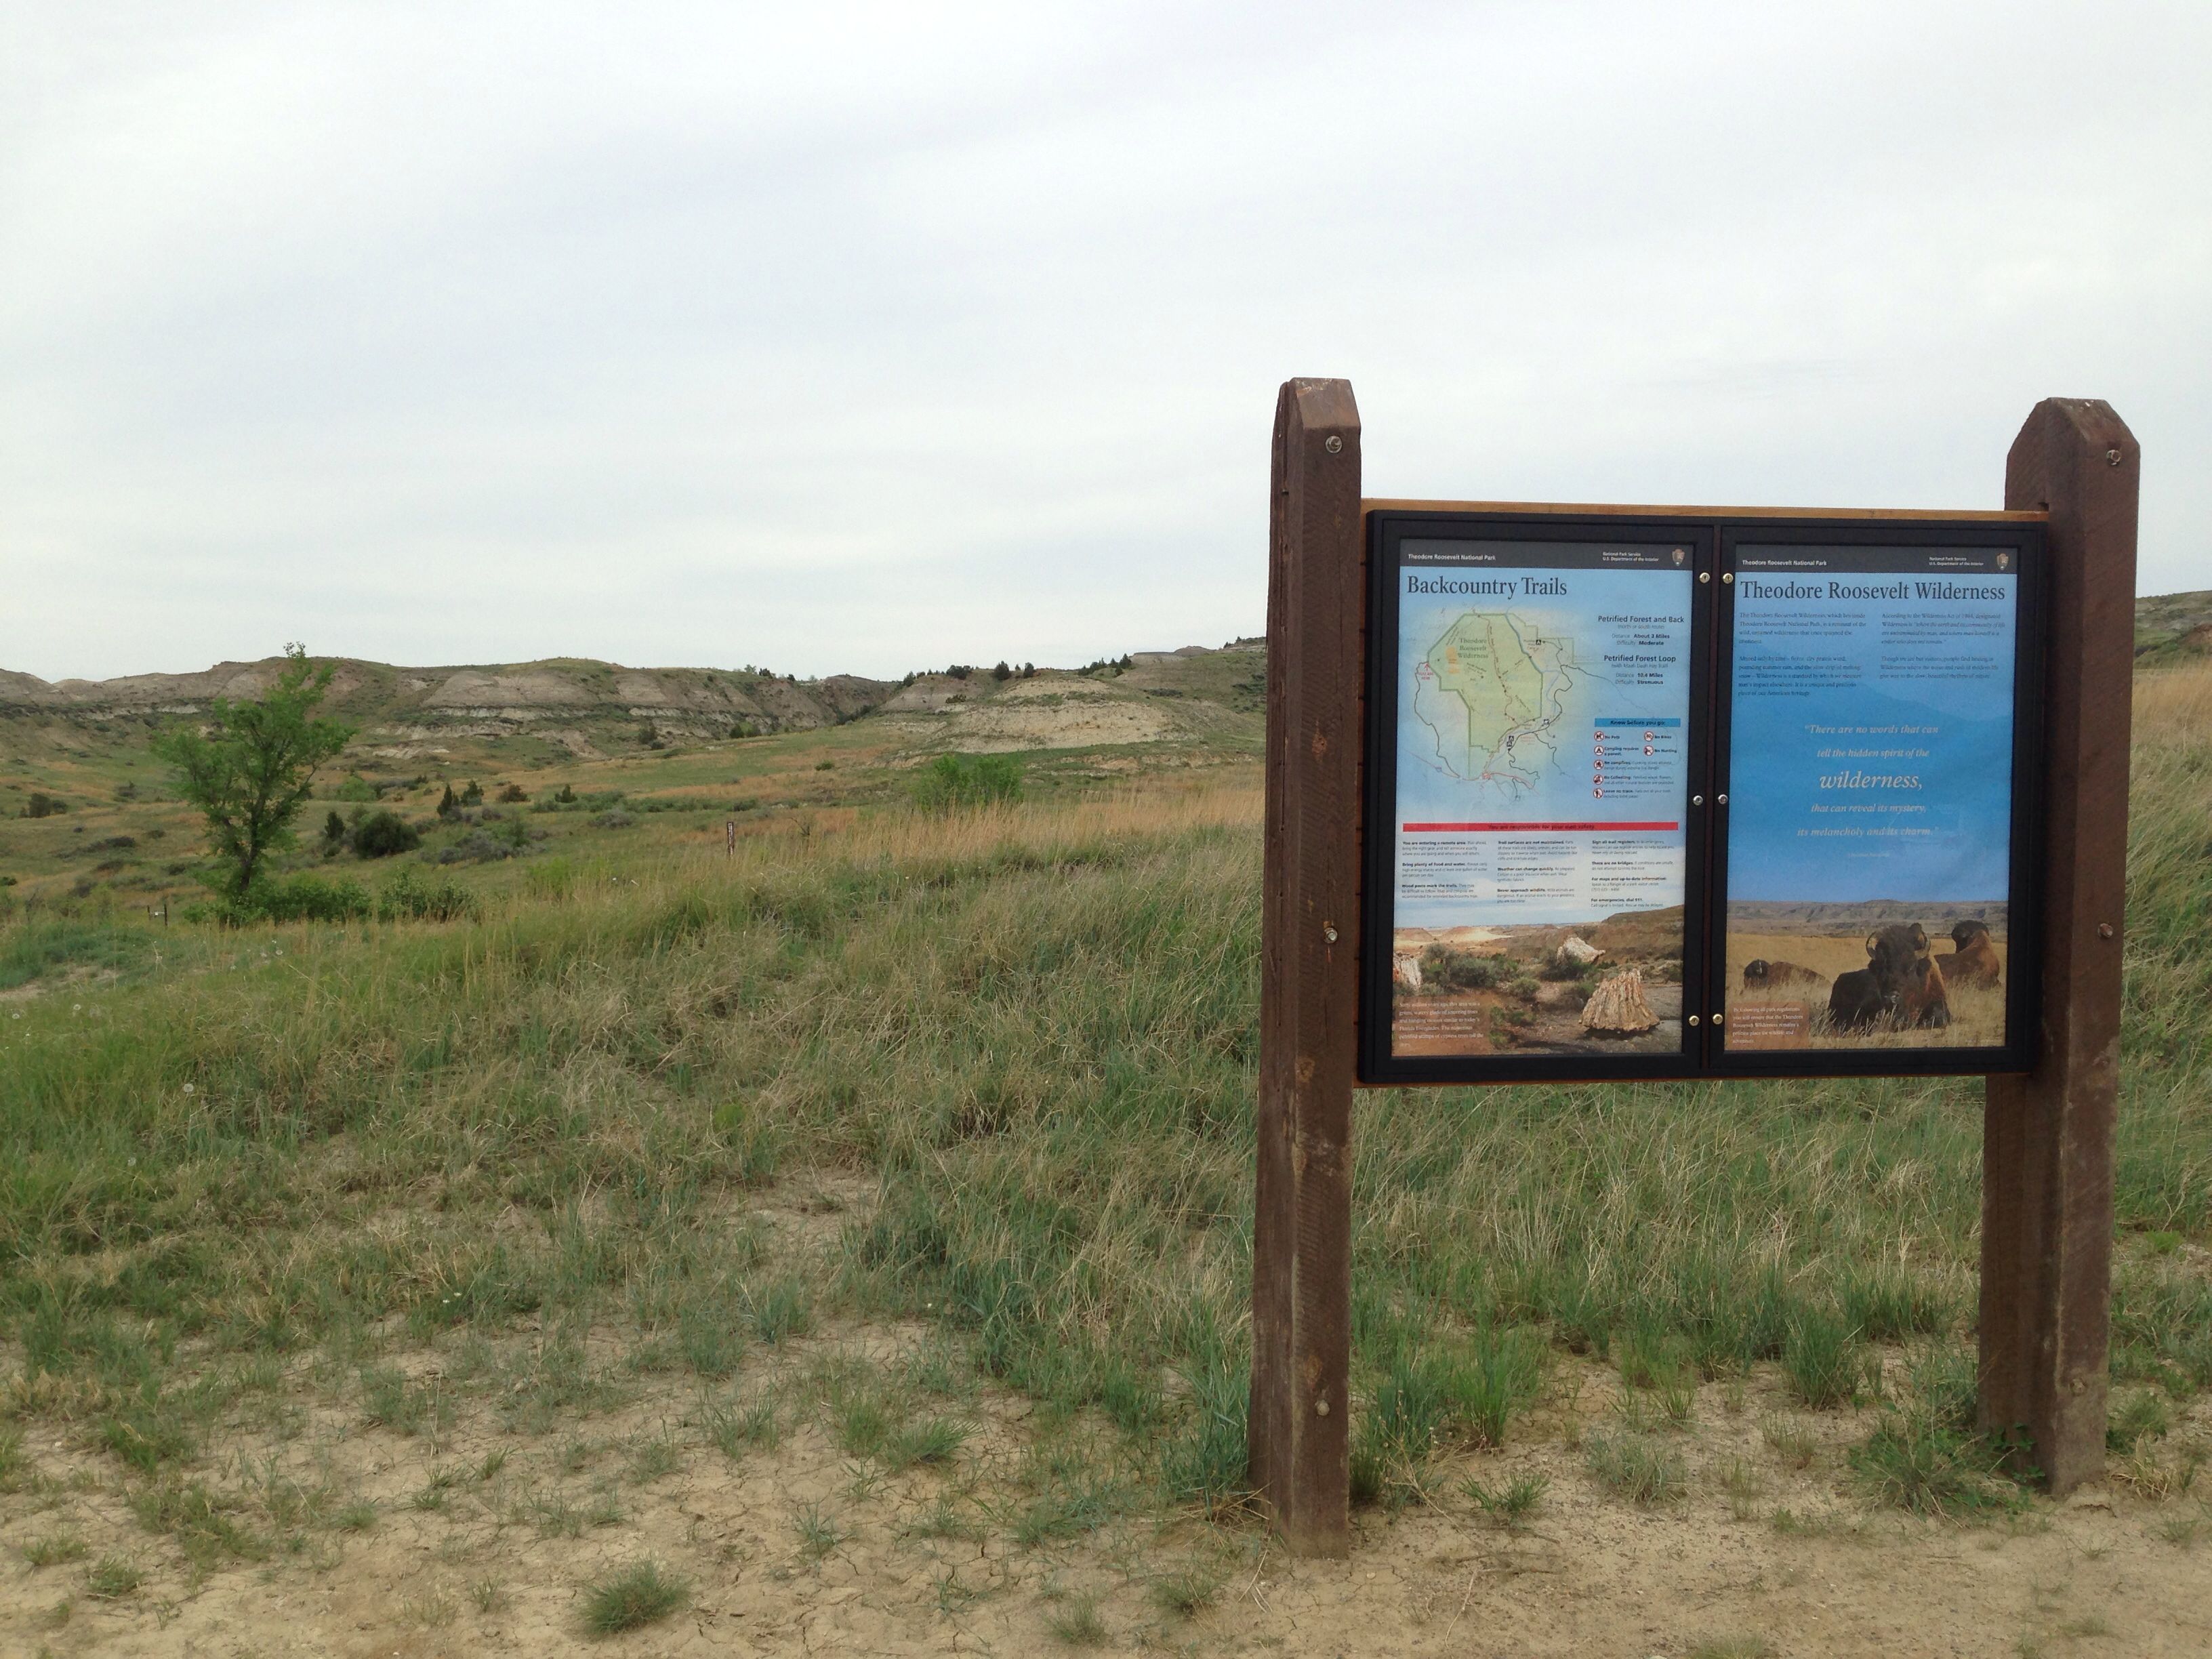
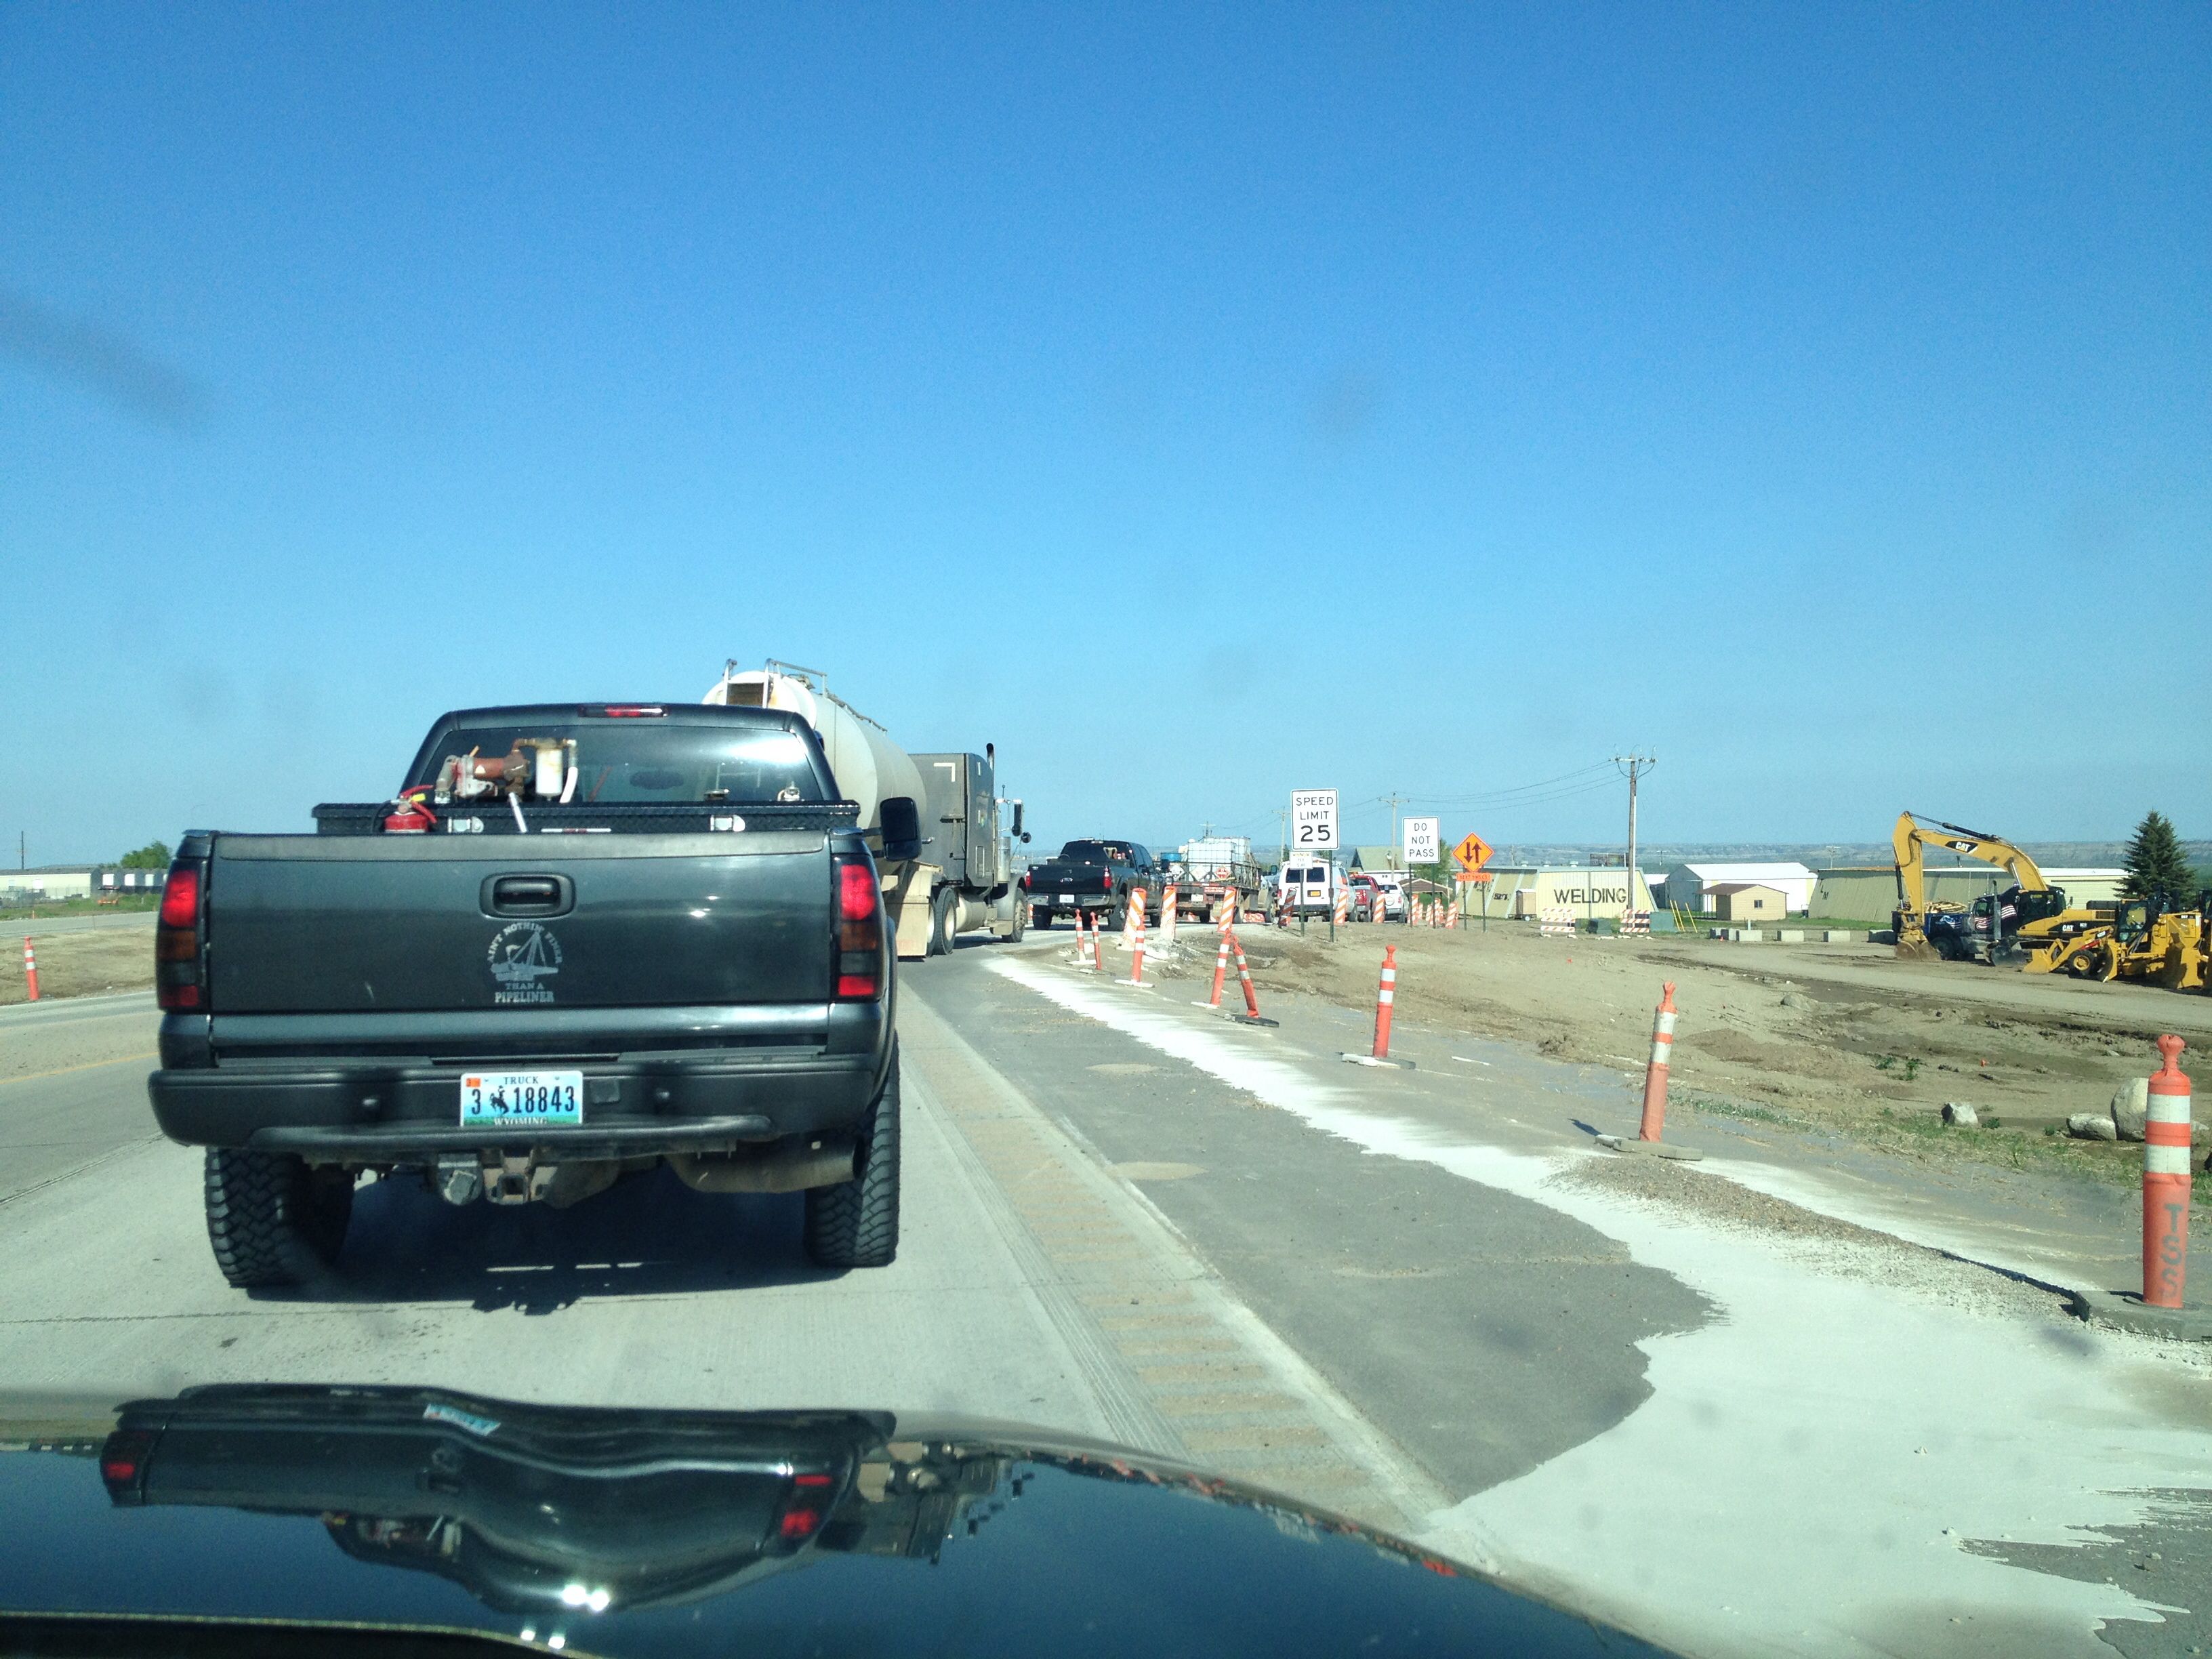
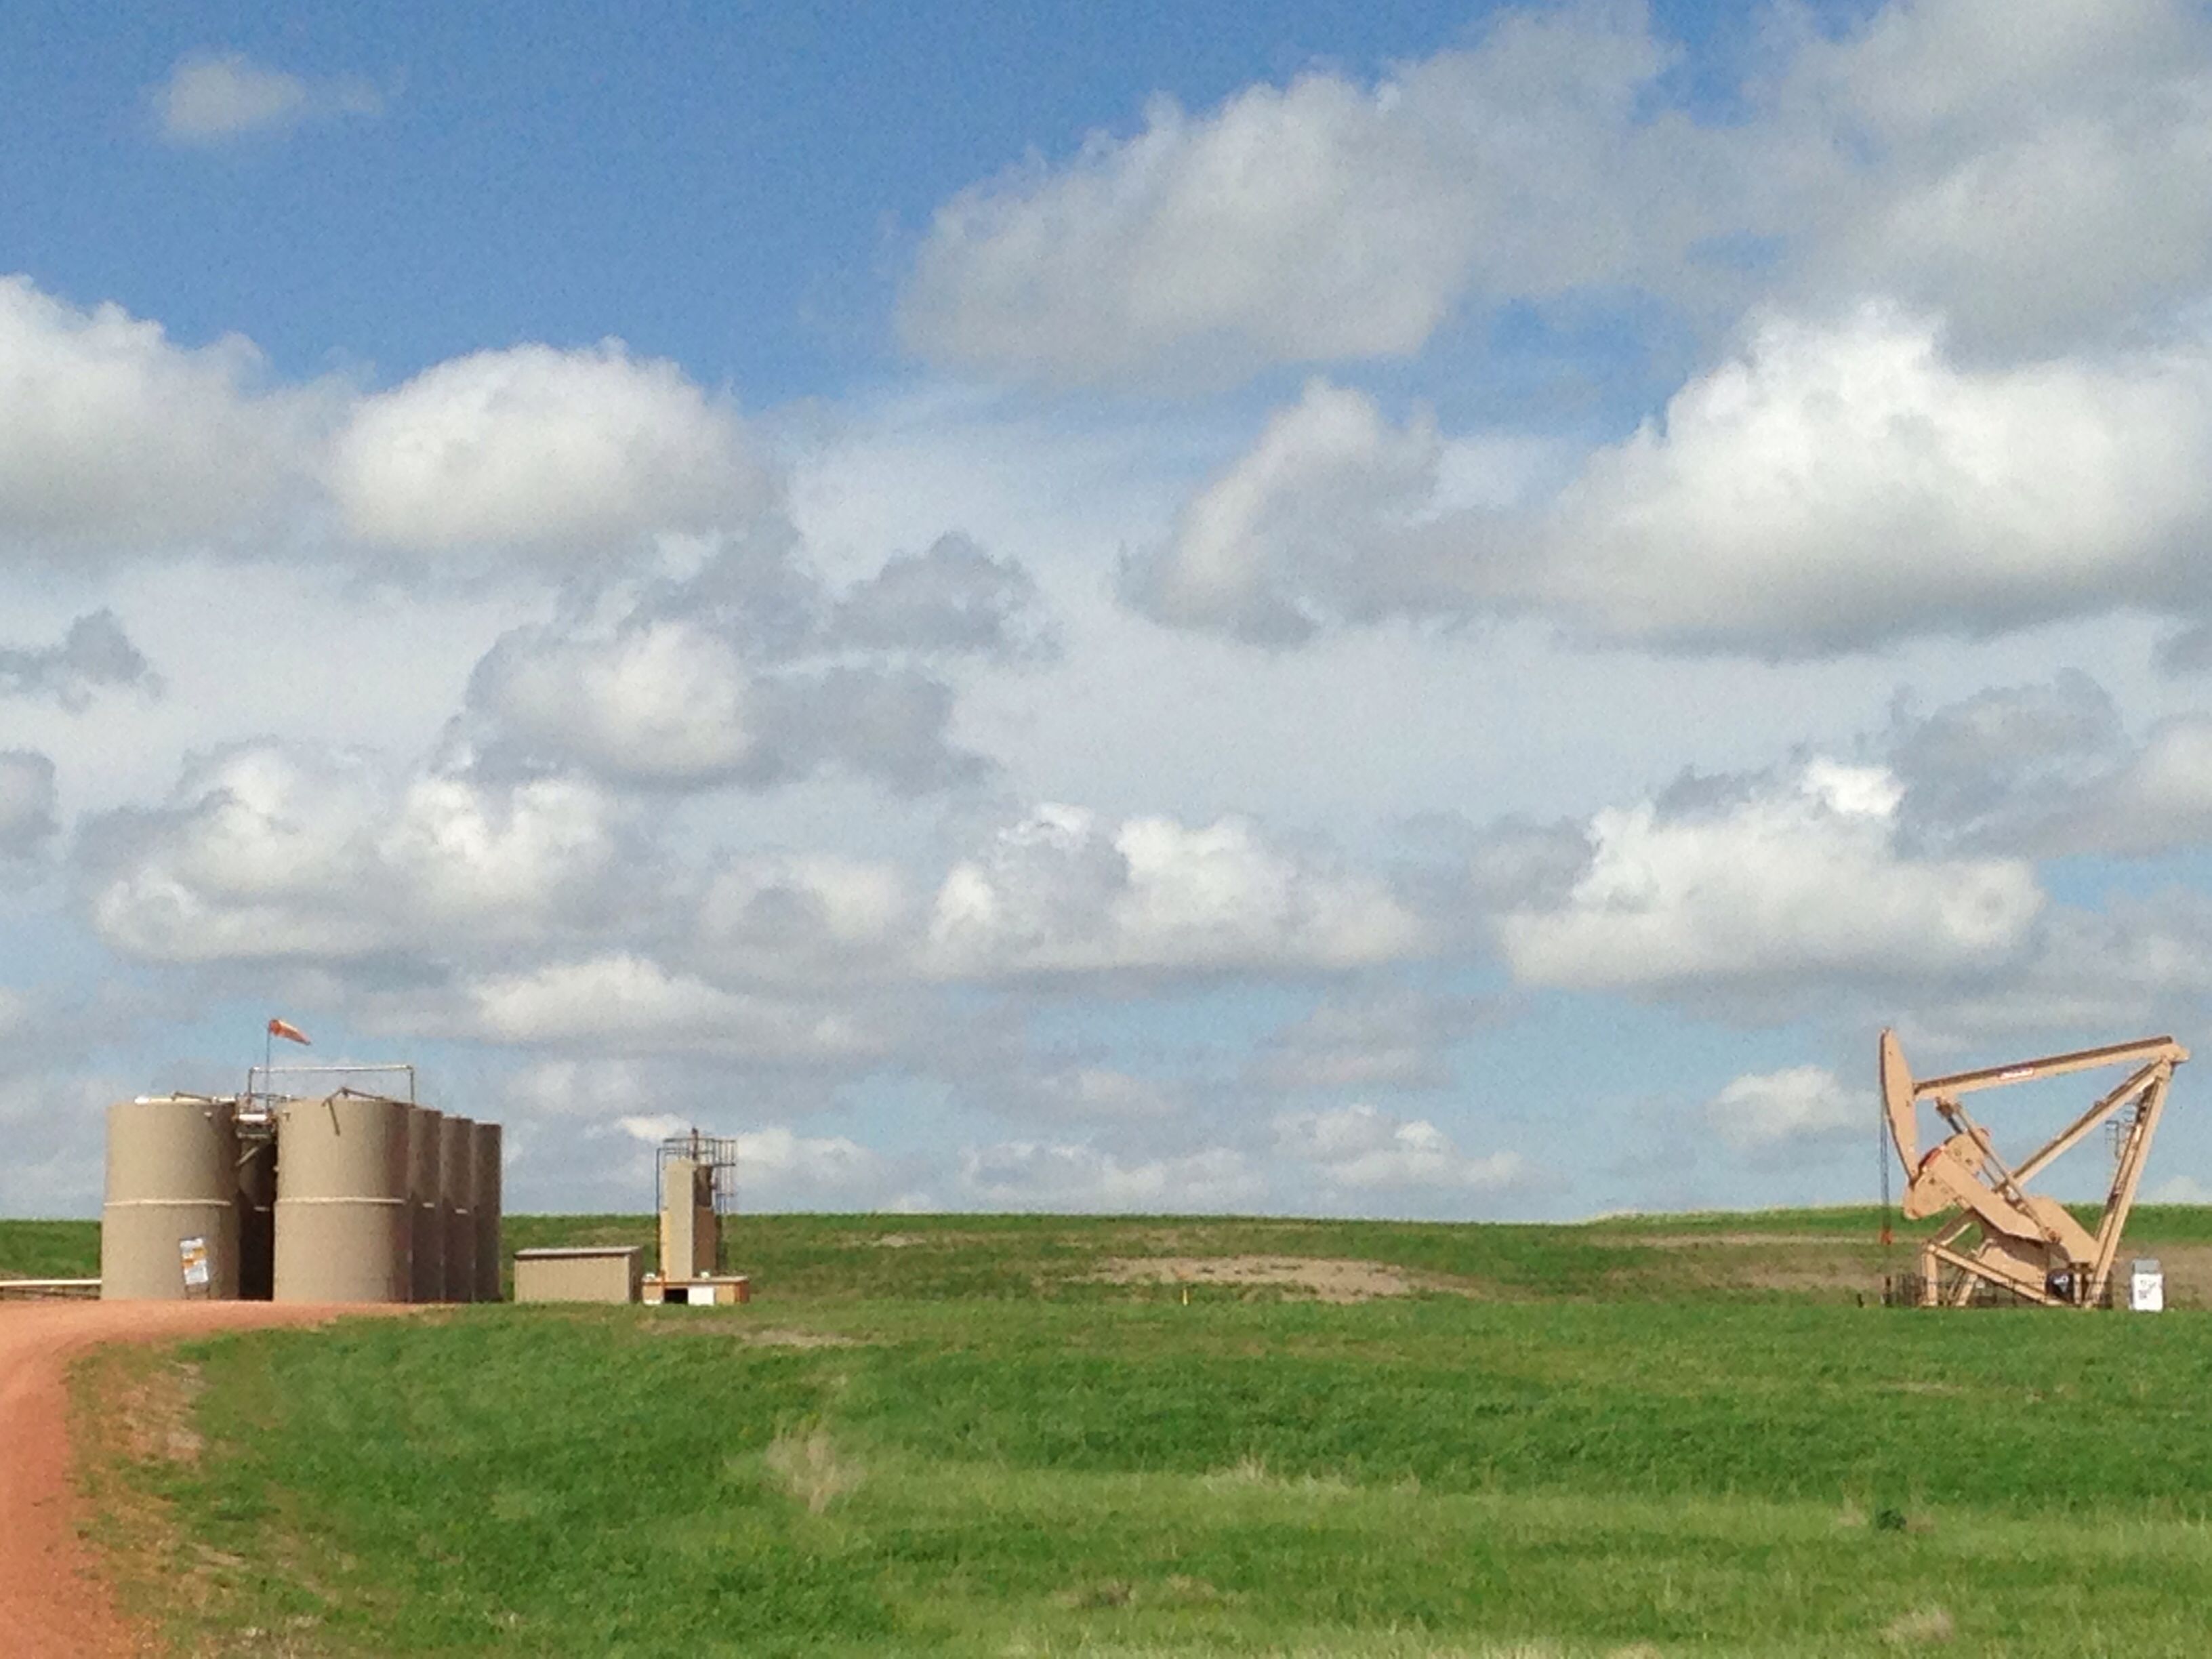
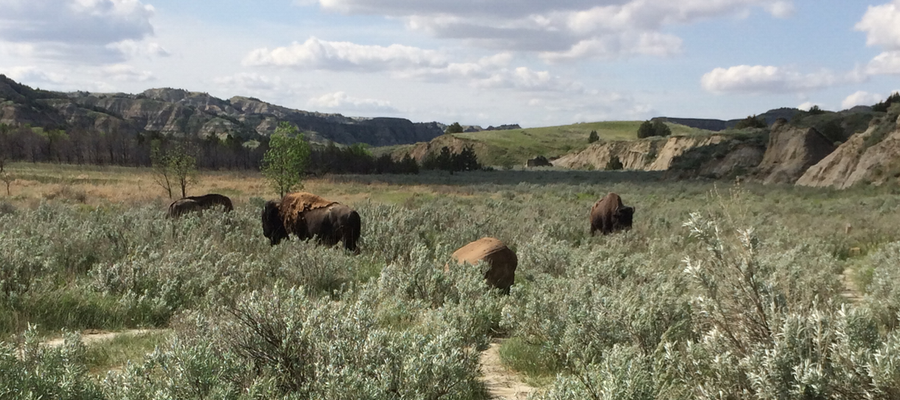
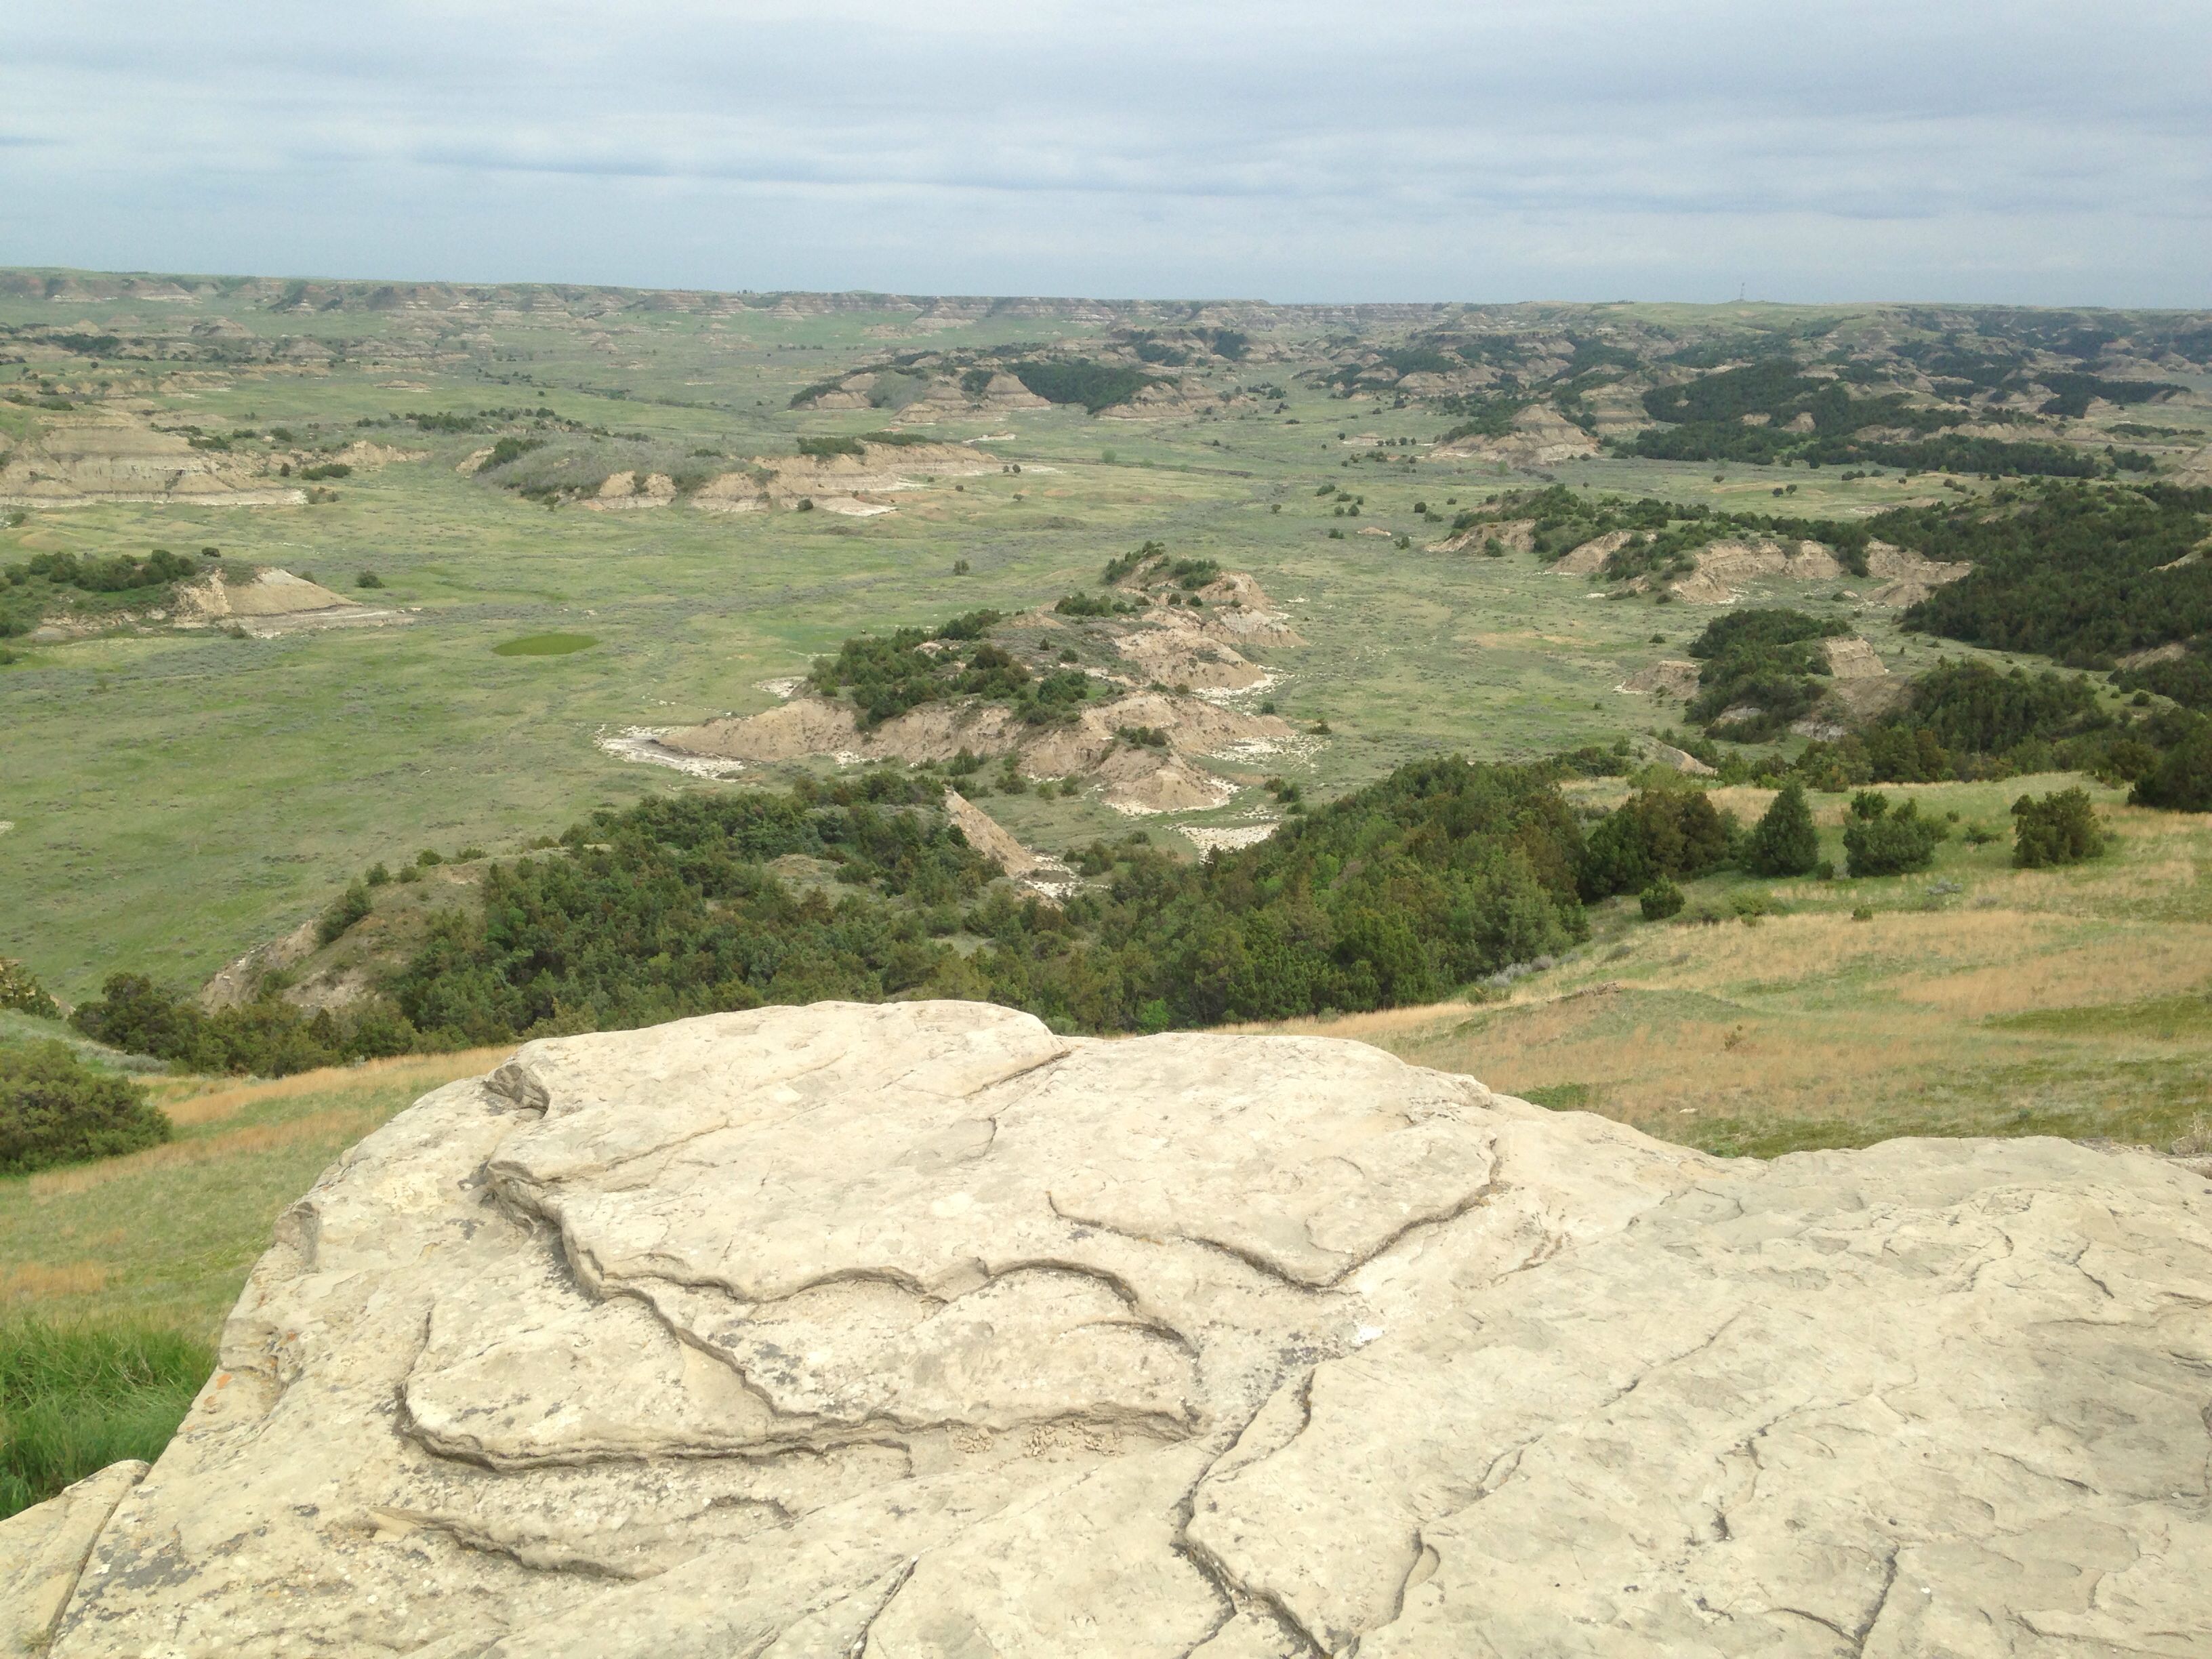
On November 12 and 13, 2014, the National Parks Conservation Association launched their campaign to educate citizens about how oil and gas development may affect America’s national parks. NPCA kicked off their campaign with two events in Pittsburgh and Philadelphia, PA to showcase a crowd-sourced digital map we helped them create with our new mobile app. The map’s photos detail the scale of oil and gas development near North Dakota’s Theodore Roosevelt National Park and is shown below:
NPCA Photo Map. View fullscreen
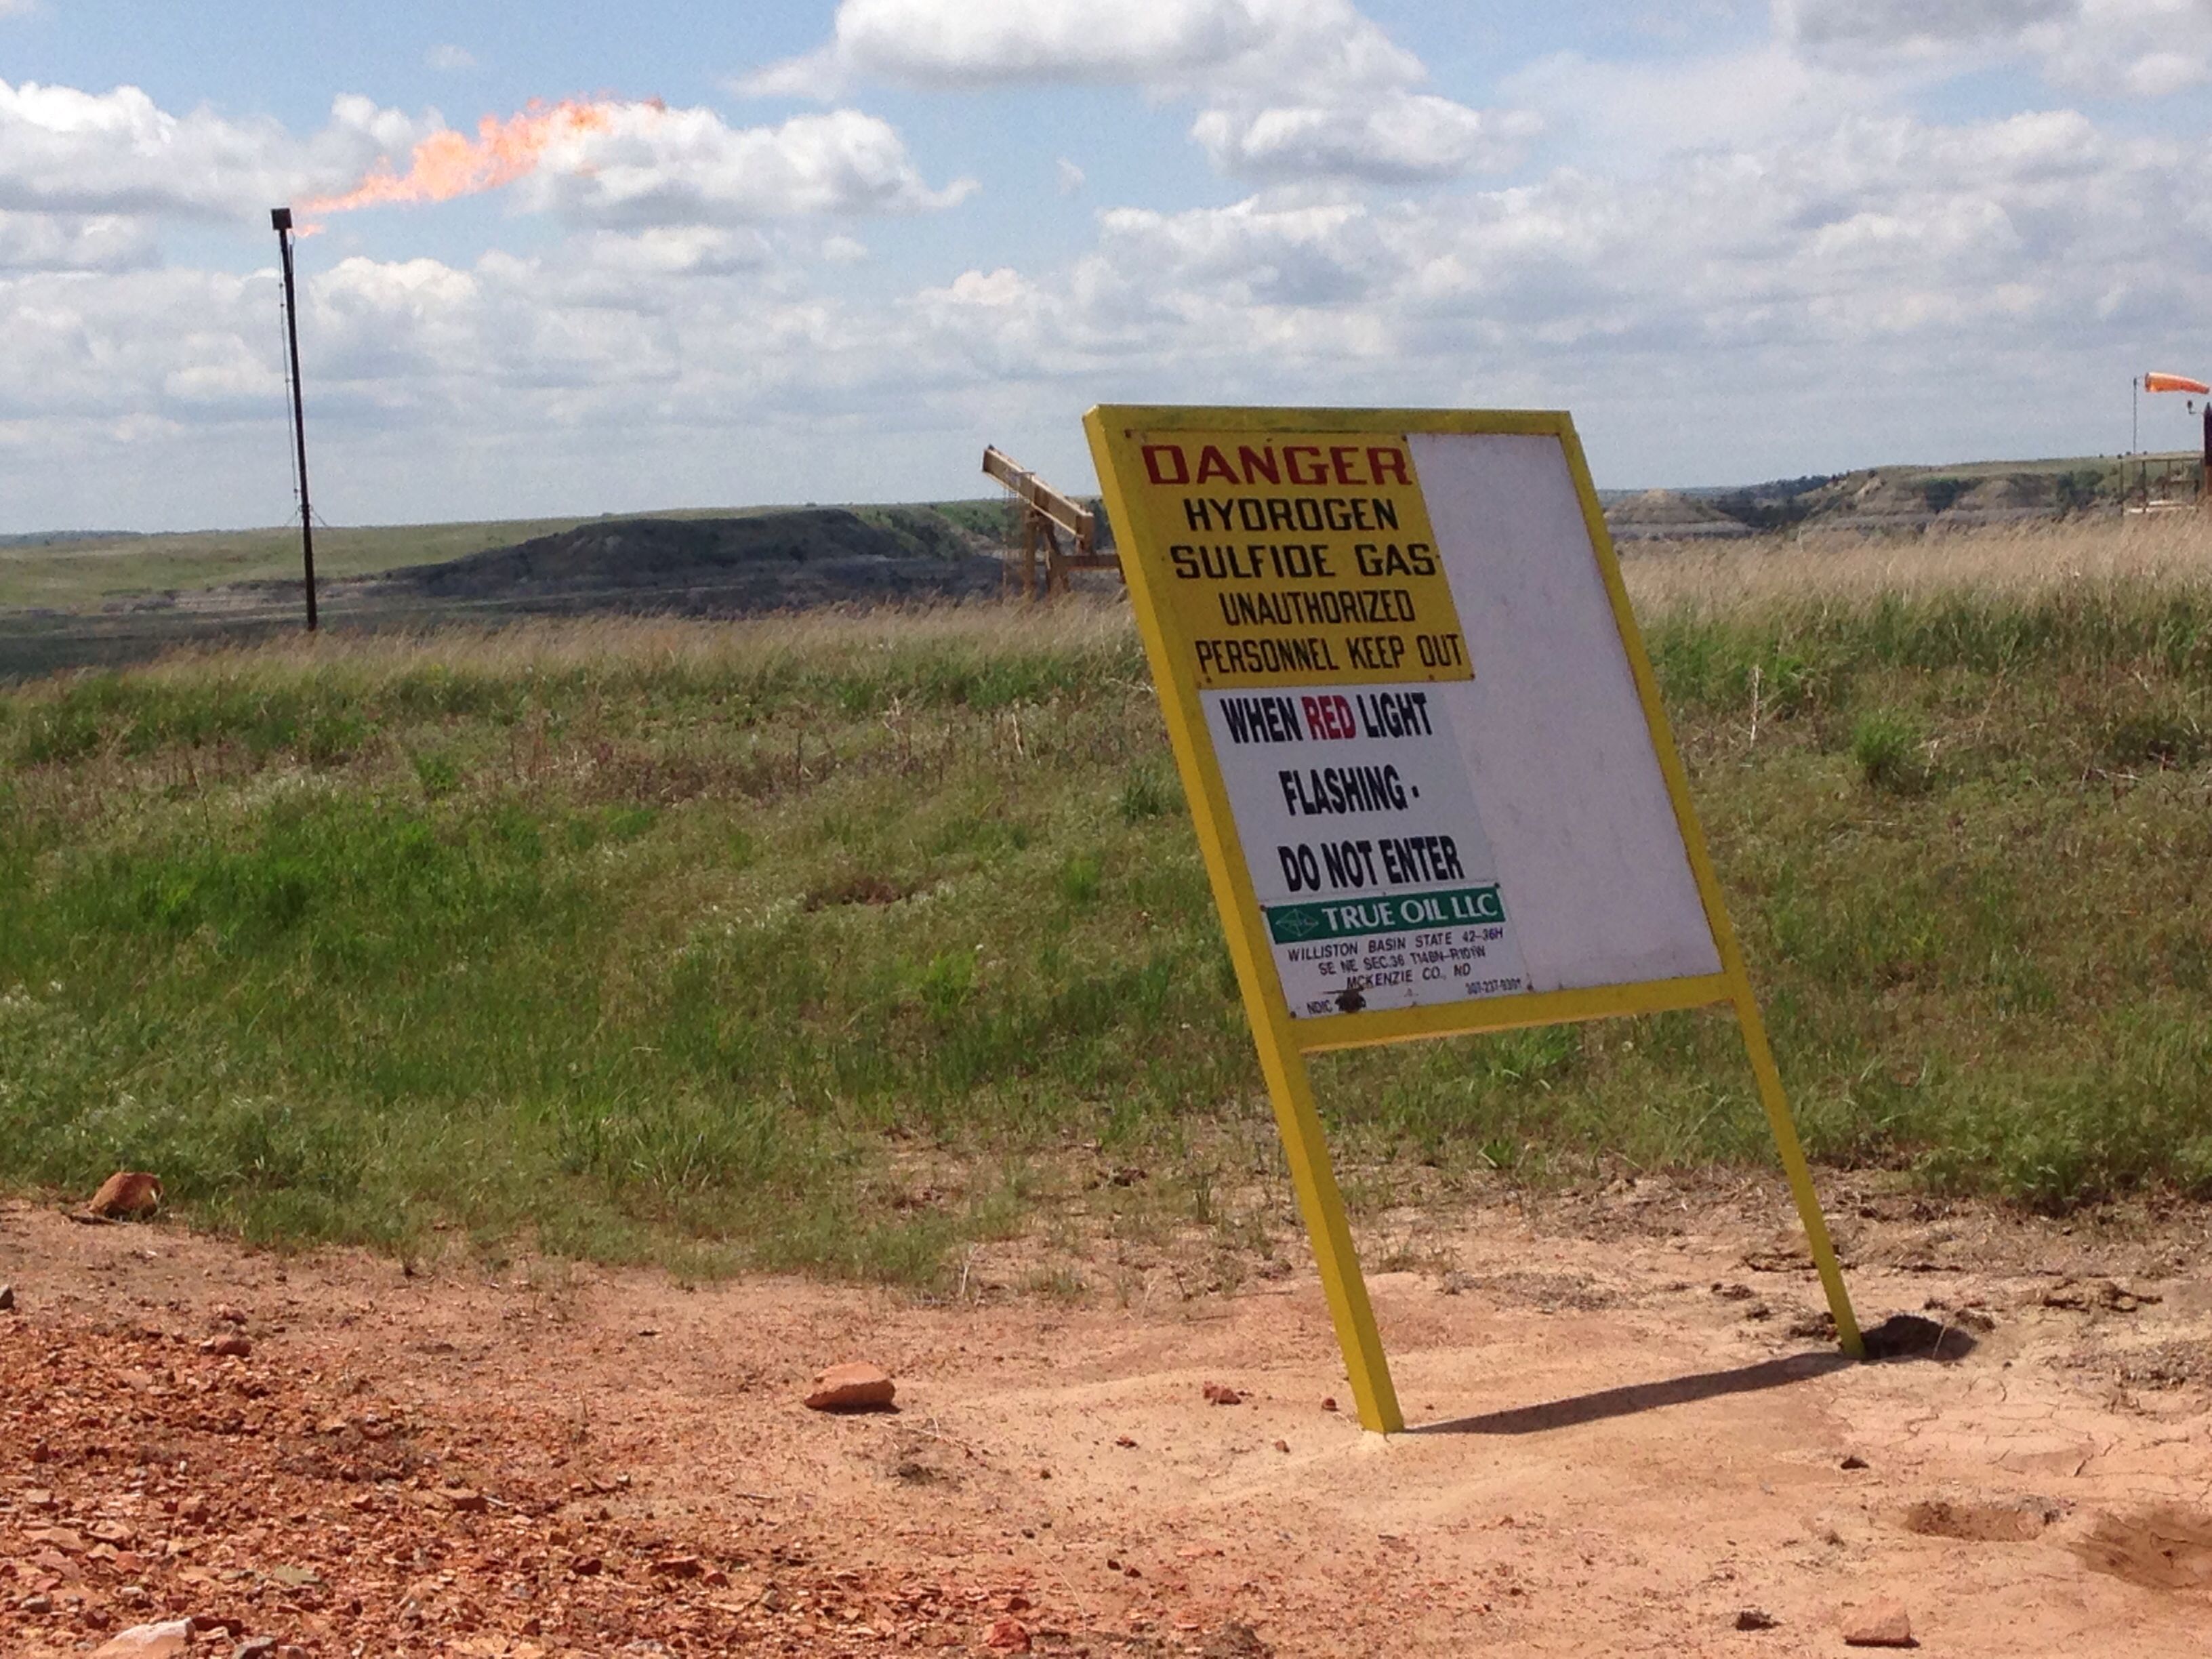
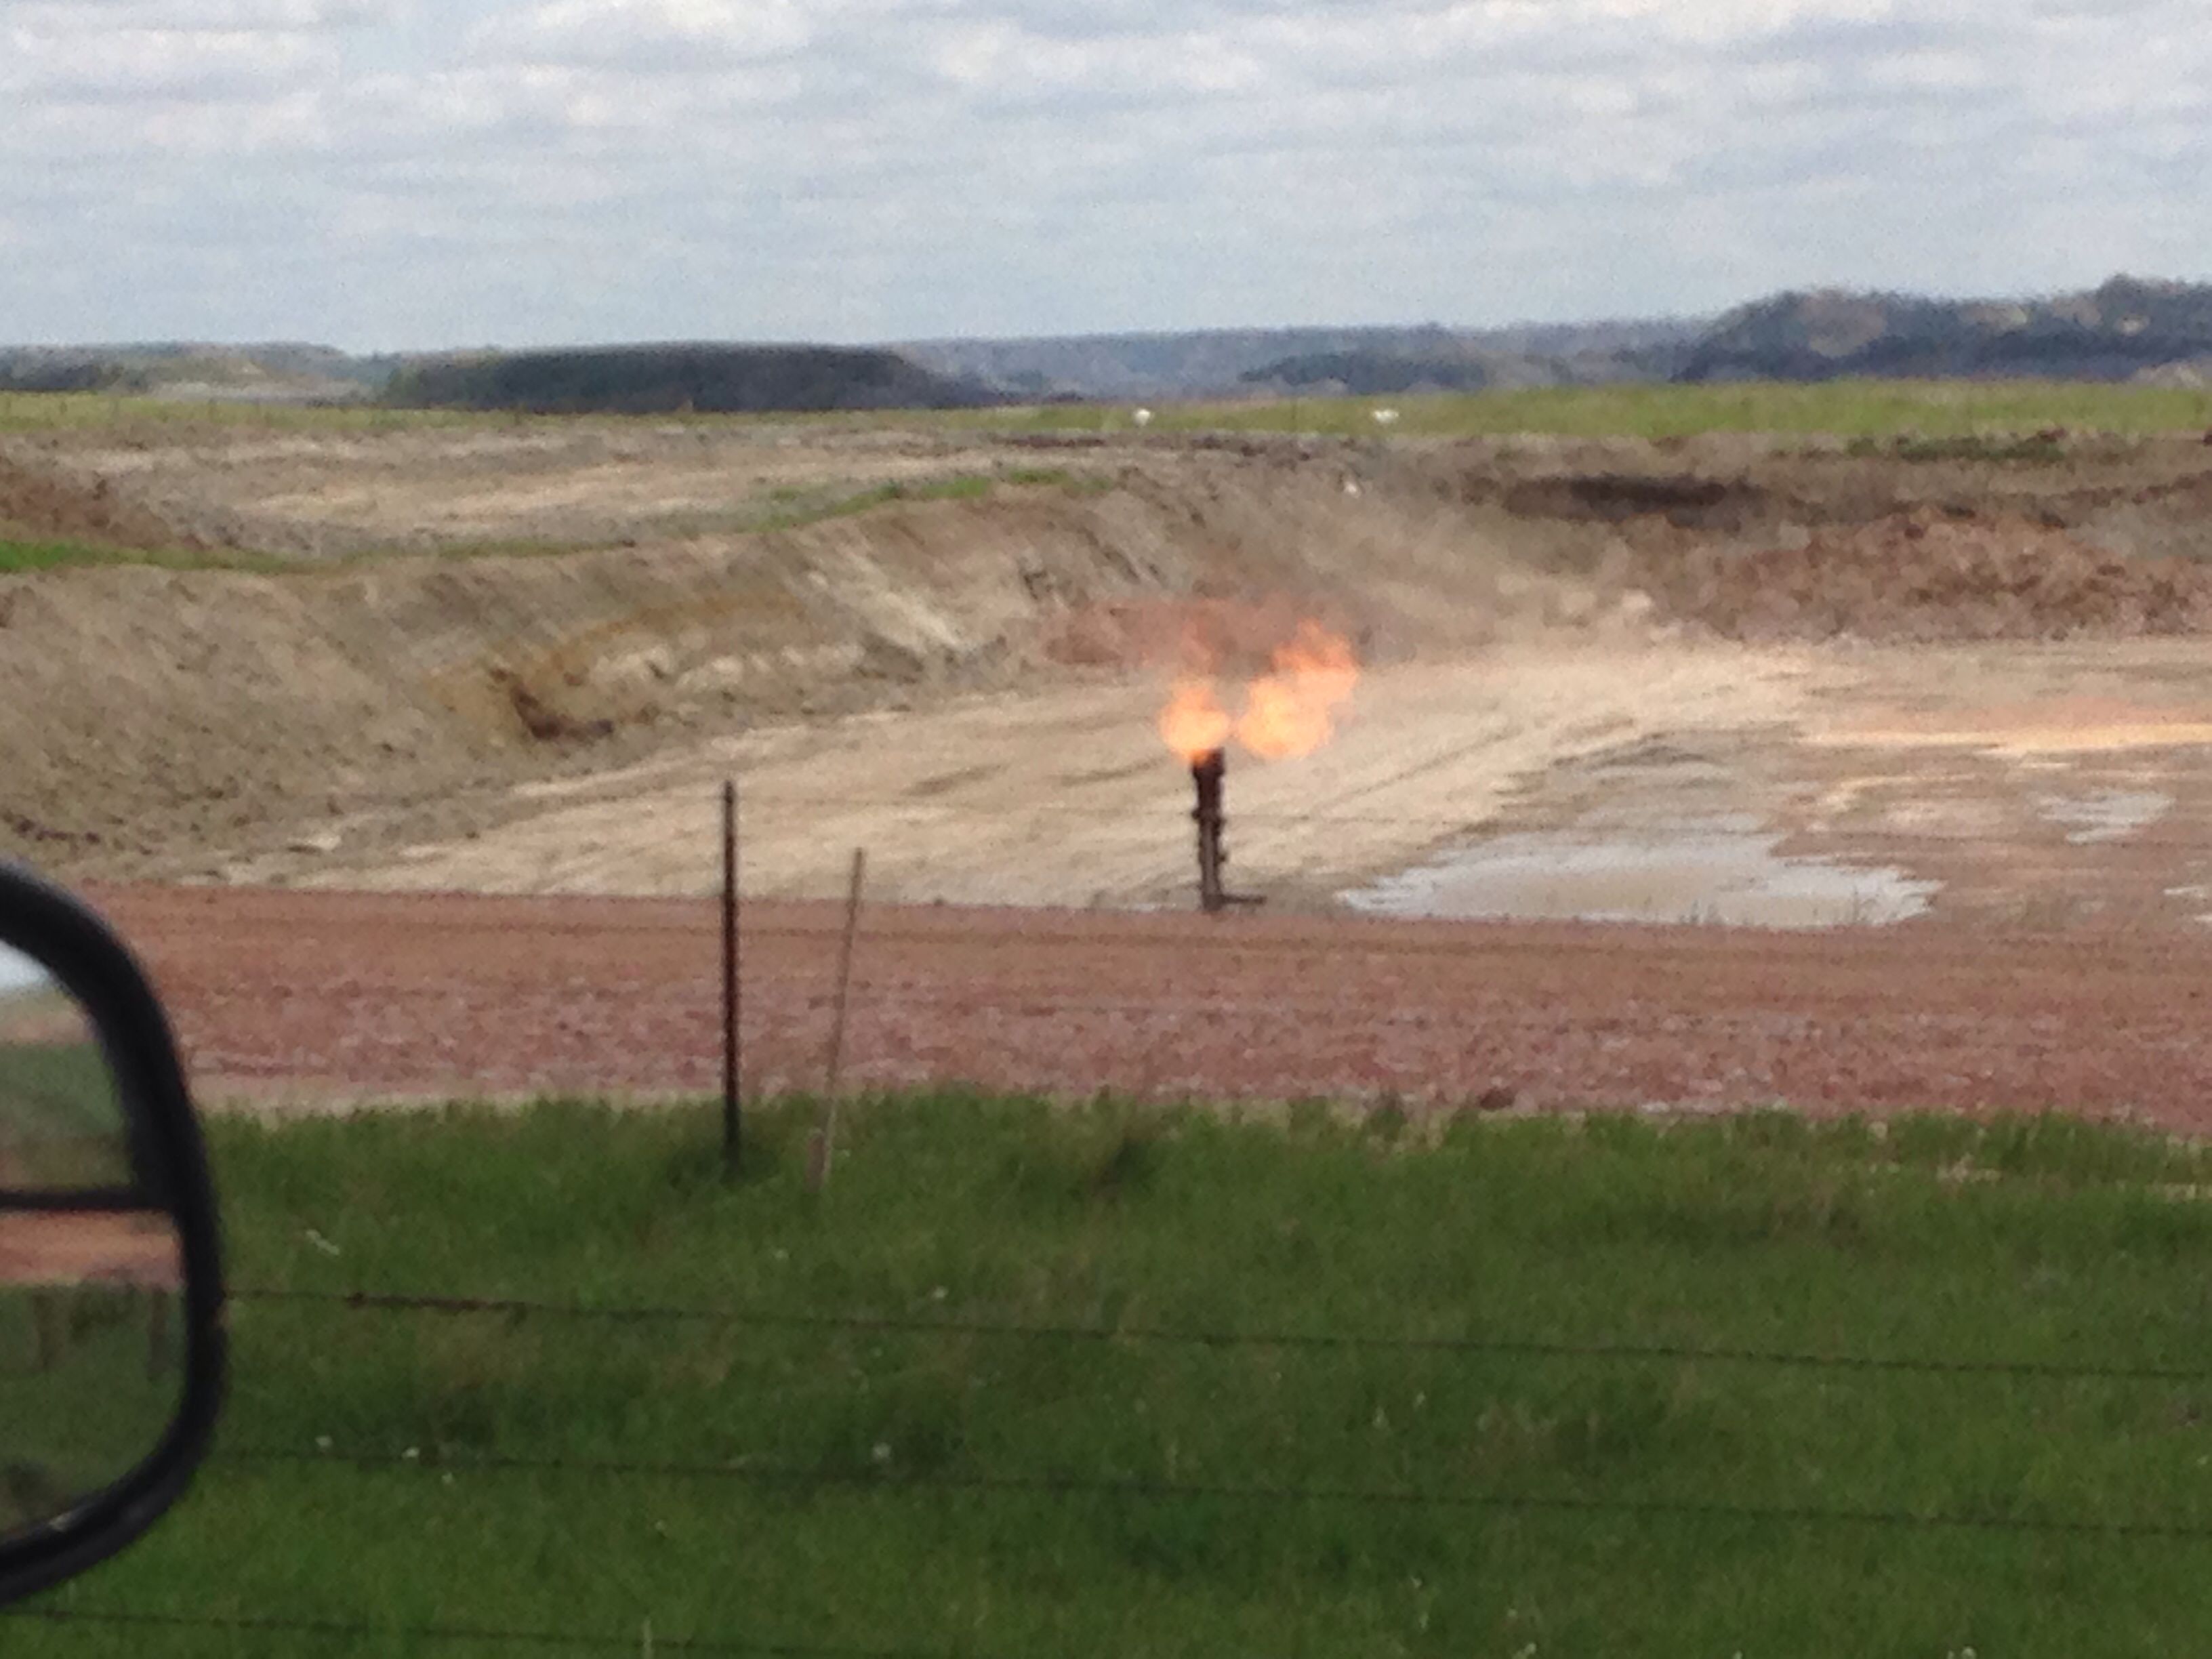
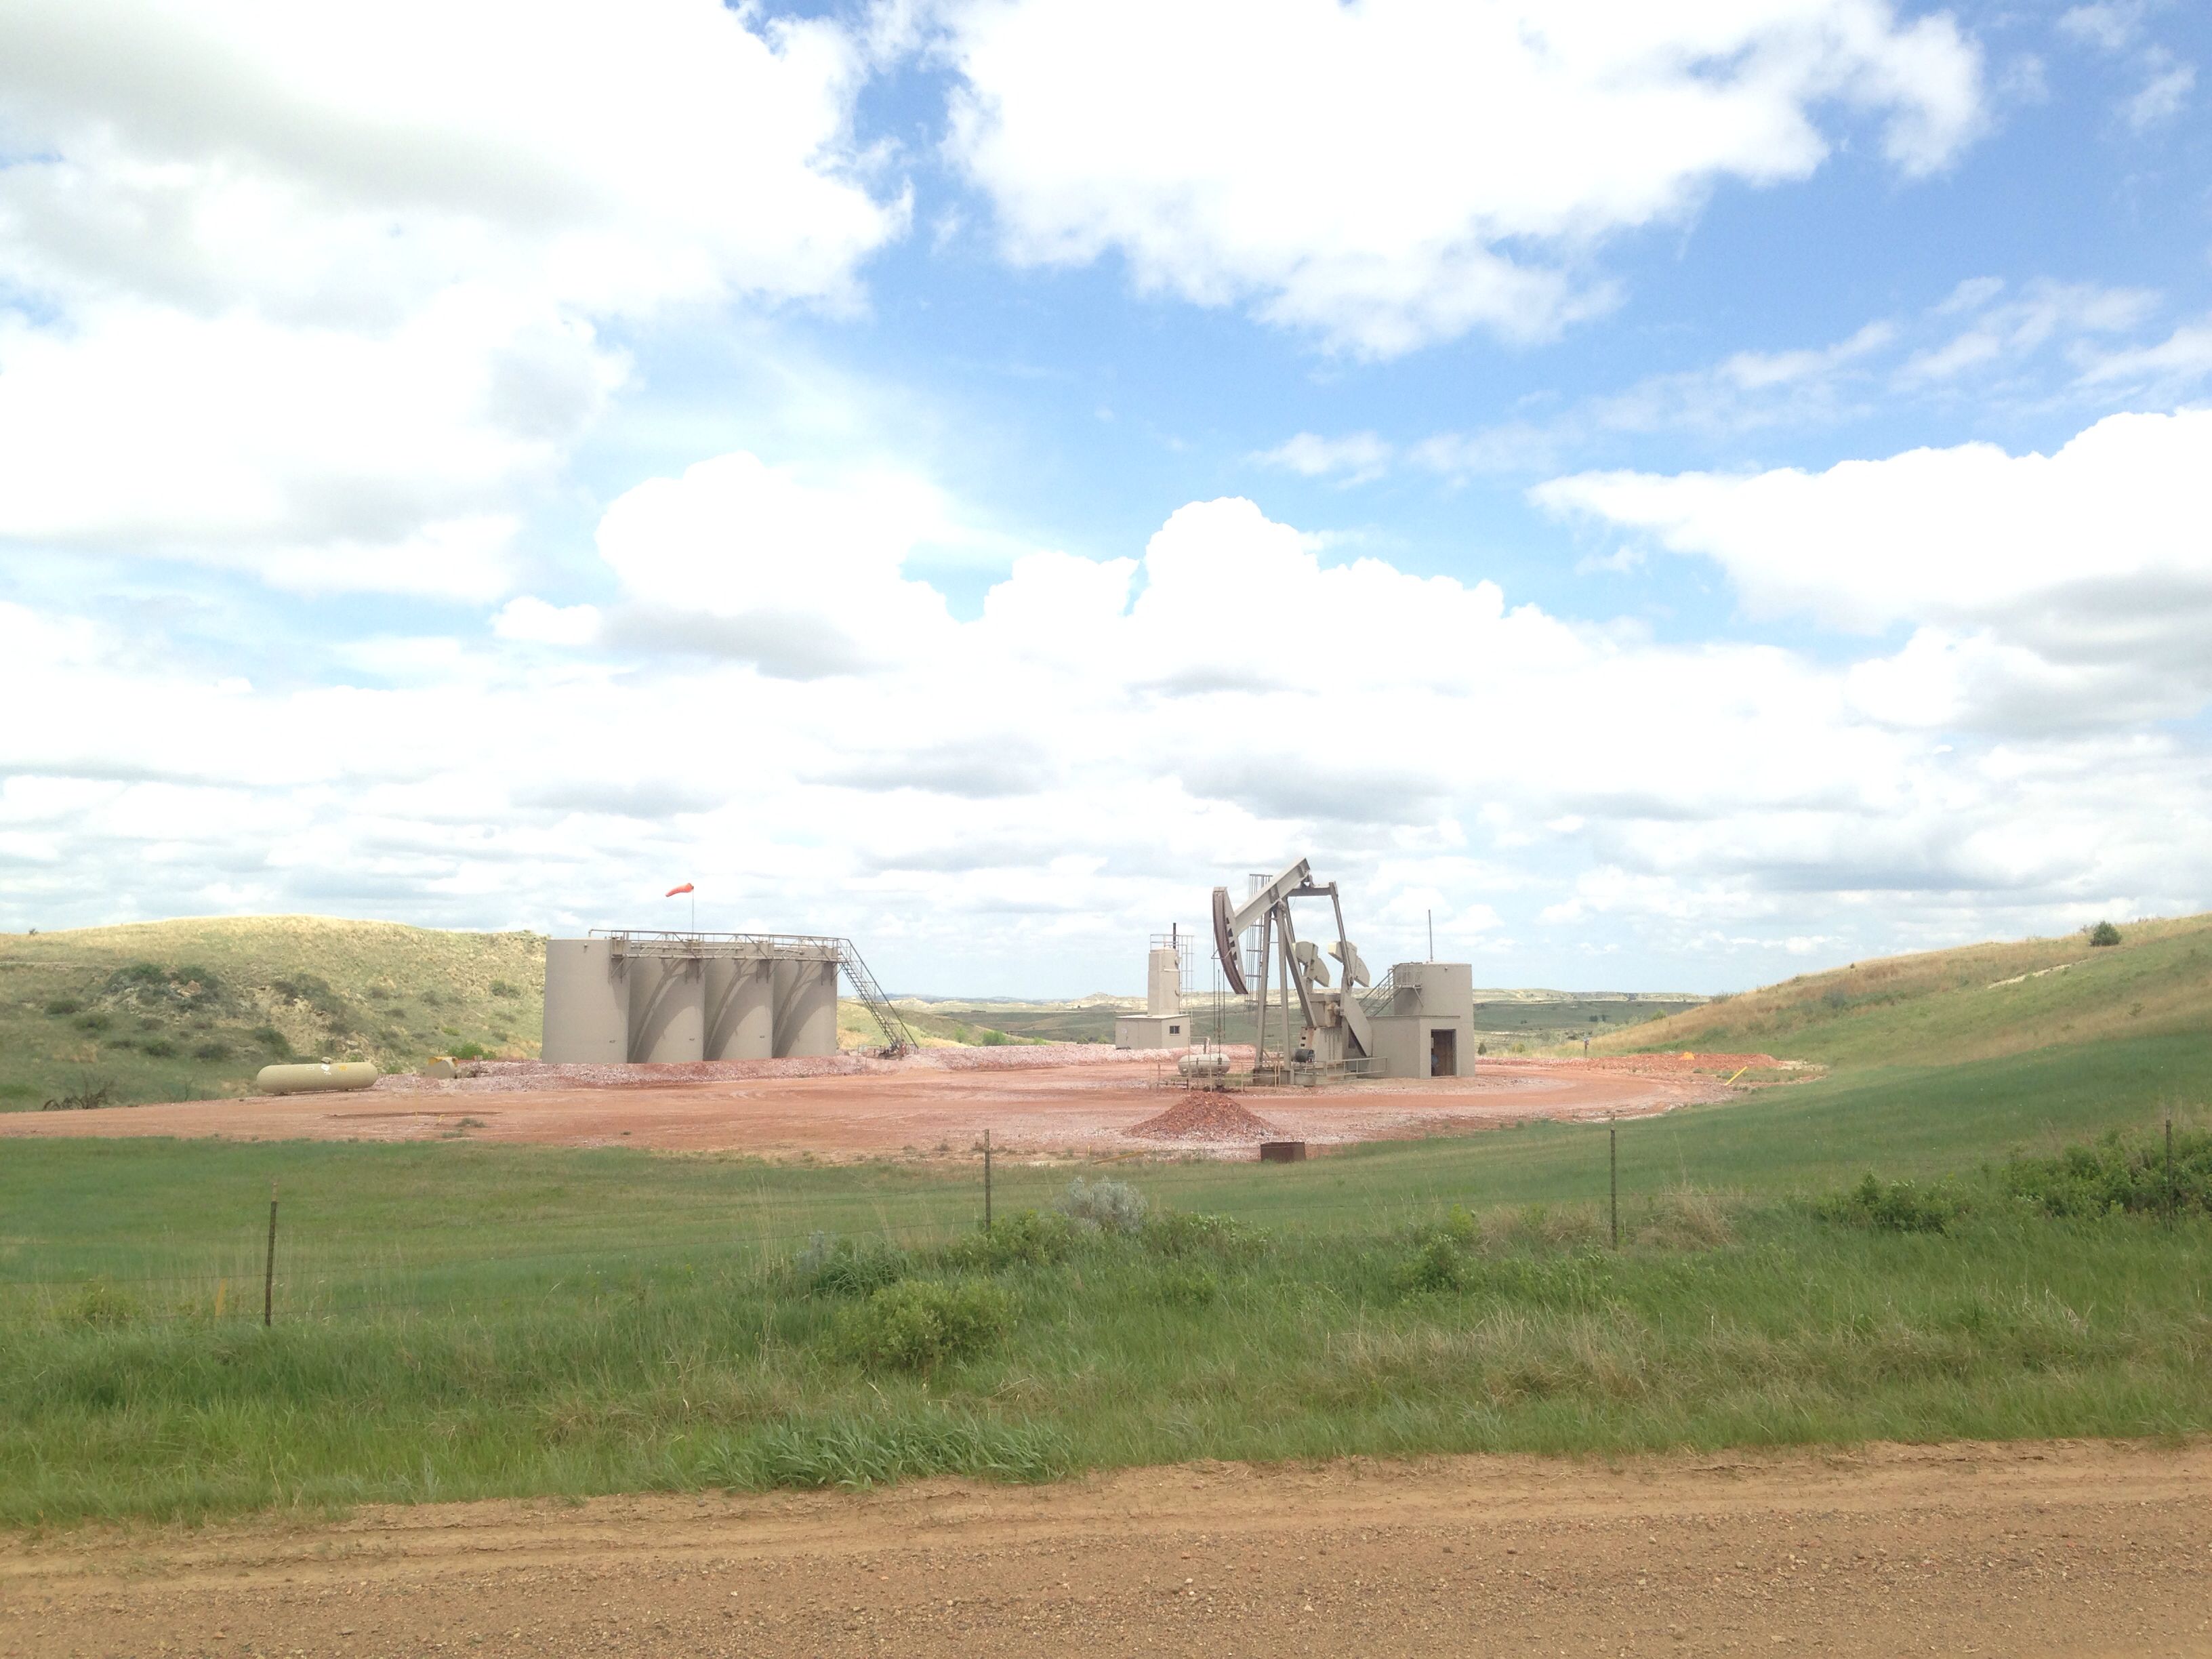
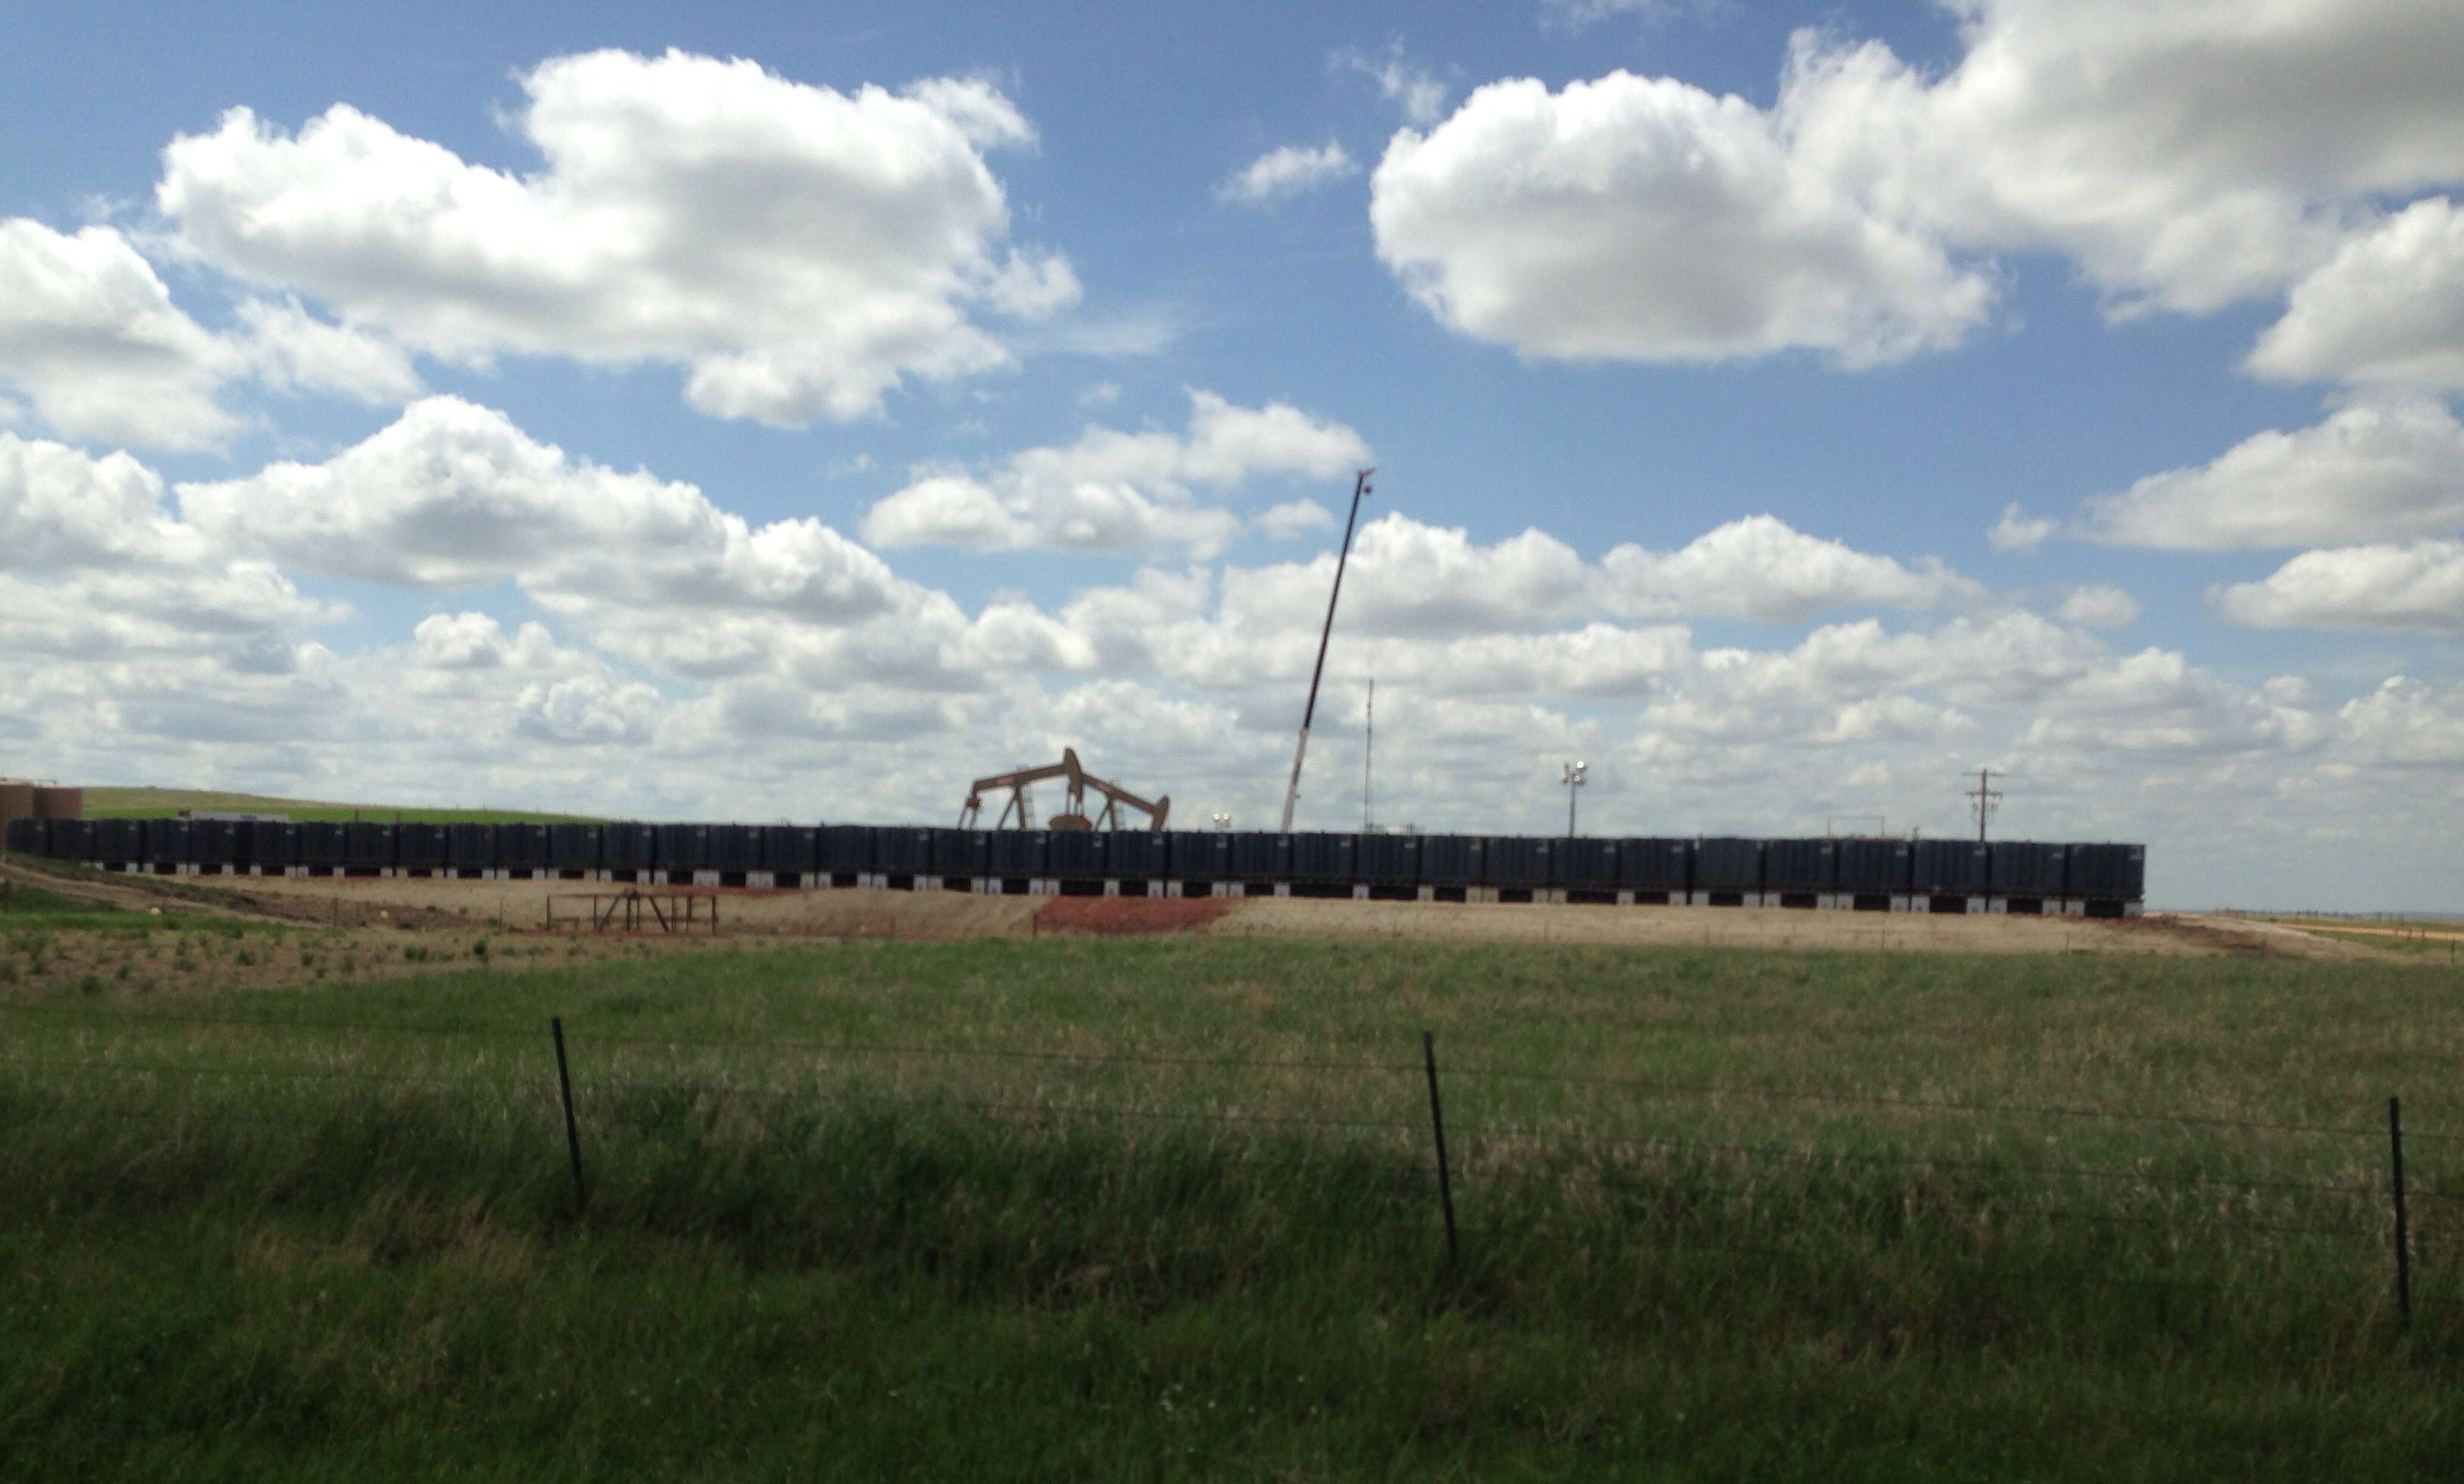
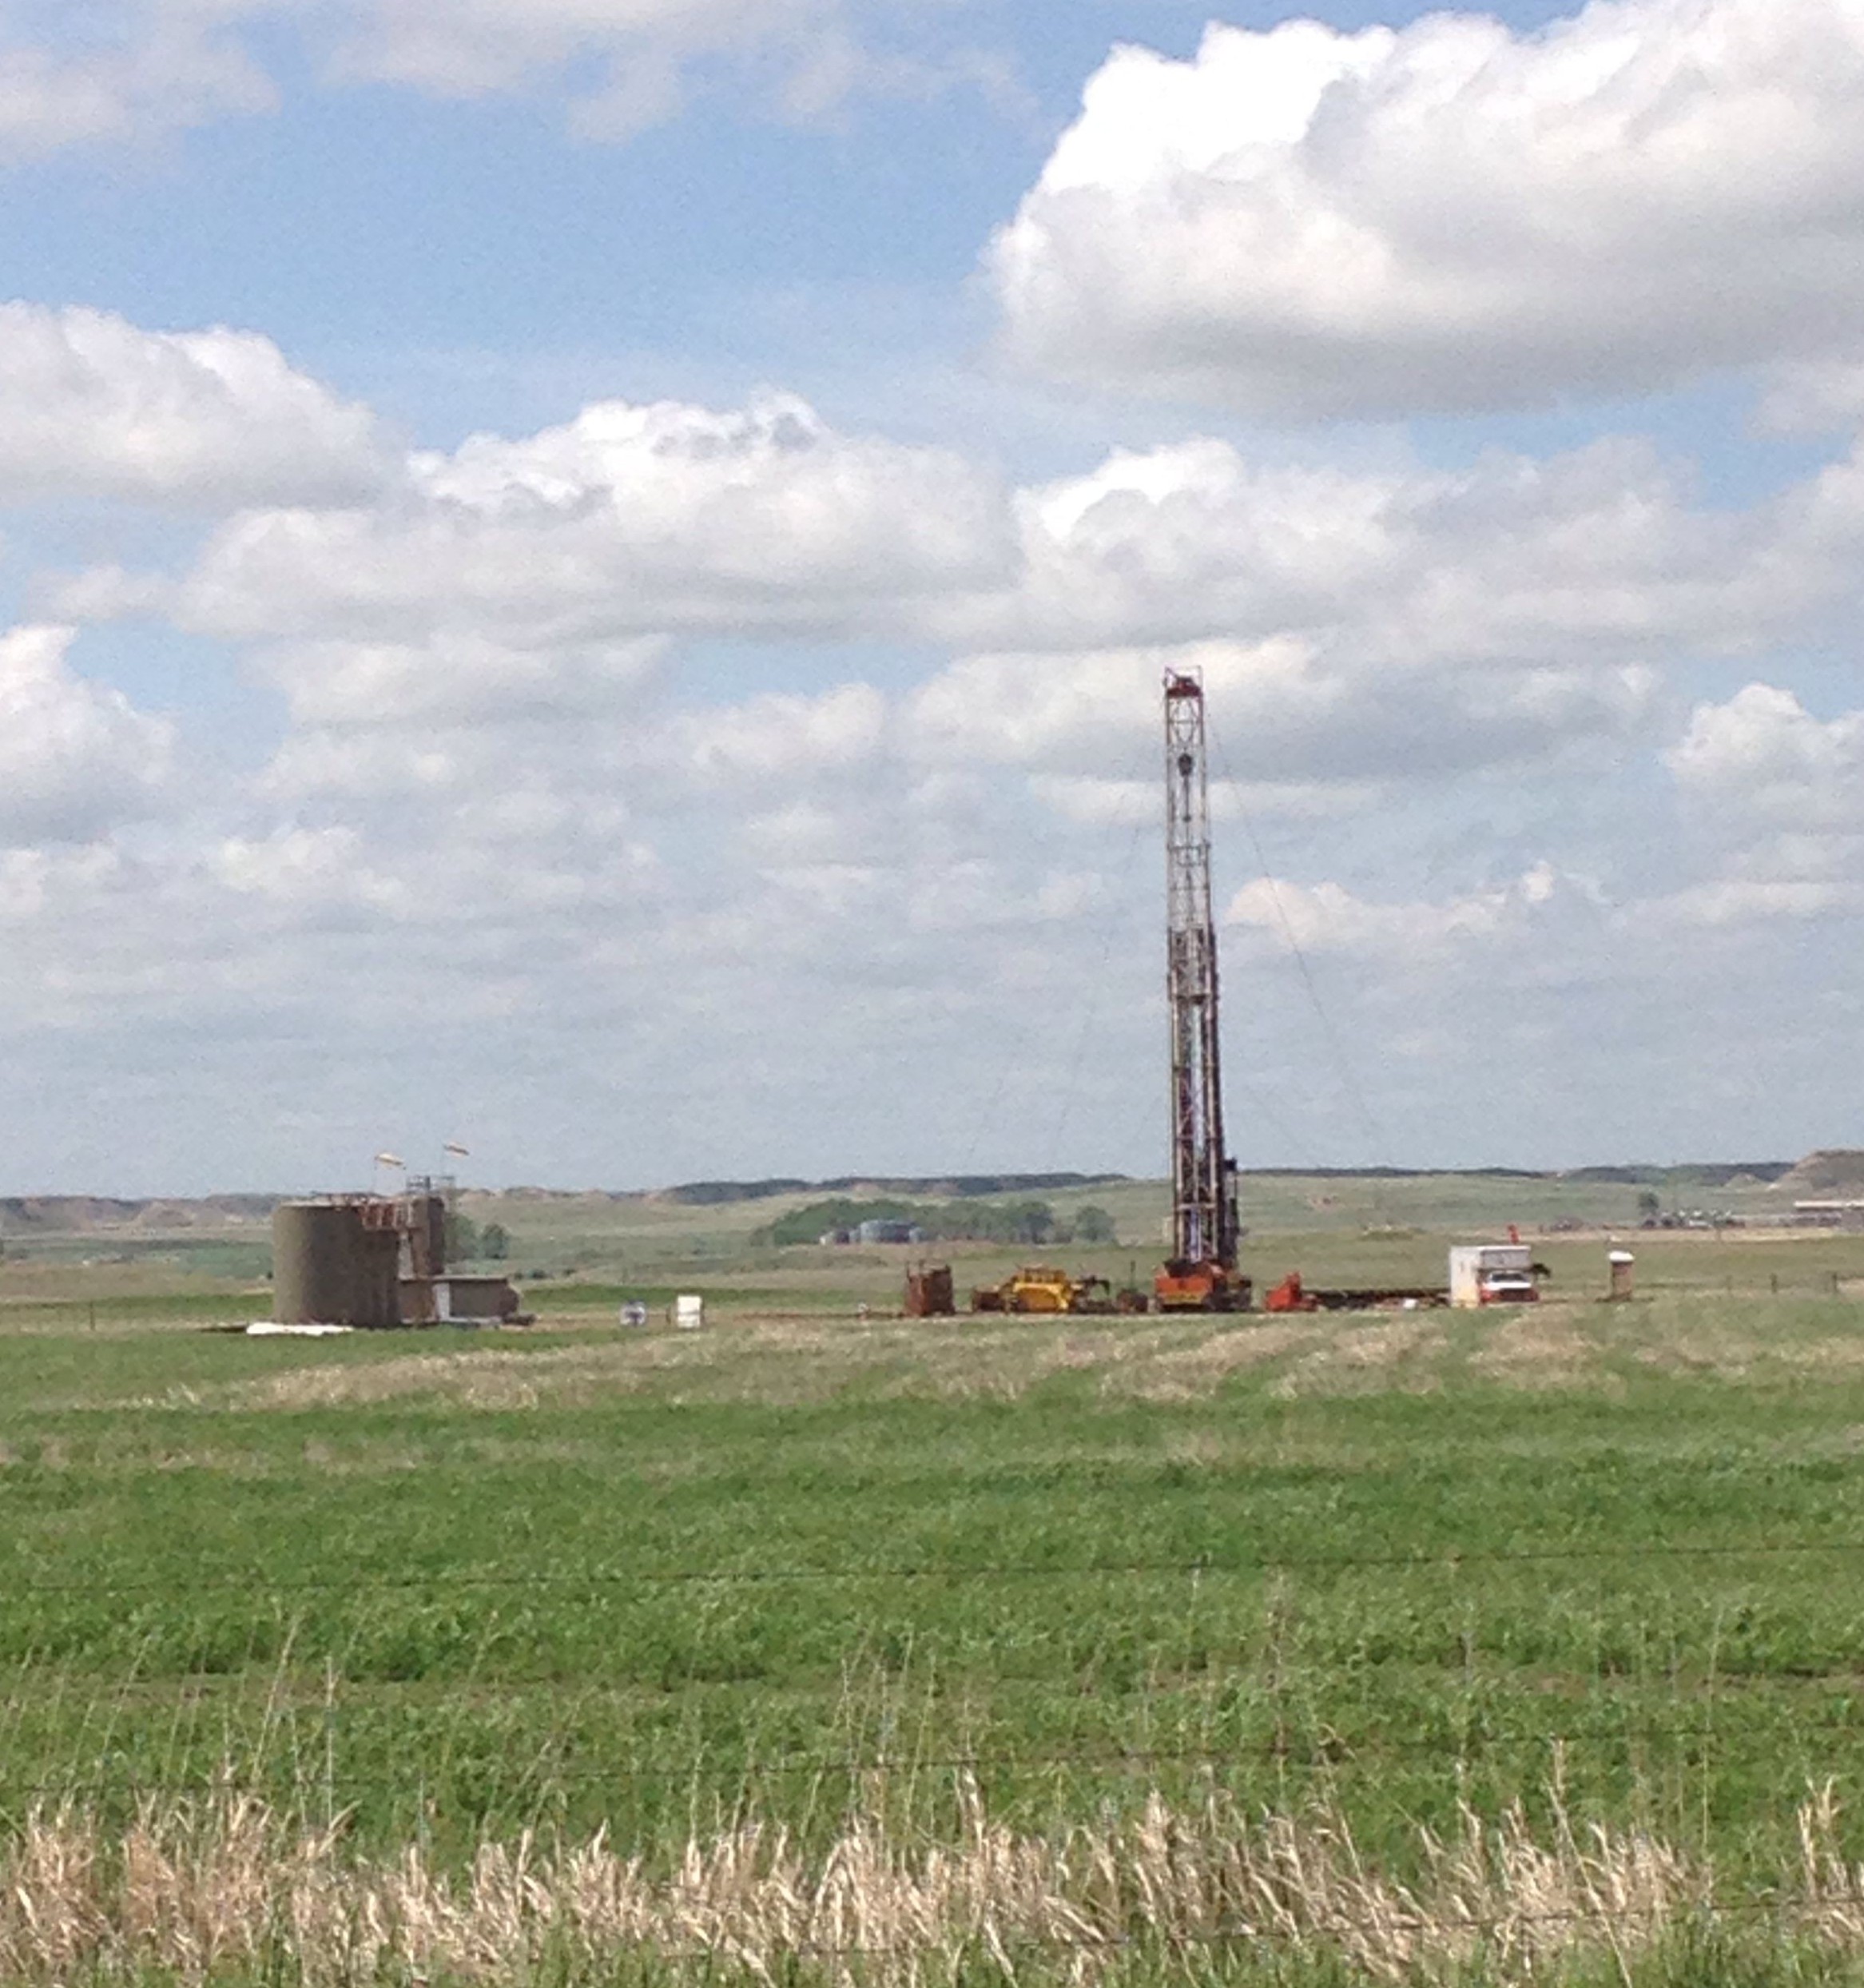
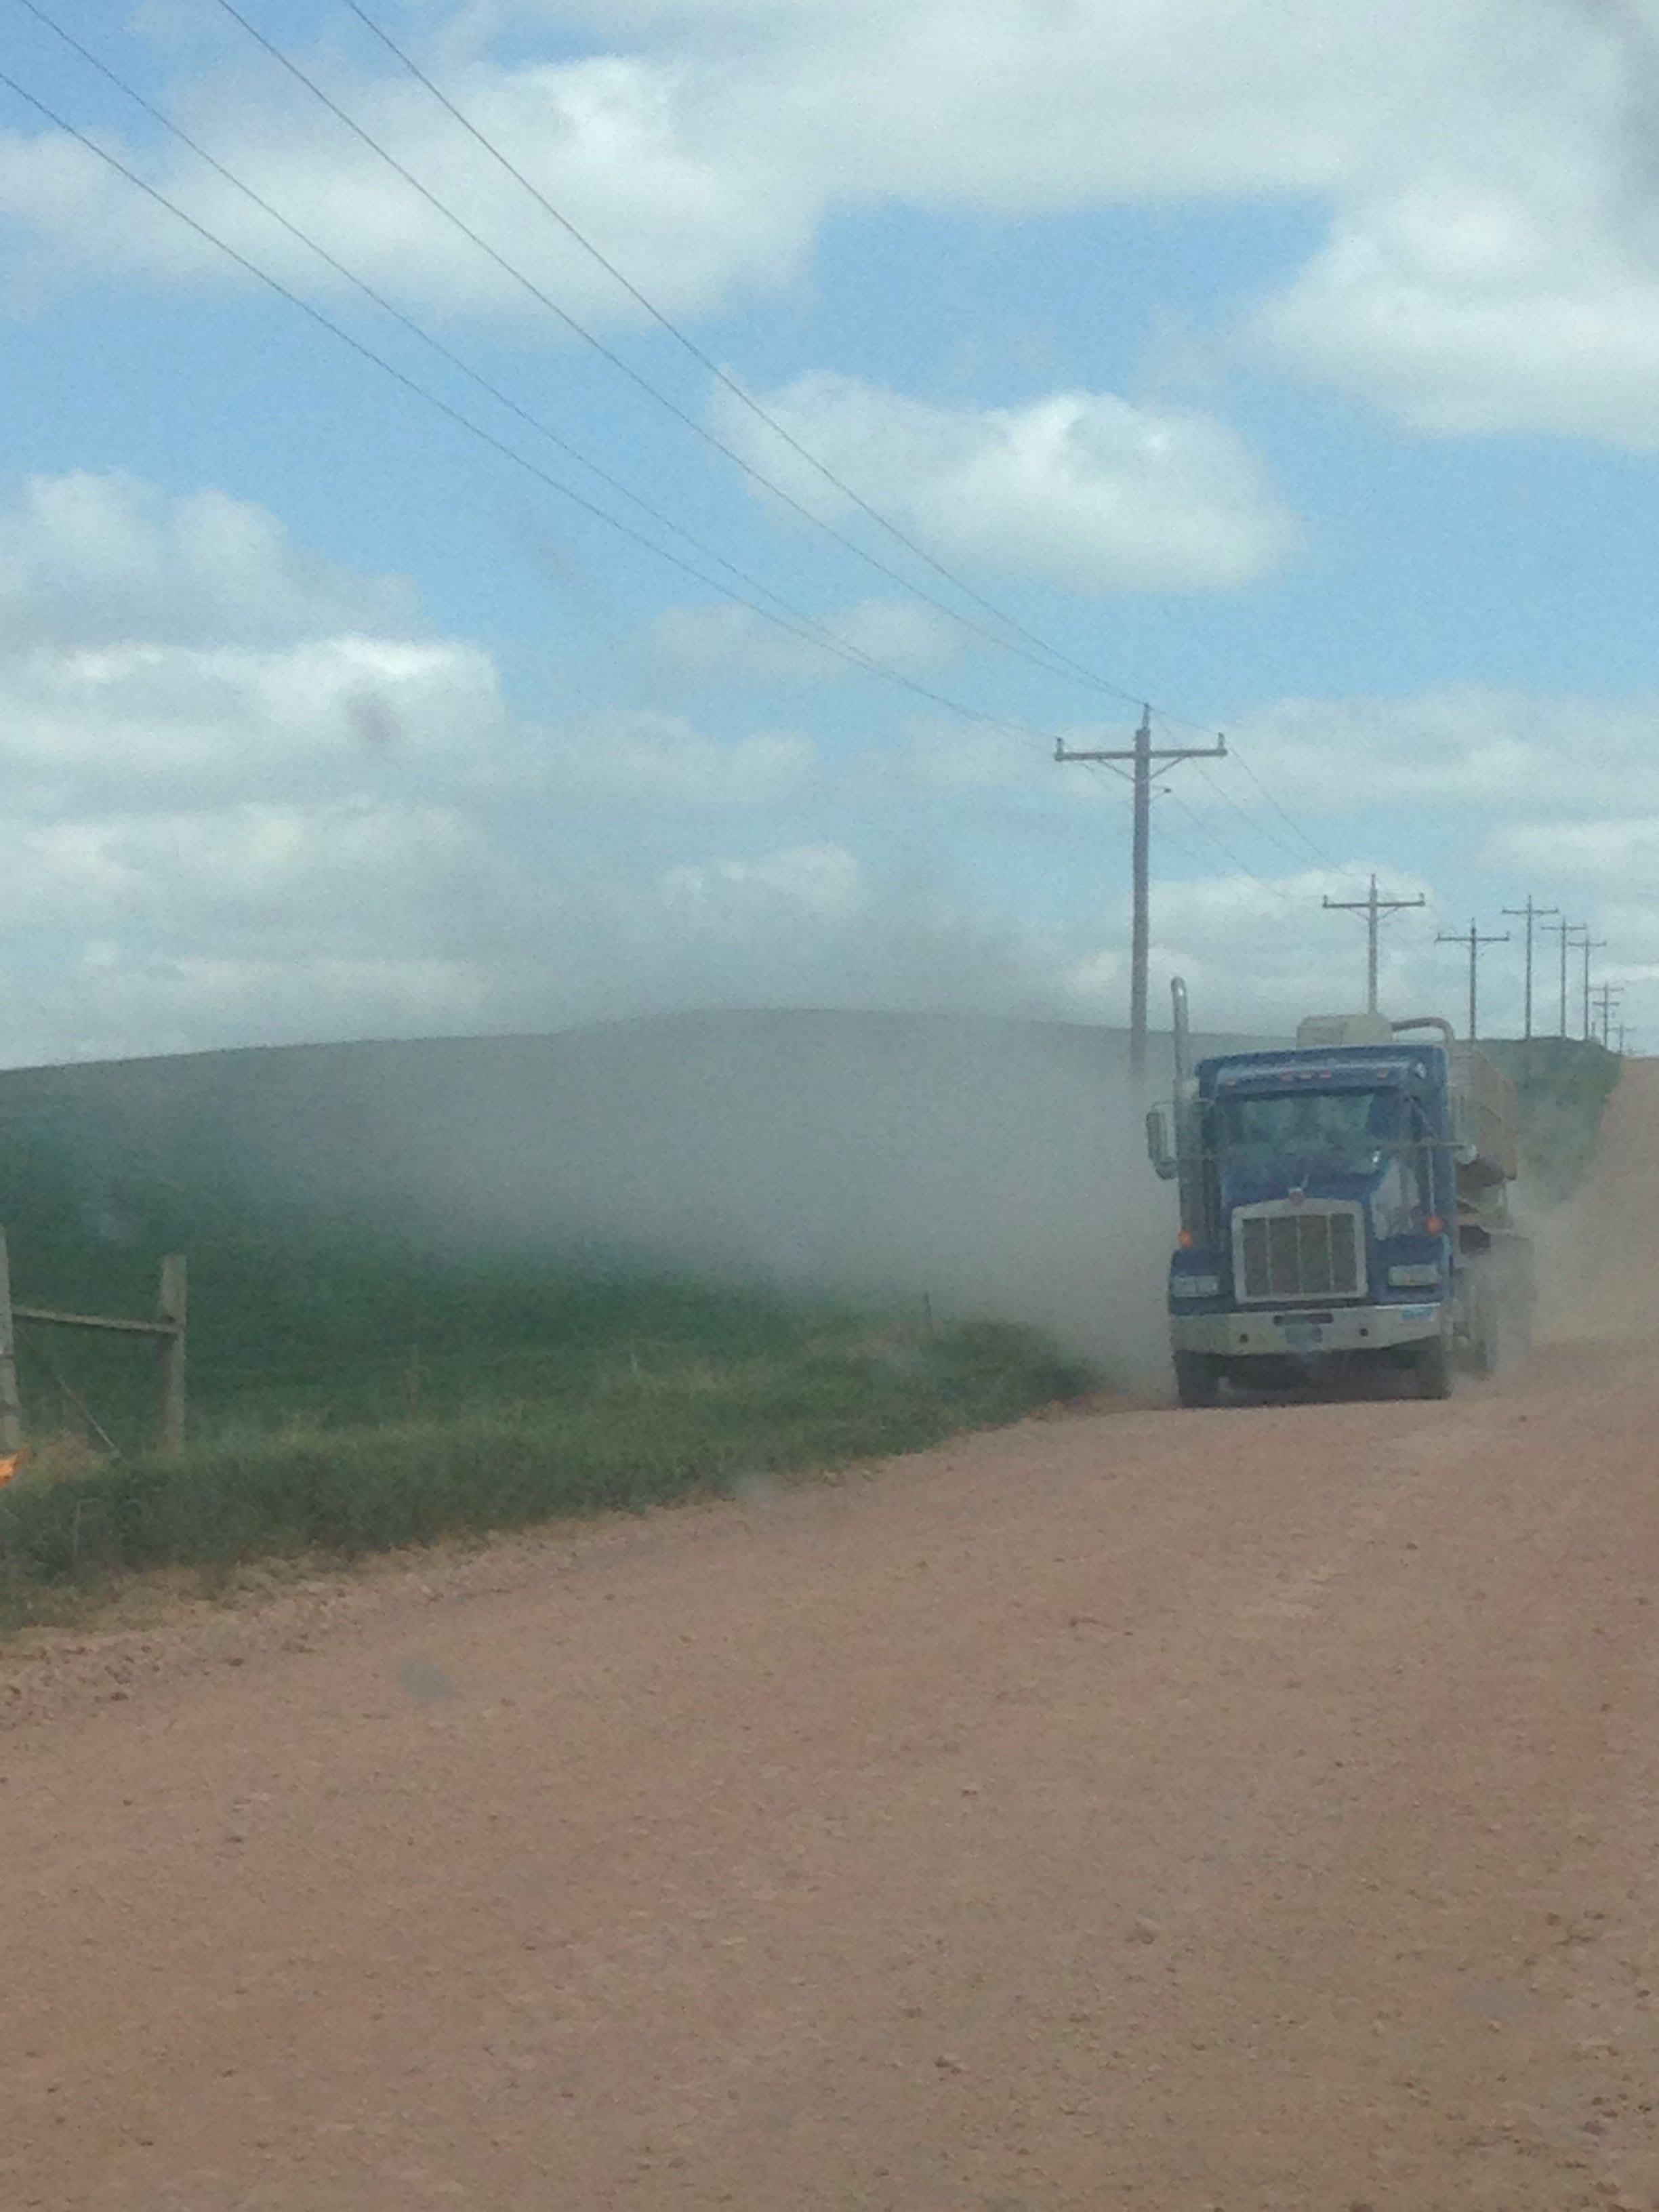
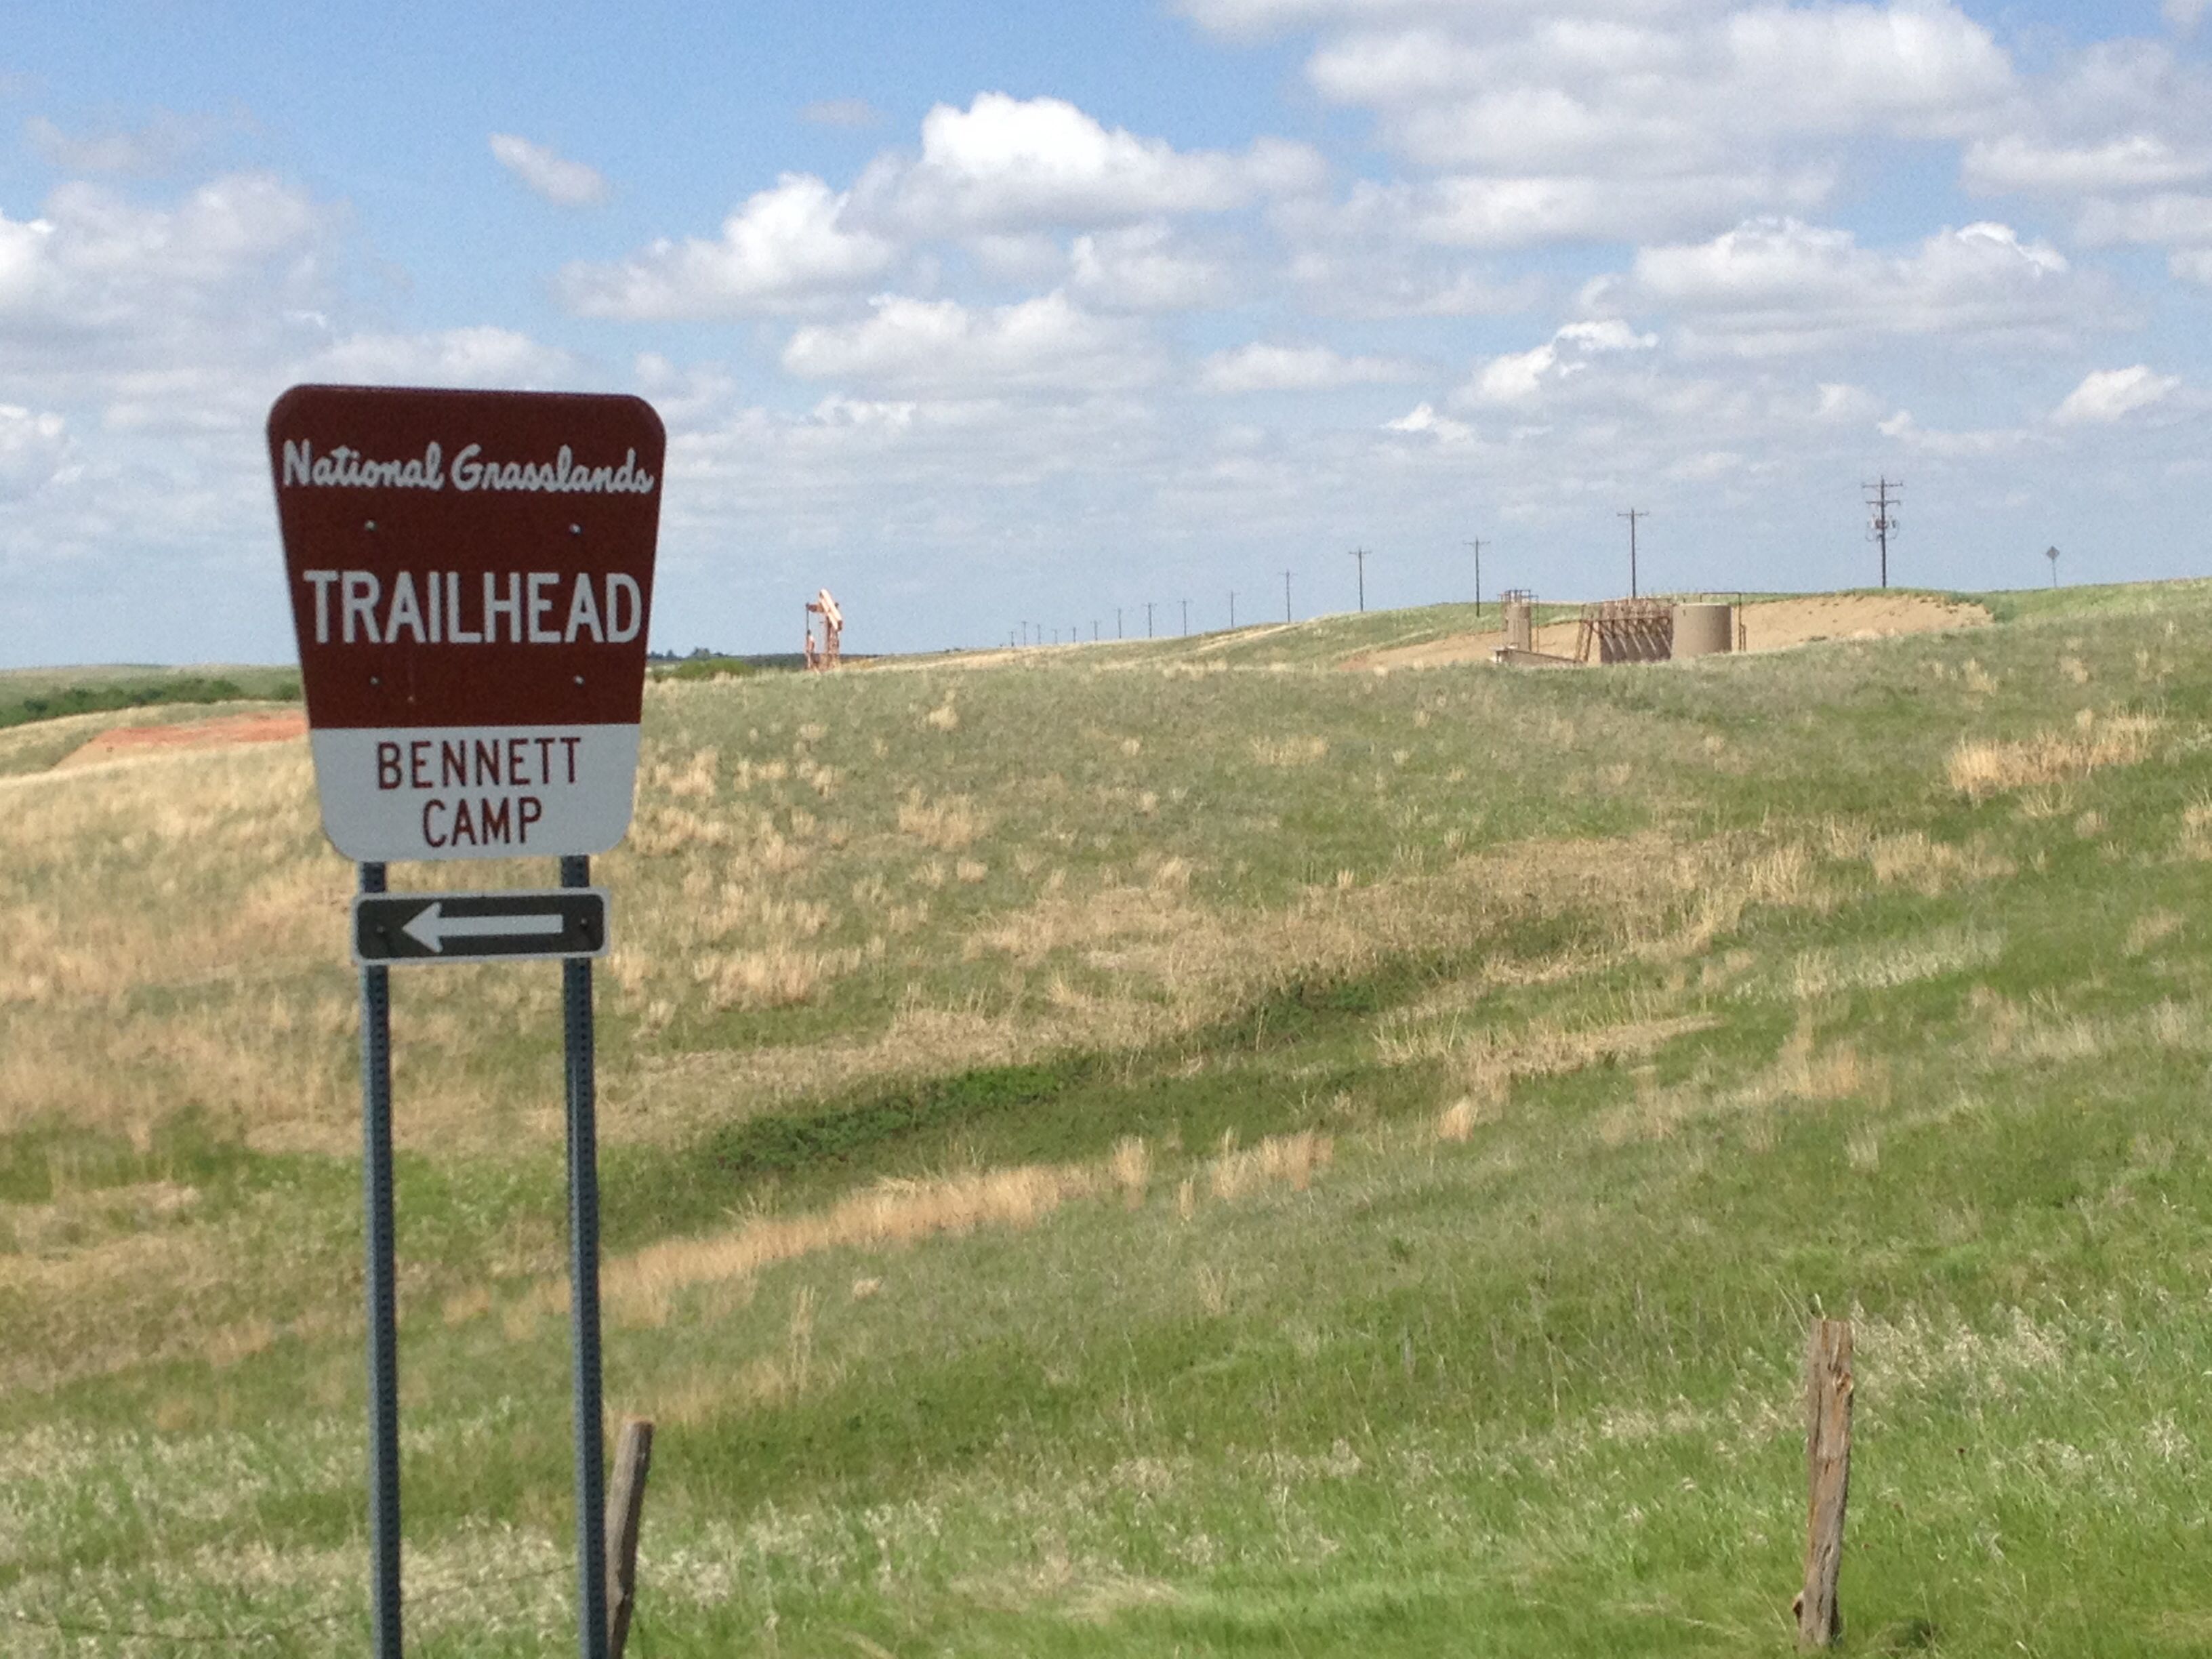
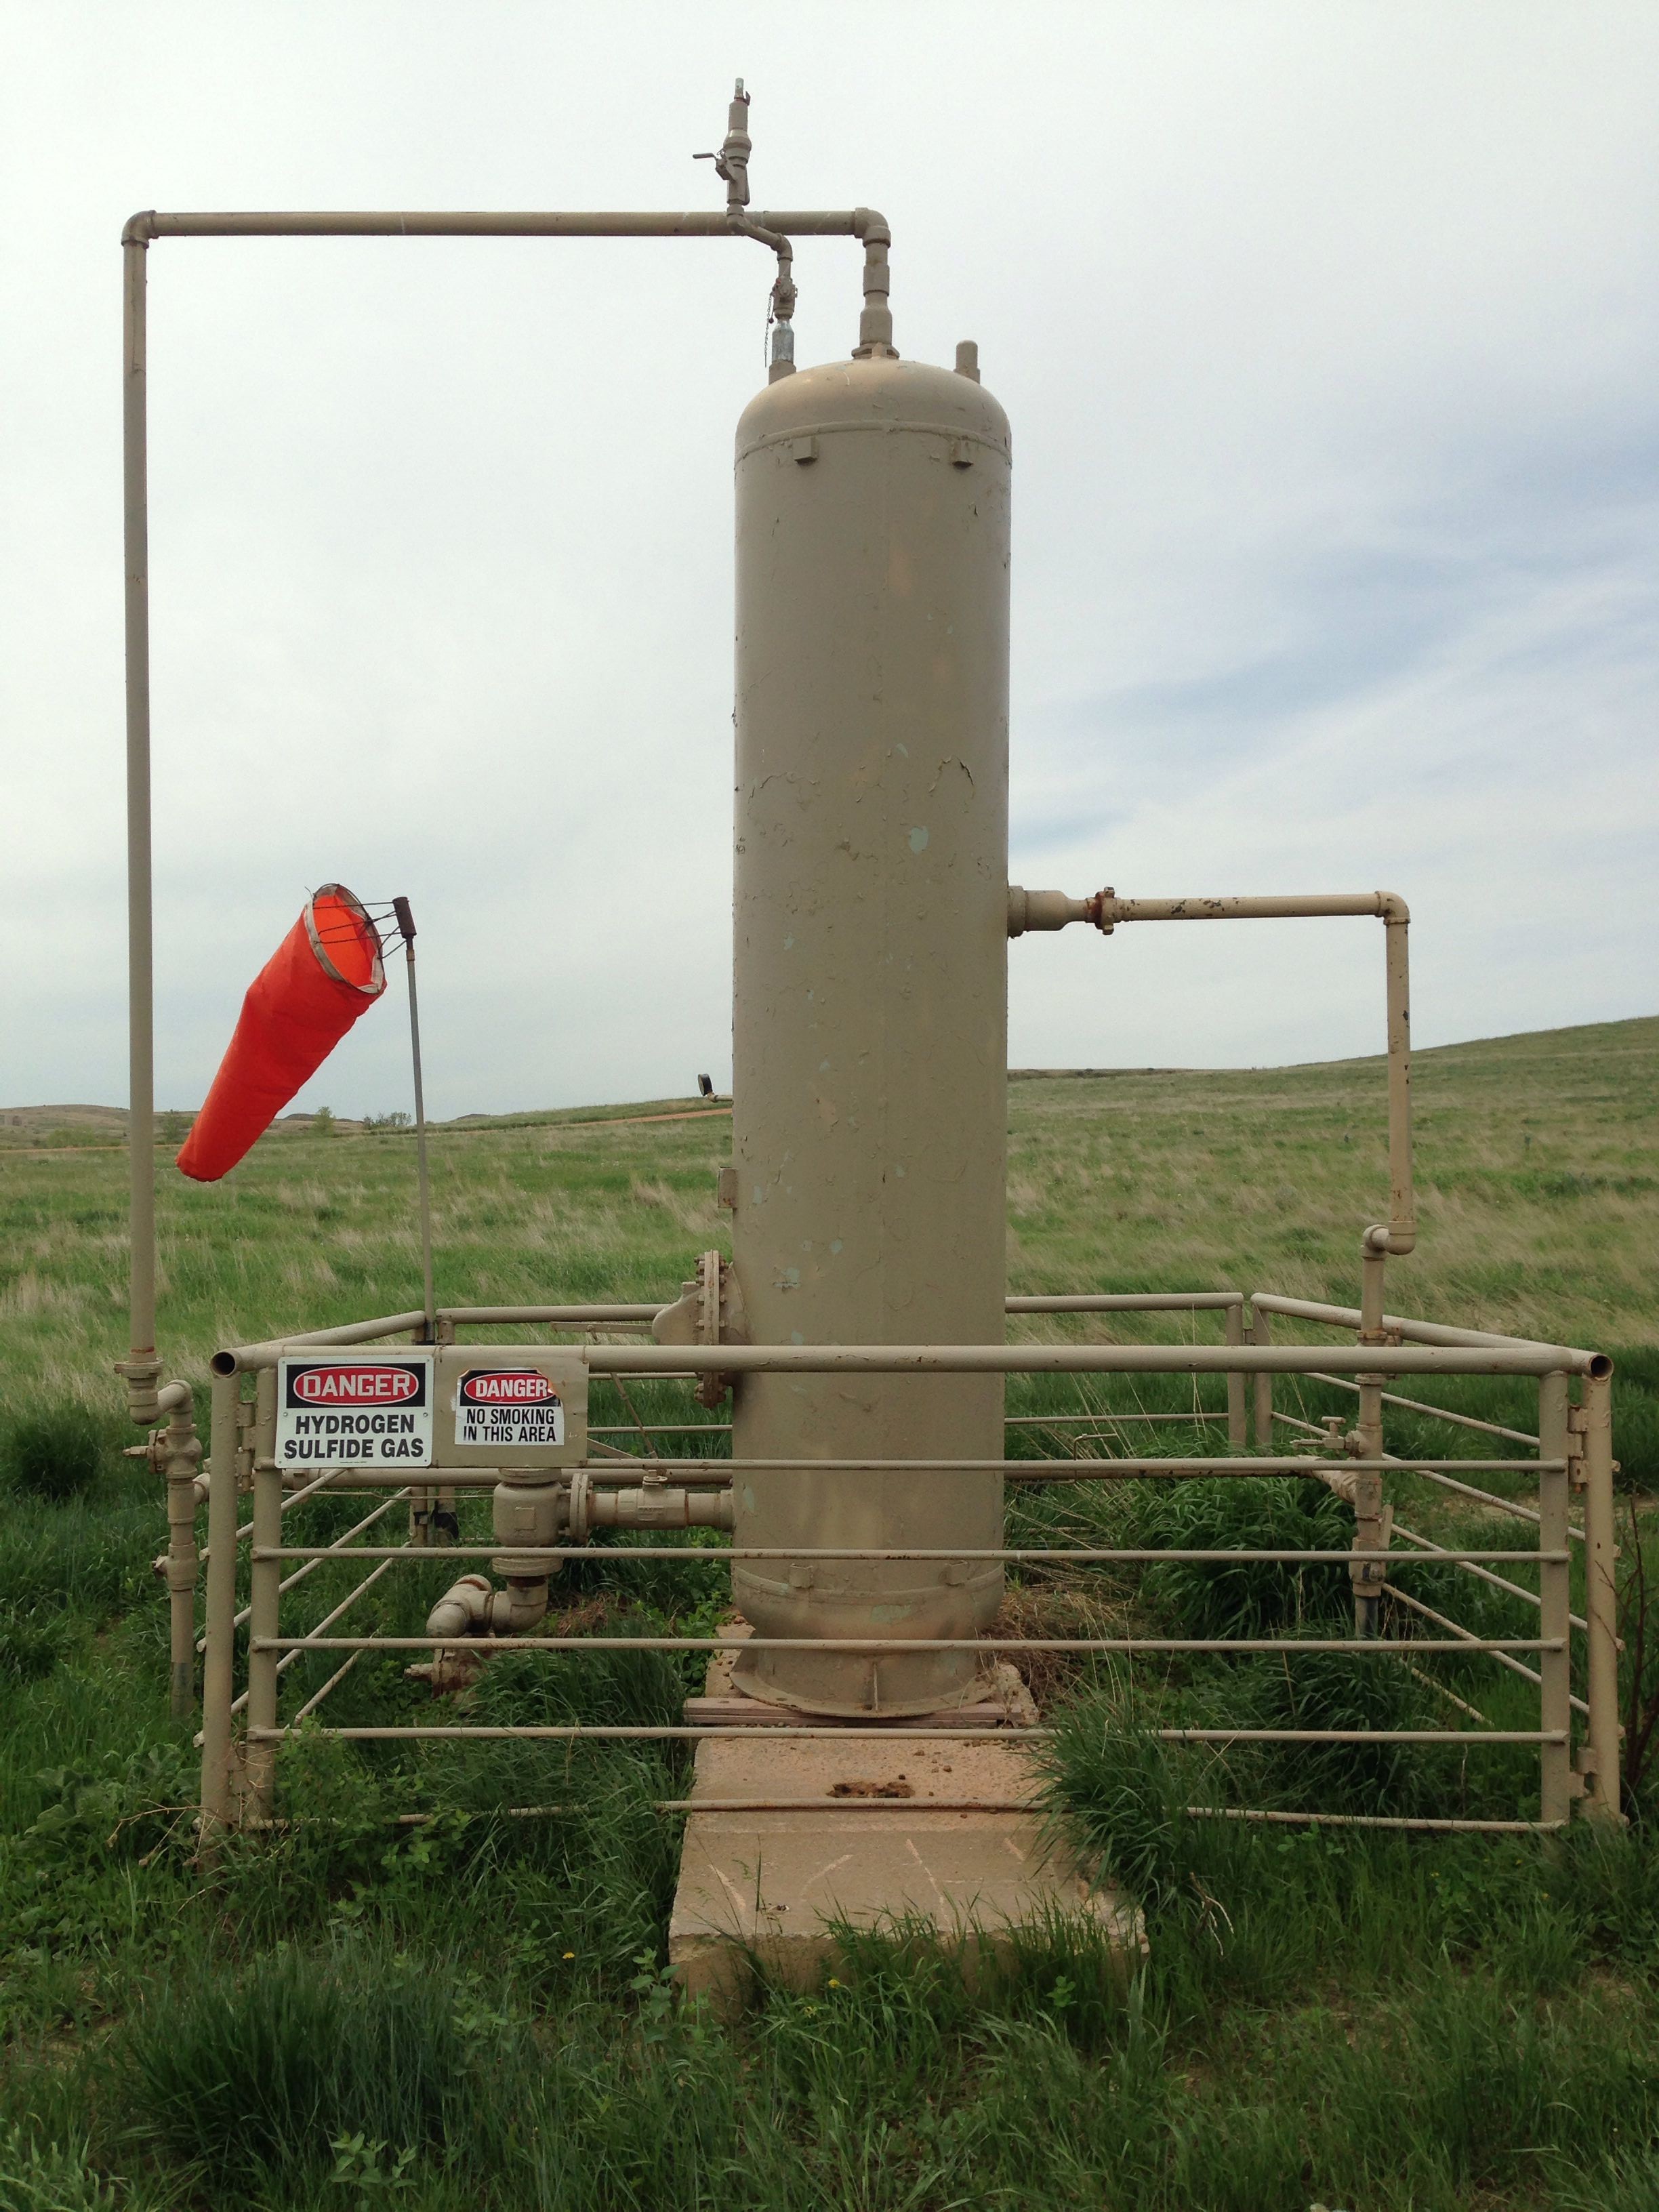
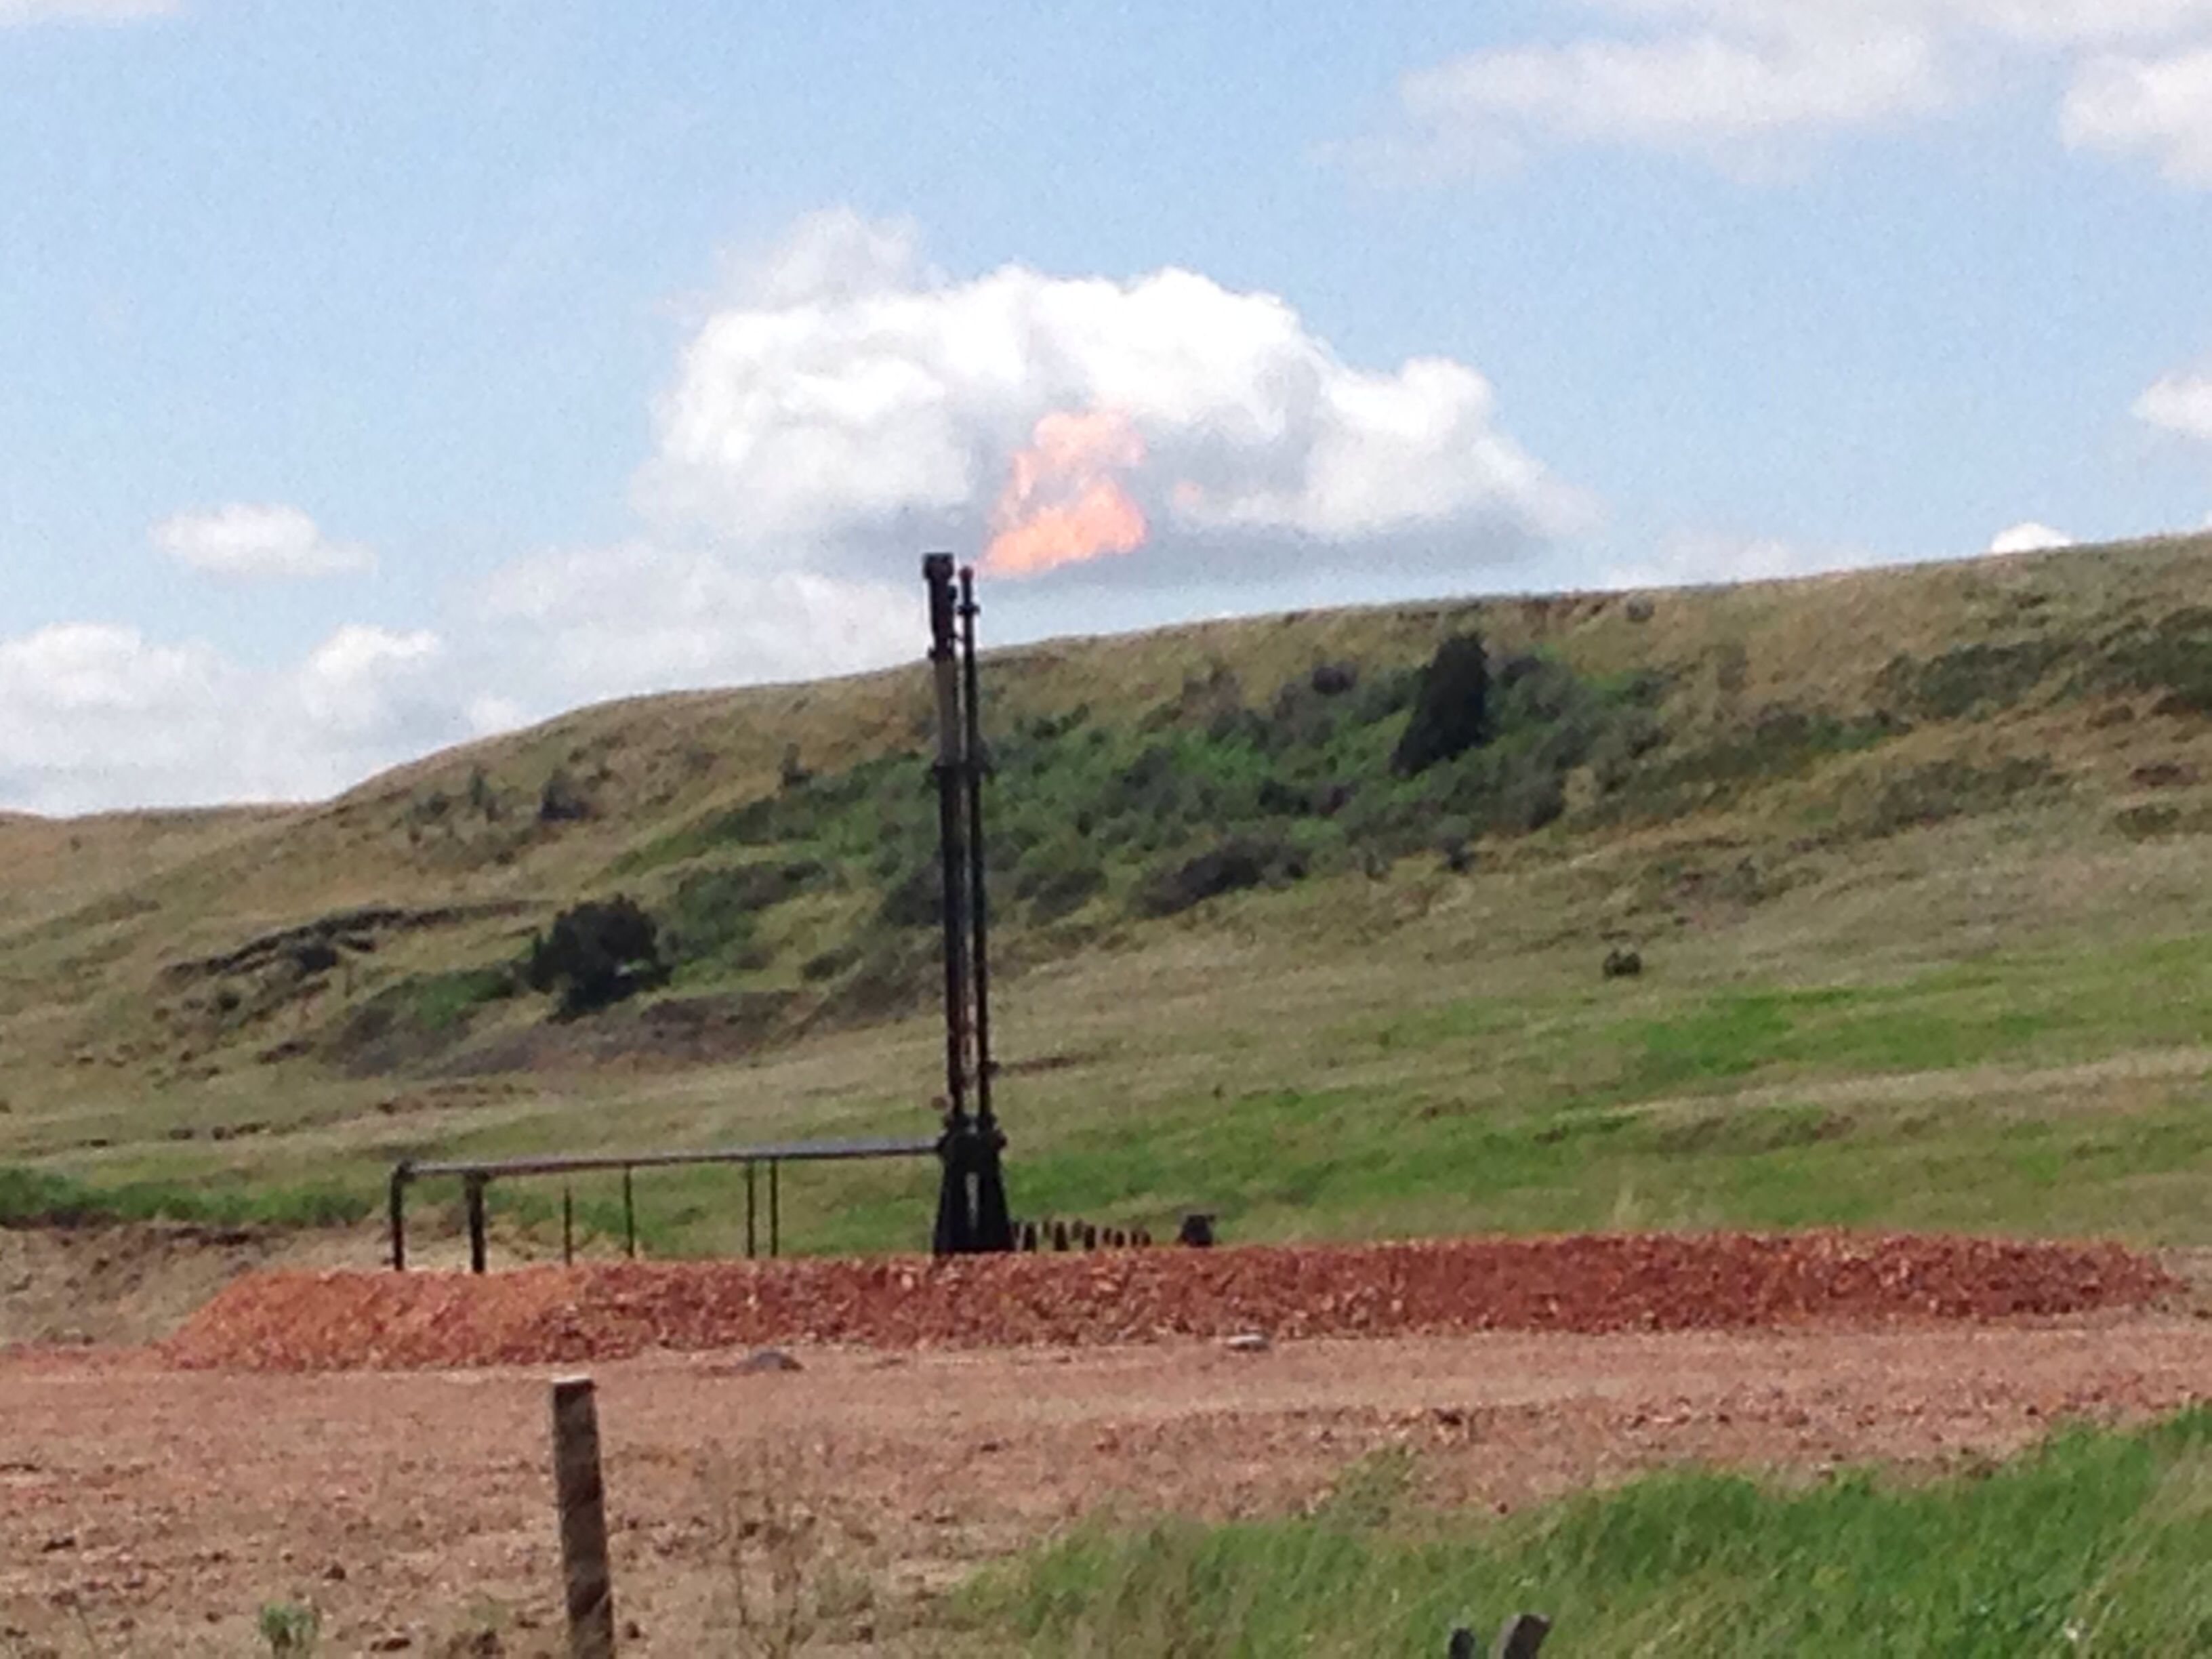
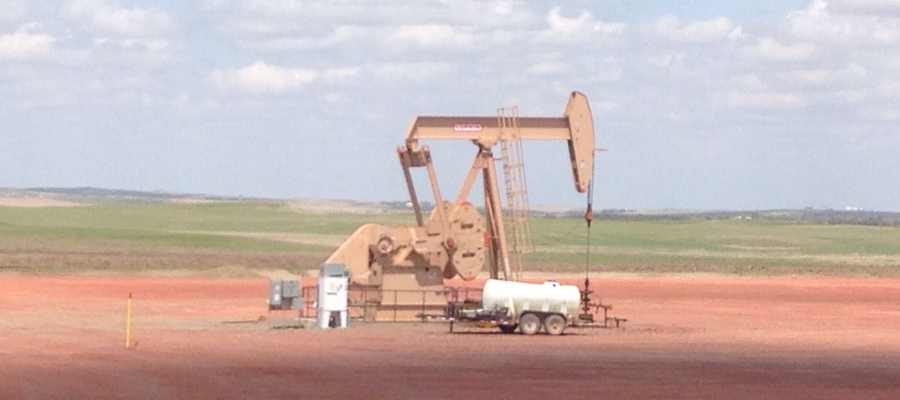
Photos
And finally… We spent some time with NPCA collecting photos for that map with our app in ND this spring. Below are just a few, the rest of which can be found in our new ND photo album: