Chieftain’s Wisconsin Frac Sand Mine Proposal
Potential Land-Cover Change and Ecosystem Services
By Ted Auch, Great Lakes Program Coordinator, FracTracker Alliance
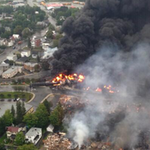
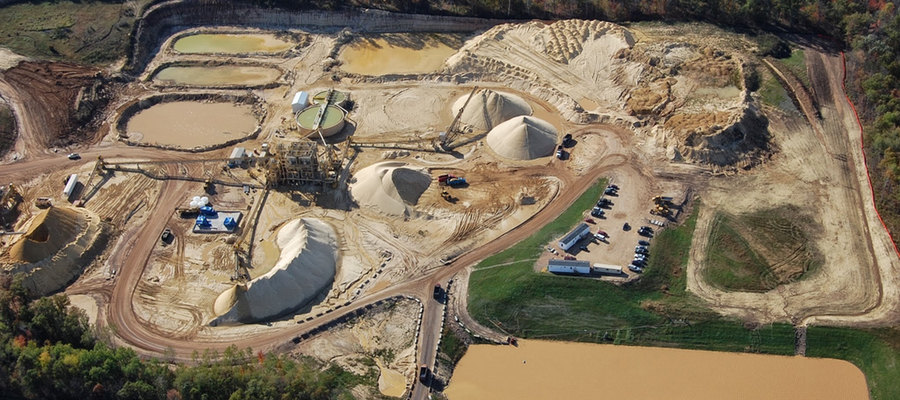
Chieftain Metals Corp, a relatively large mining company, recently proposed to develop nine silica sand mines in the Barron County, Wisconsin towns of Sioux Creek and Dovre, as well as adjacent Public Land Survey System (PLSS) parcels.1 Here we show that the land that Chieftain is proposing to convert into one of the state’s largest collections of adjacent silica sand mine acreage (like the one shown above) currently generates $8-15 million in ecosystem services and commodities per year.
Background
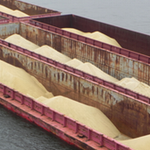
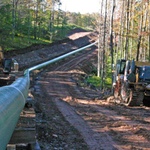
Sand, often silica sand, is used in the hydraulic fracturing process of oil and gas drilling. Including sand in the frac fluid helps to prop open the small cracks that are created during fracking so that the hydrocarbons can be more easily drawn into the well. To supply the growth in the oil and gas industry, bigger and bigger sand mines are being developed with four factors being critical to this expansion:
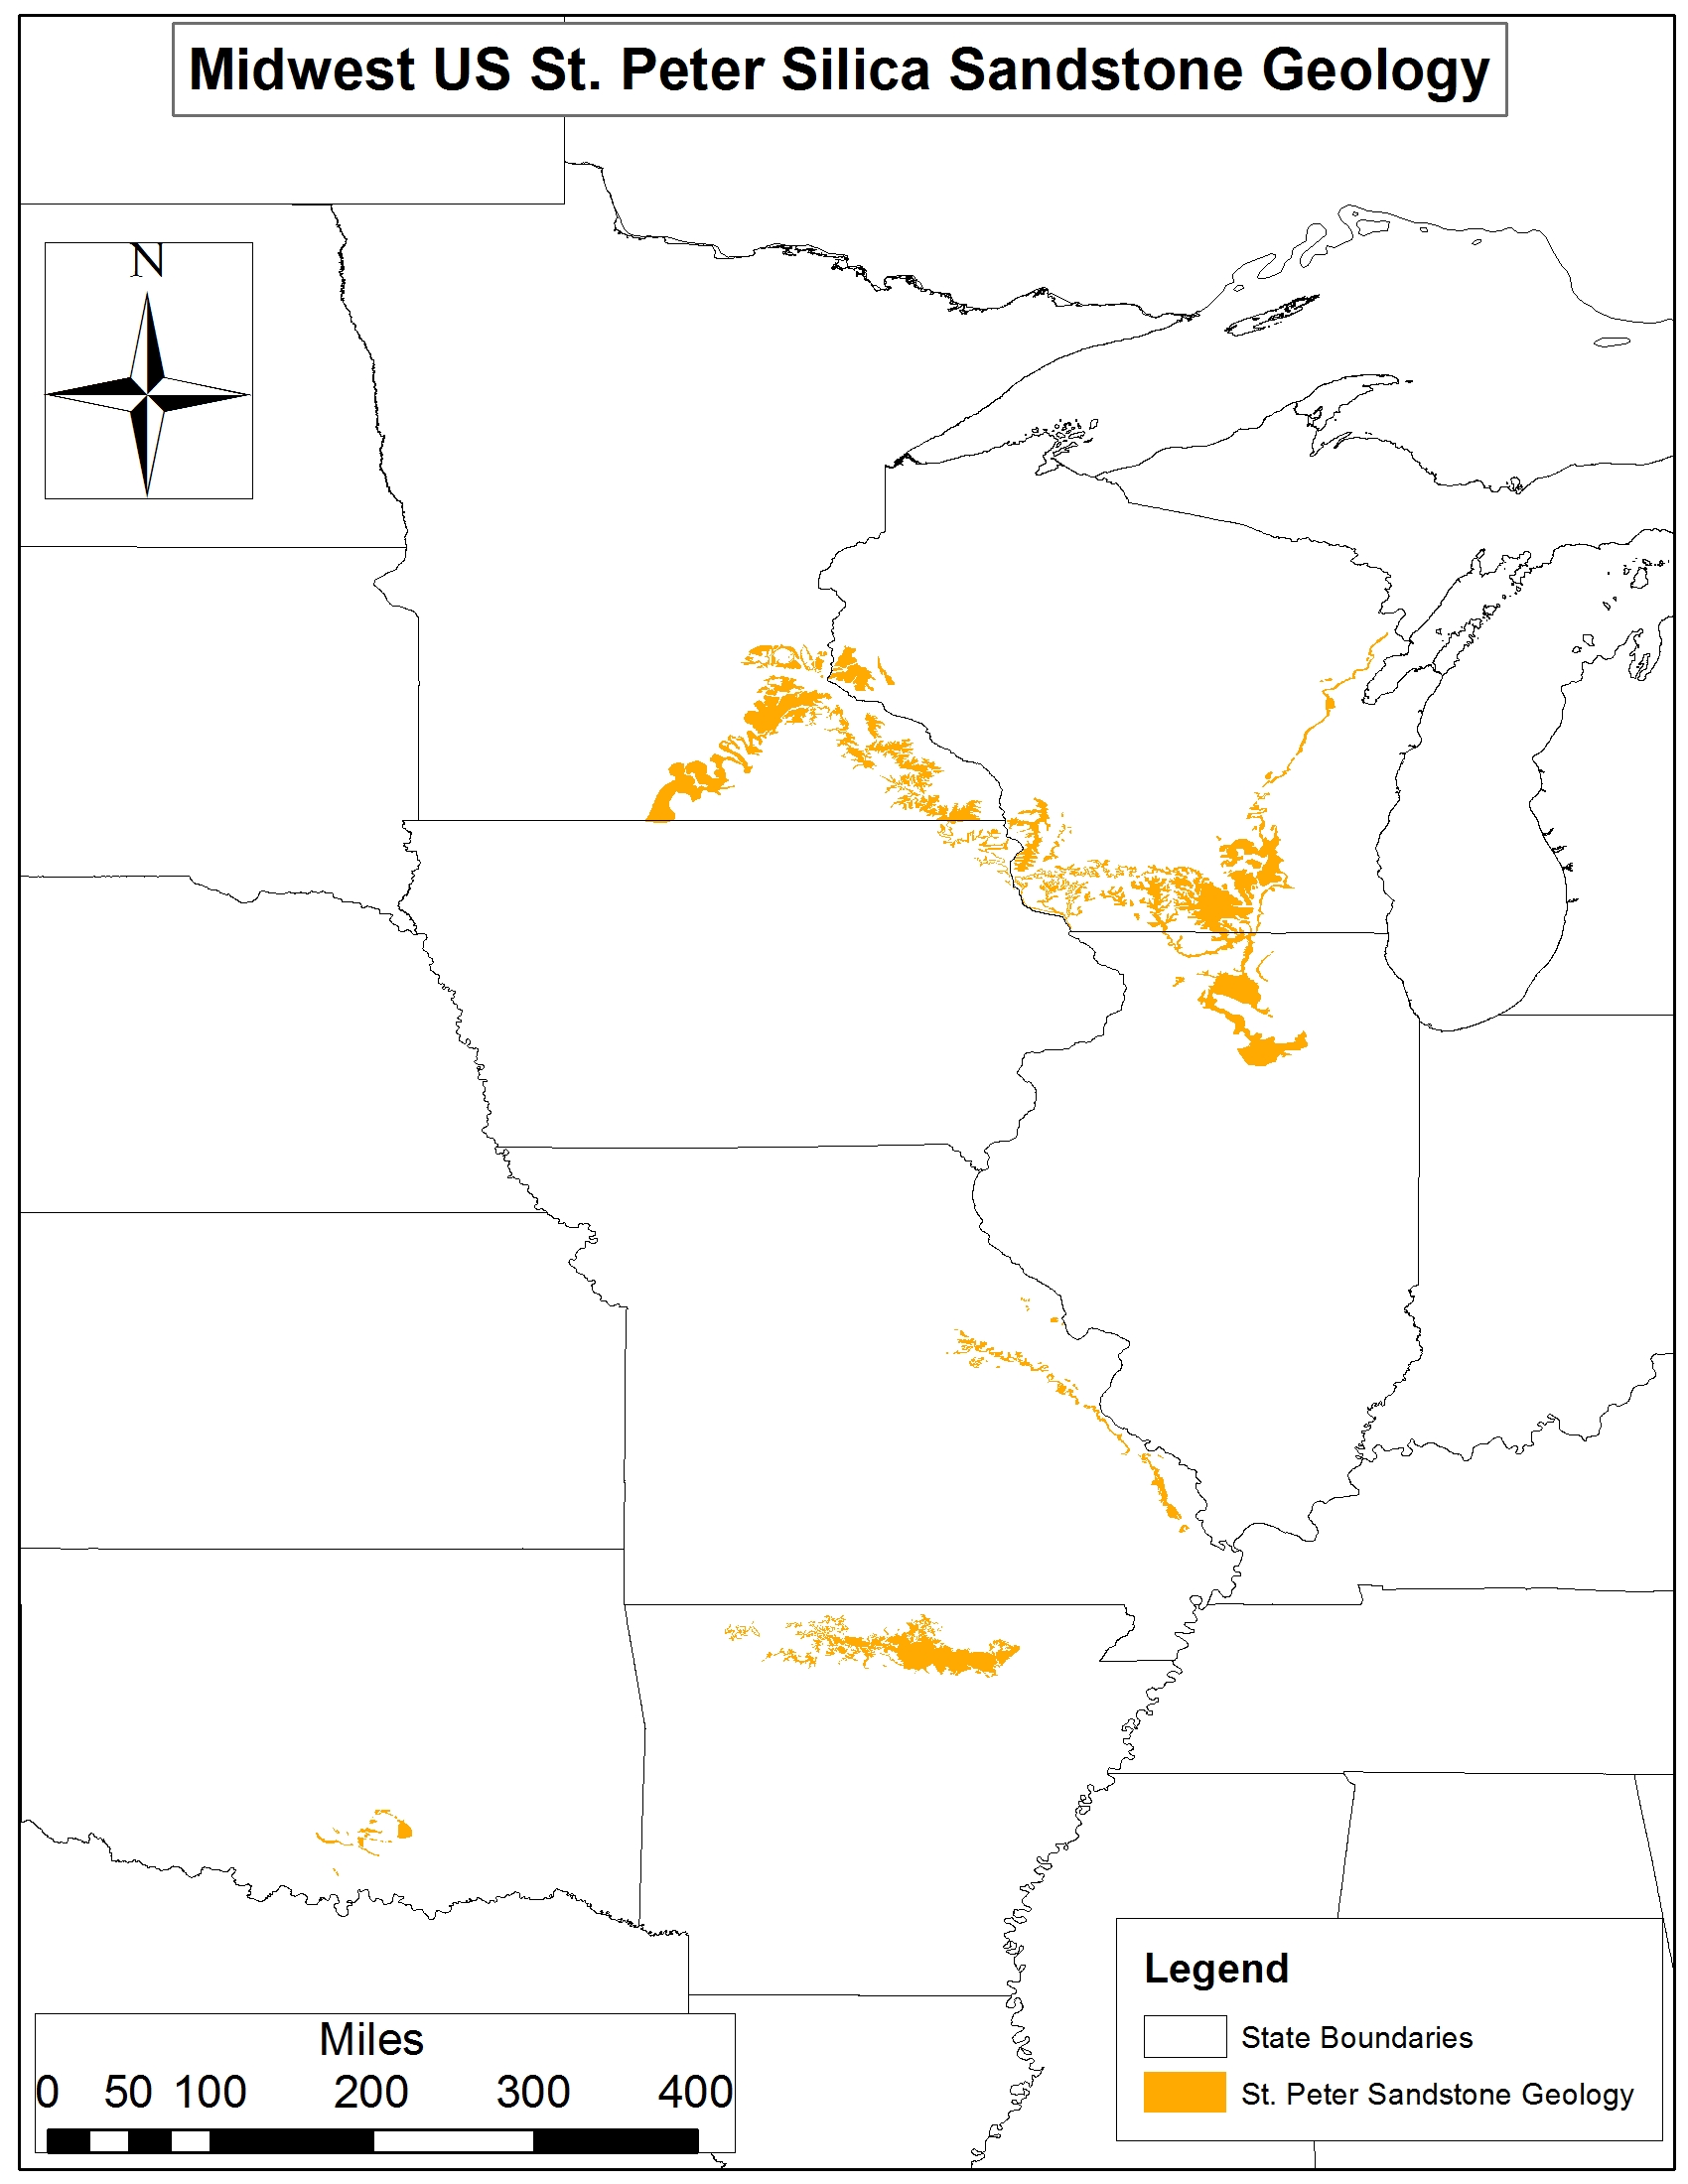
Figure 1. St. Peter Silica Sandstone geology across Minnesota, Wisconsin, Illinois, Missouri, Arkansas, and Oklahoma
- The average shale lateral is getting longer by 50-55 feet per quarter and the average silica sand demand is increasing in parallel by 85-90 tons per lateral per quarter with current averages per lateral in the range of 3,500-4,300 tons (Note: These figures stem from an analysis of 780 and 1,120 Ohio and West Virginia laterals, respectively.)
- The average silica sand mine proposal throughout the Great Lakes is increasing exponentially.
- The average sand mine is targeted at non-agricultural parcels disproportionately. As an example we looked at one of the primary Wisconsin frac sand counties and found that even though 6% of the county was forested and nearly 50% was in some form of agriculture, 98.2% of the frac sand mine area was forested prior to mining. An already fragmented landscape with respect to threatened or endangered ecosystems is becoming even more so, as the price of sand hits an exponential phase and the silica industry all but abandons its positions in Oklahoma and Texas.
- The primary geology of interest to the silica sand industry is the St. Peter Silica sandstone geology, which includes much of Southern Minnesota, West Central and Southern Wisconsin, as well as significant sections of Missouri and Arkansas (Figure 1).
Sand Mine Proposal Land Use Footprint
To quantify the land-cover/land-use change (LULC) of these proposed mines, we extracted the parcel locations from WI DNR’s Surface Water Data Viewer using the company’s construction permit.2 These parcels encompass approximately 5,671 acres along the edge of what US Forest Service calls the Eastern Broadleaf Forest (Minnesota & NE Iowa Morainal, Oak Savannah) and Laurentian Mixed Forest provinces (Southern Superior Uplands).
Using a now-defunct WI DNR program called WISCLAND we were able to determine the land-cover within the aforementioned acreage in an effort to determine potential changes in ecosystem services and watershed resilience. The WISCLAND satellite imagery was generated in 1992, so it provided a nice snapshot of what this region’s landscape looks like absent silica sand mining.
In our joining of the PLSS and WISCLAND data we determined that 2,684 acres (47%) are currently covered by forests, namely:
- Mixed/Other Broad-leaved Deciduous,
- with scattered patches of Sugar Maple (Acer saccharum), and
- Jack Pine (Pinus banksiana) in the northeast sections (Figures 2 and 3).
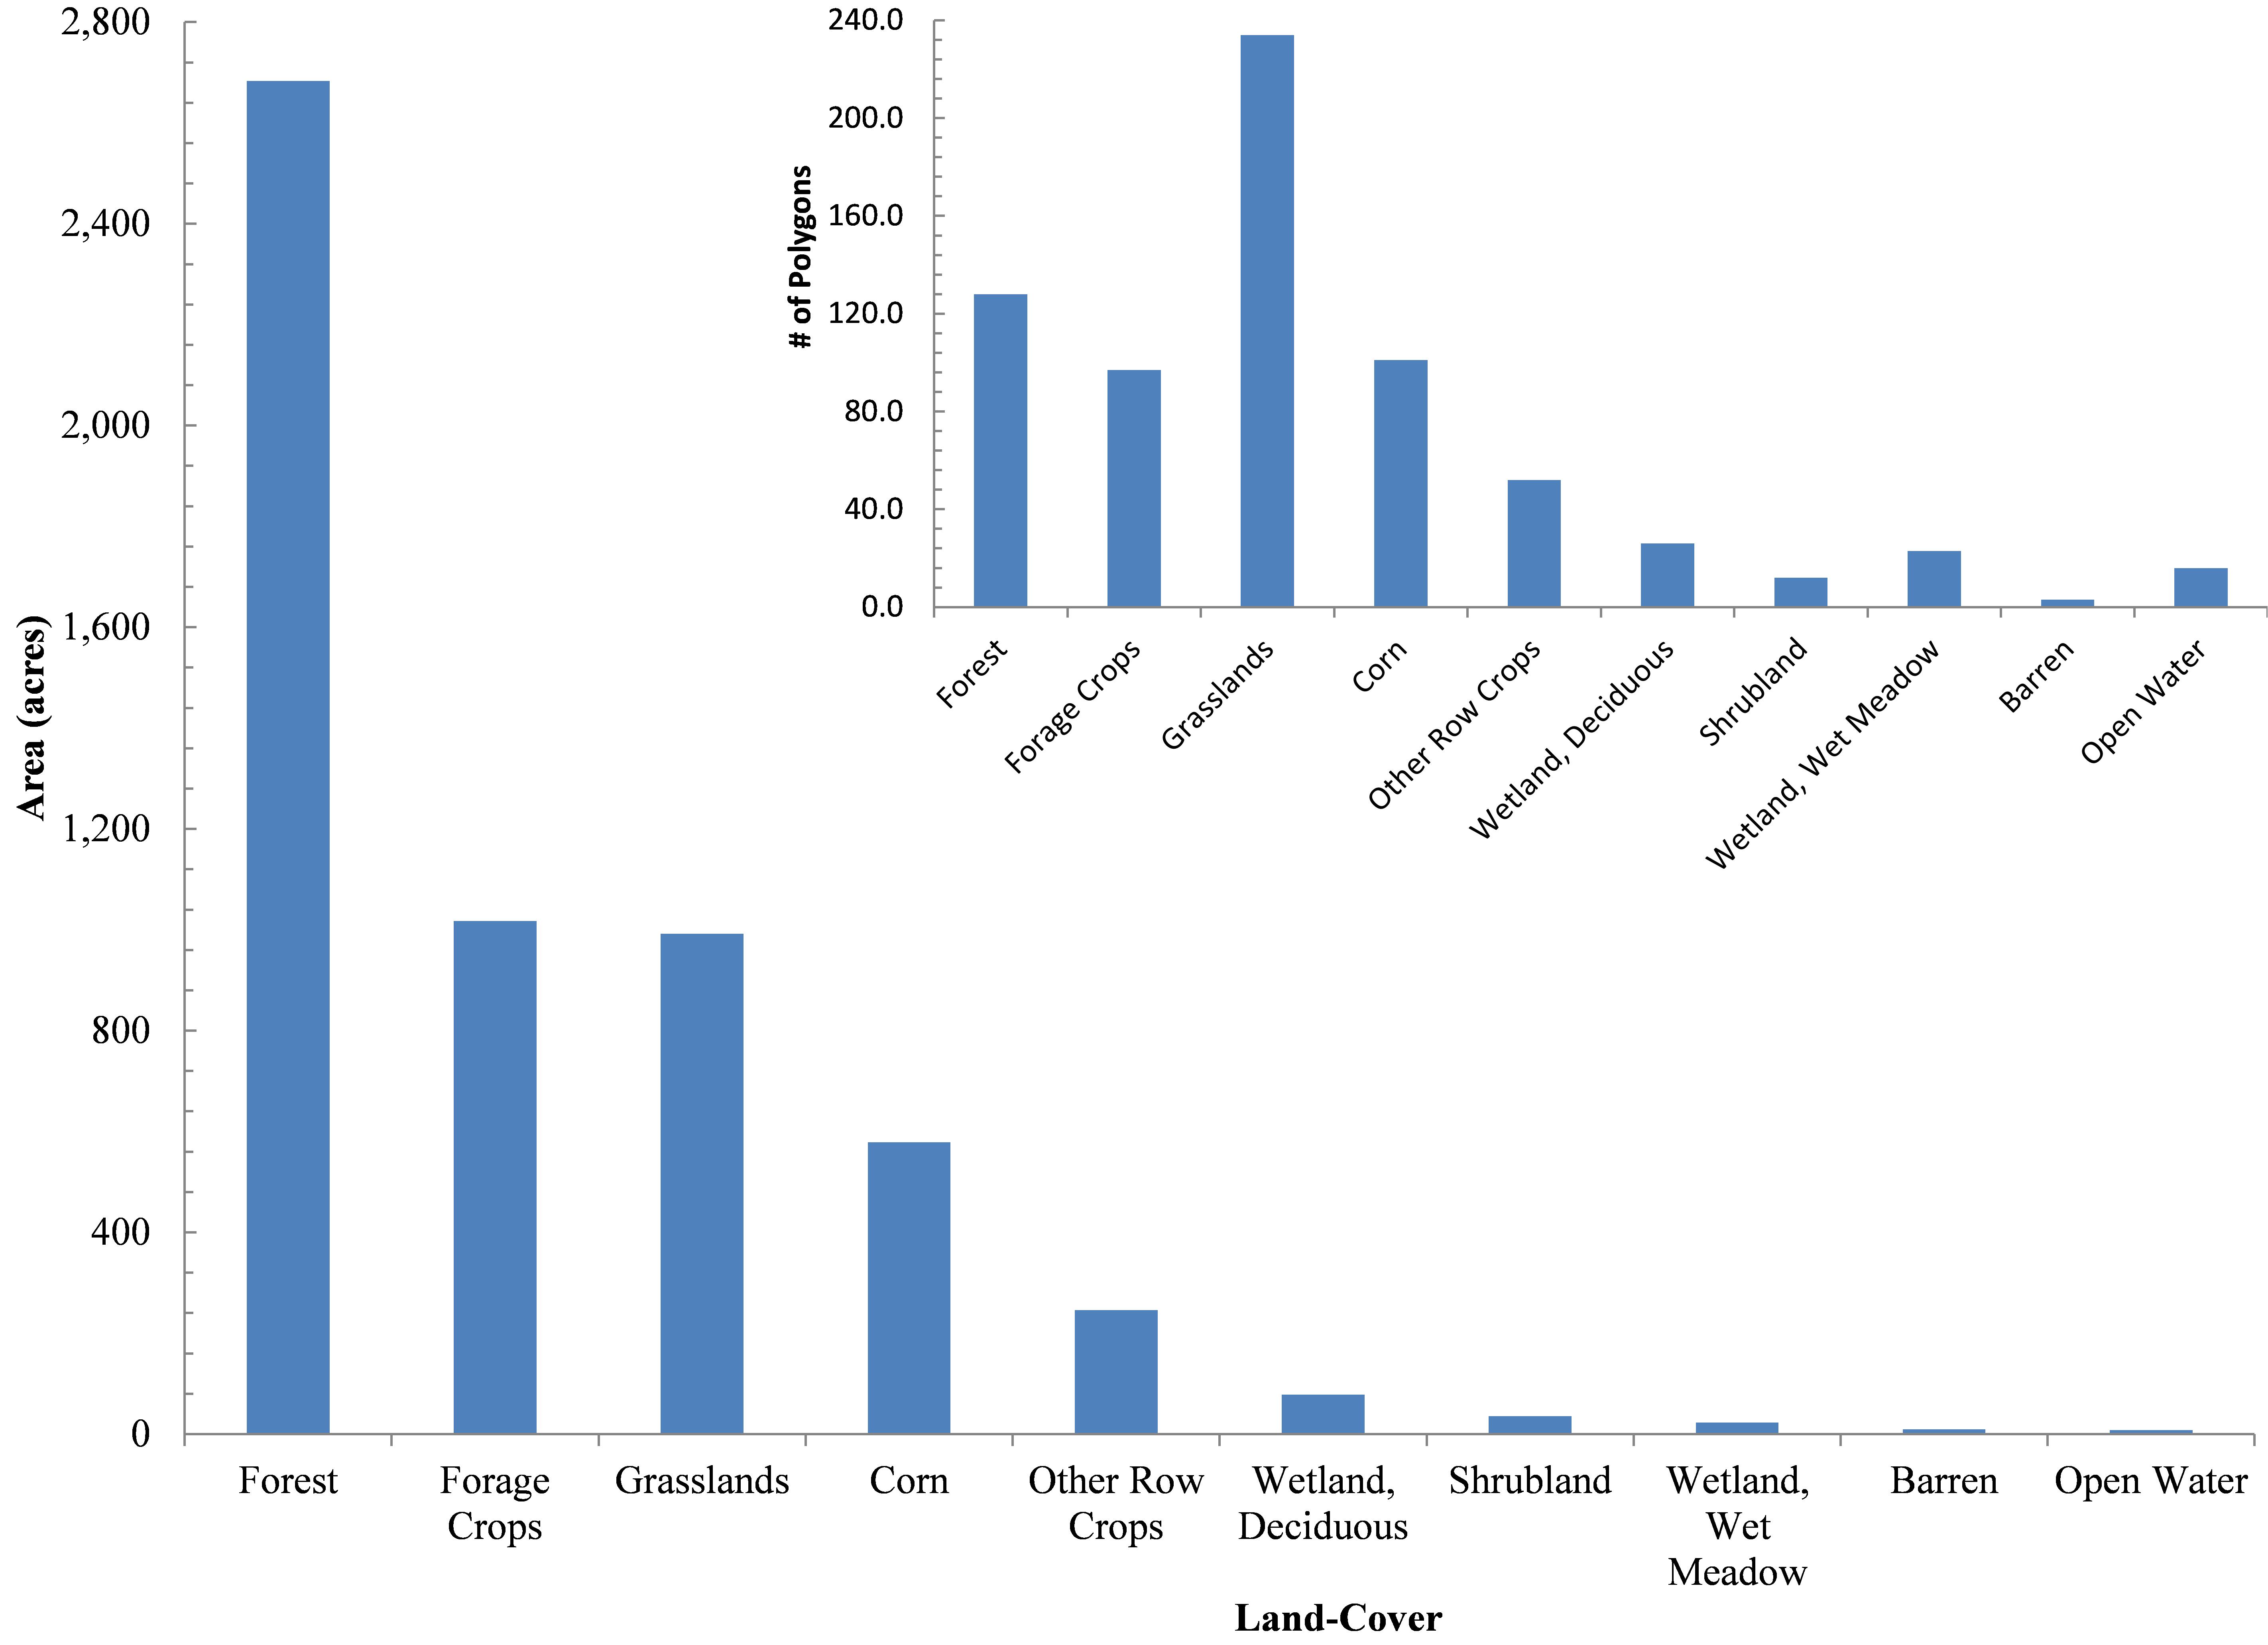 Figure 2. Chieftain silica sand mine proposal’s land-cover across 5,671 acres in Barron County, WI |
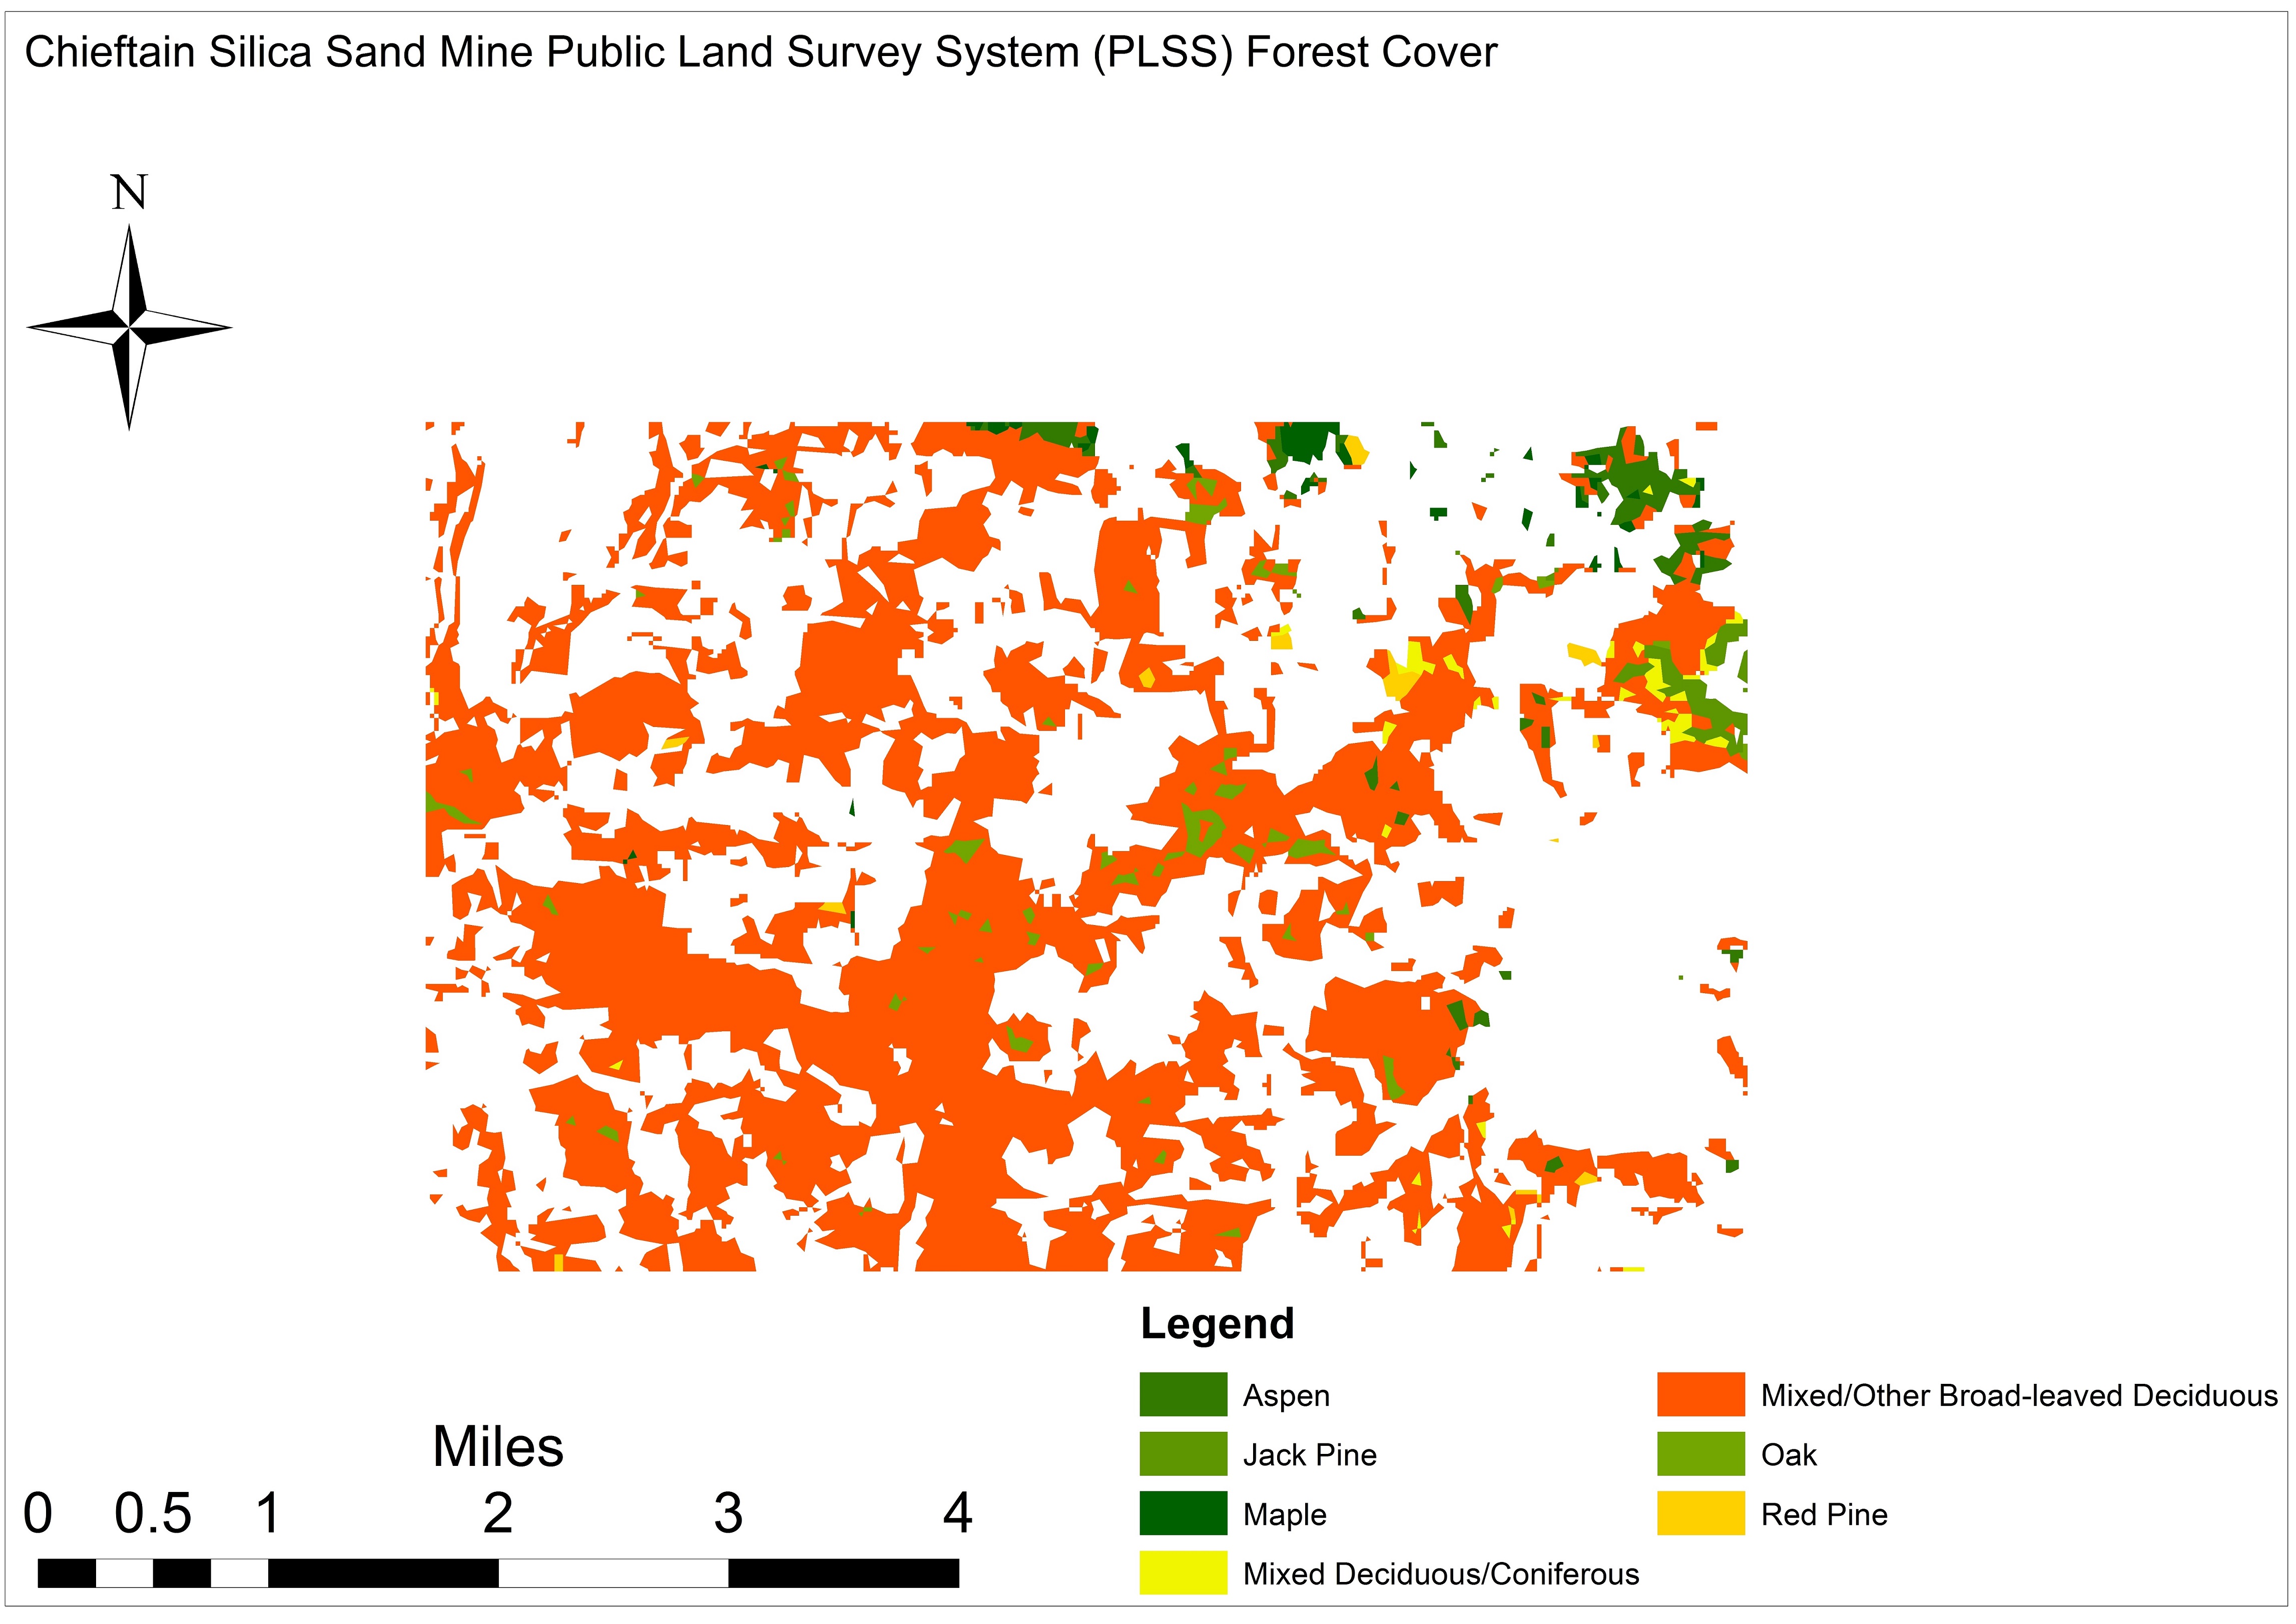 Figure 3. Chieftain proposal’s forest cover across 5,671 acres in Barron County, WI |
Forage crops and grasslands occupy 2,010 acres (35%) across 331 polygons averaging 7 acres scattered across the proposed mining area. Corn and other row crops account for 825 acres (15%) of Chieftain’s proposal, randomly distributed across the area of interest. Collectively, these land-cover types account for 22% of all polygons averaging 5.7 and 4.7 acres, respectively. Shrublands account for ≤1% of the Chieftain proposal (36 acres) averaging 3 acres spread across a mere 12 polygons (Figures 4 and 5).
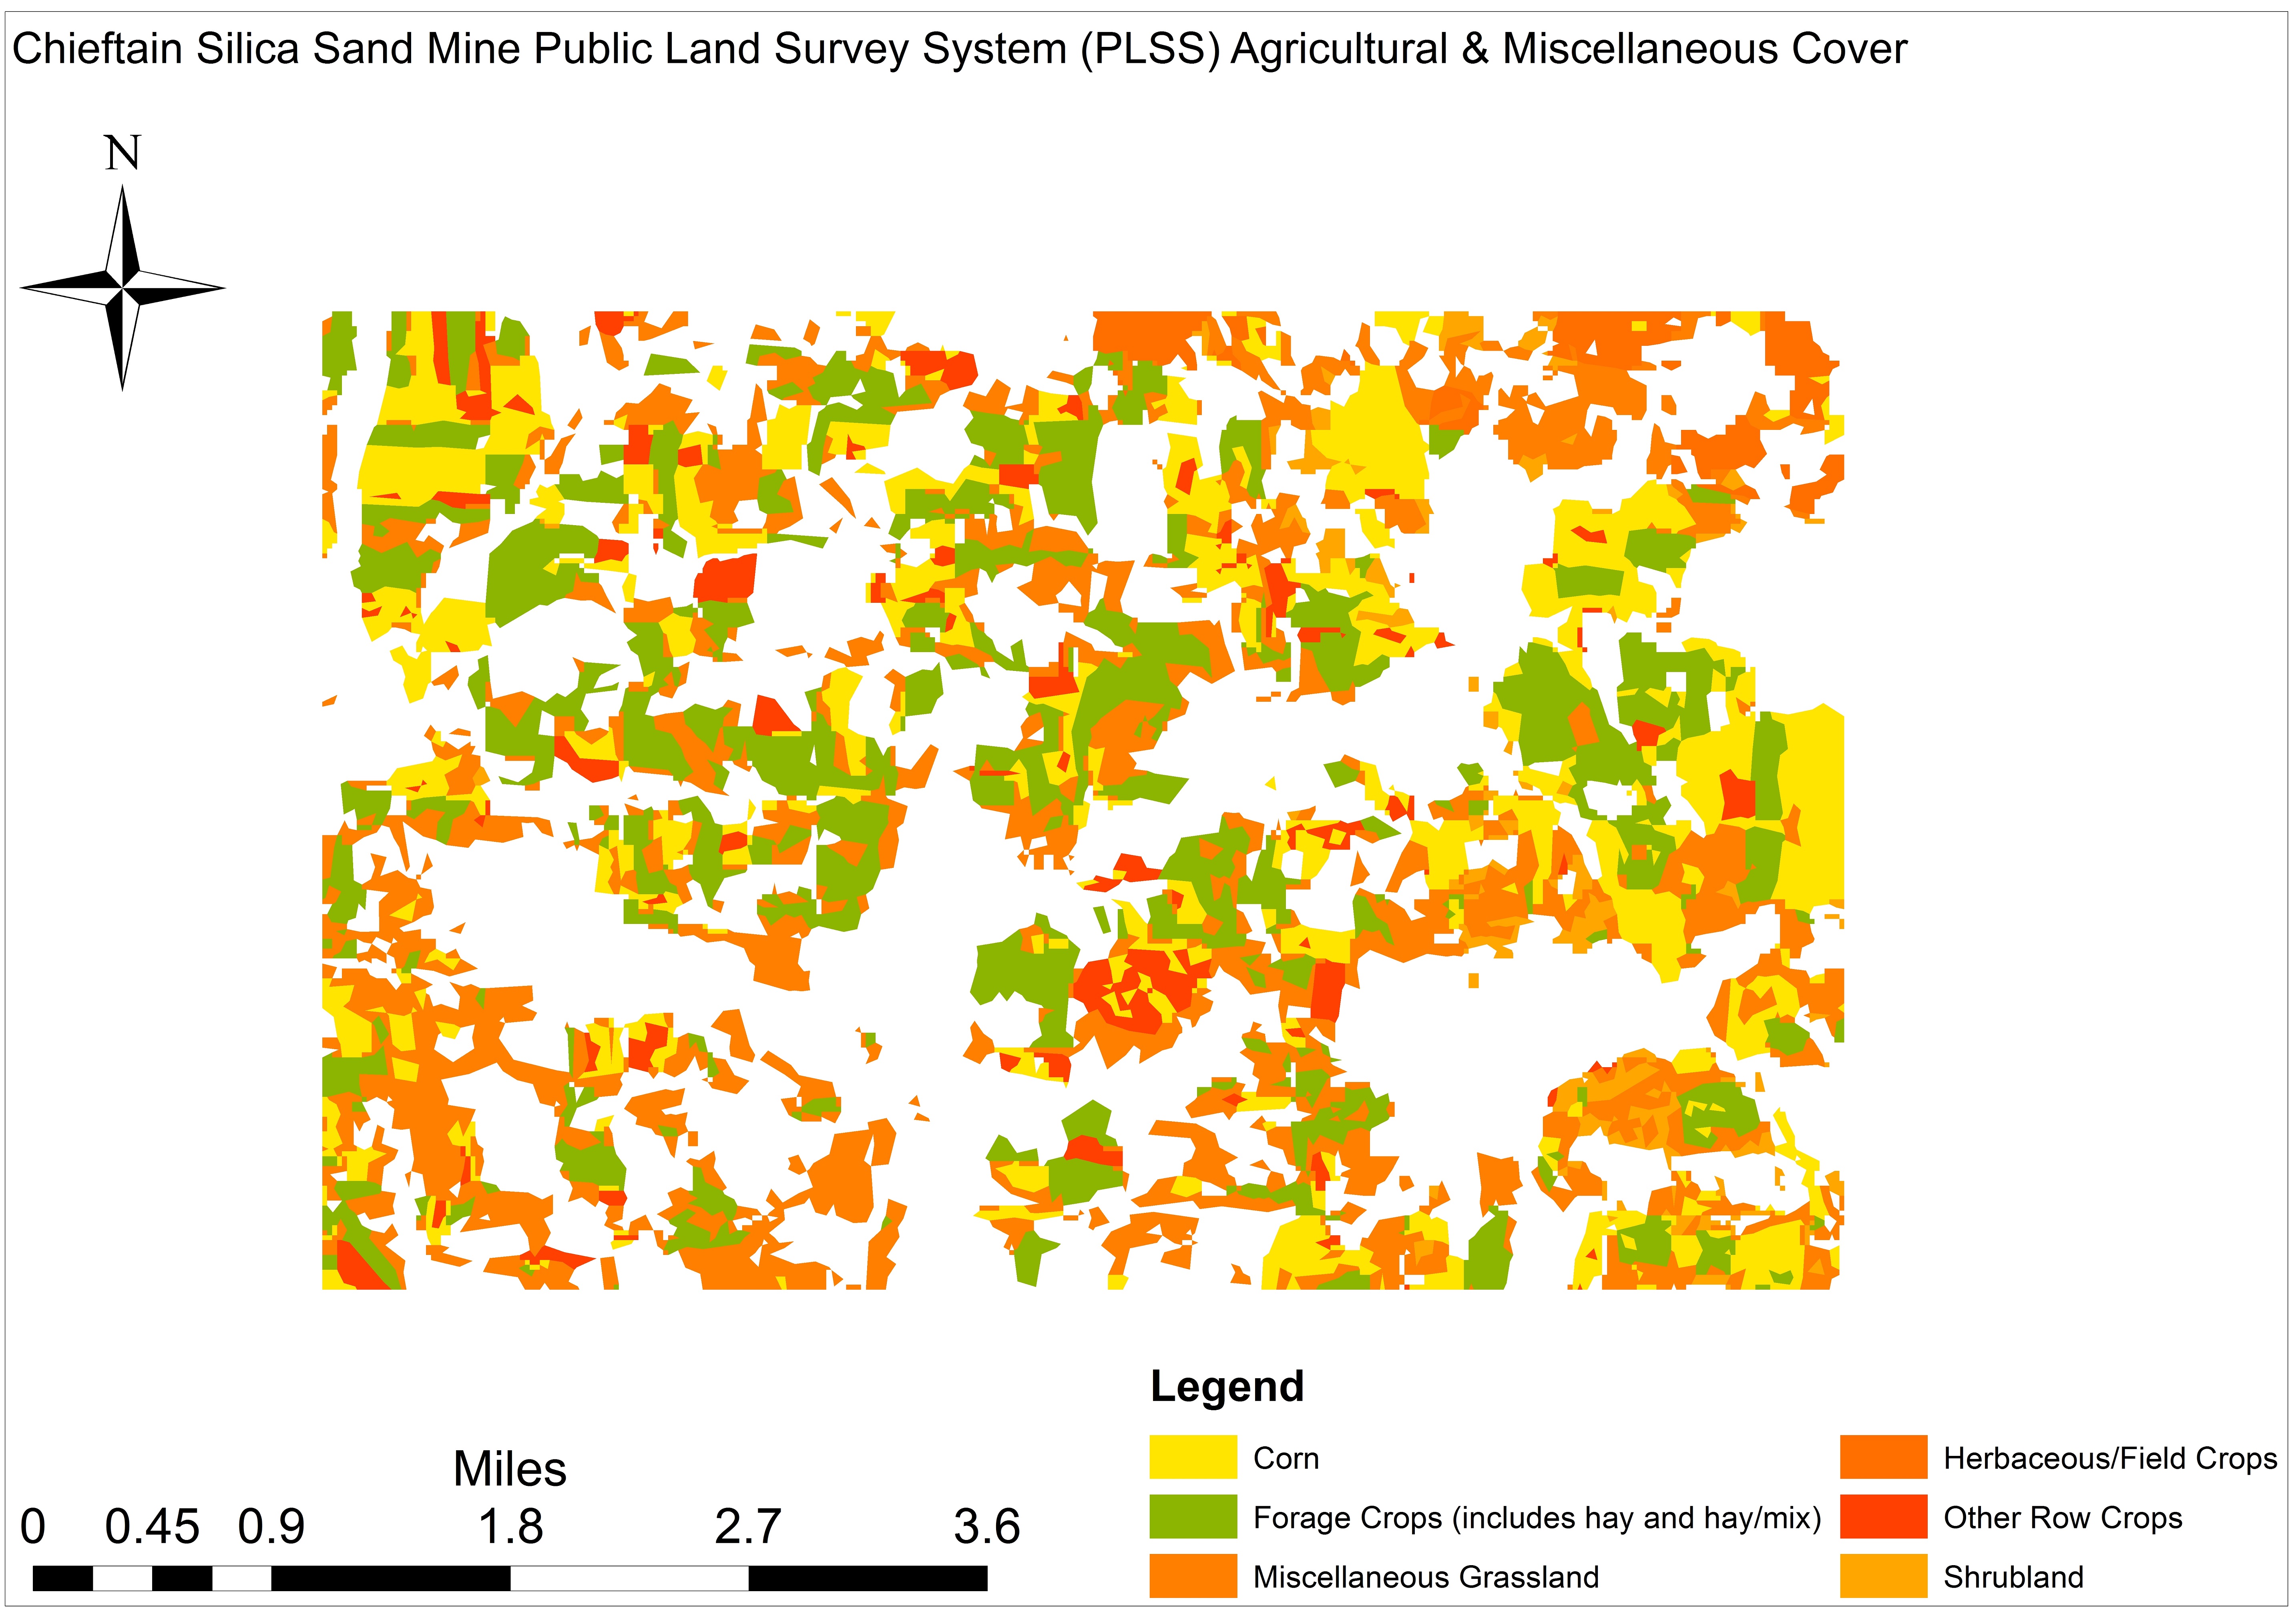 Figure 4. Chieftain proposal’s agricultural & miscellaneous cover across 5,671 acres, Barron County, WI |
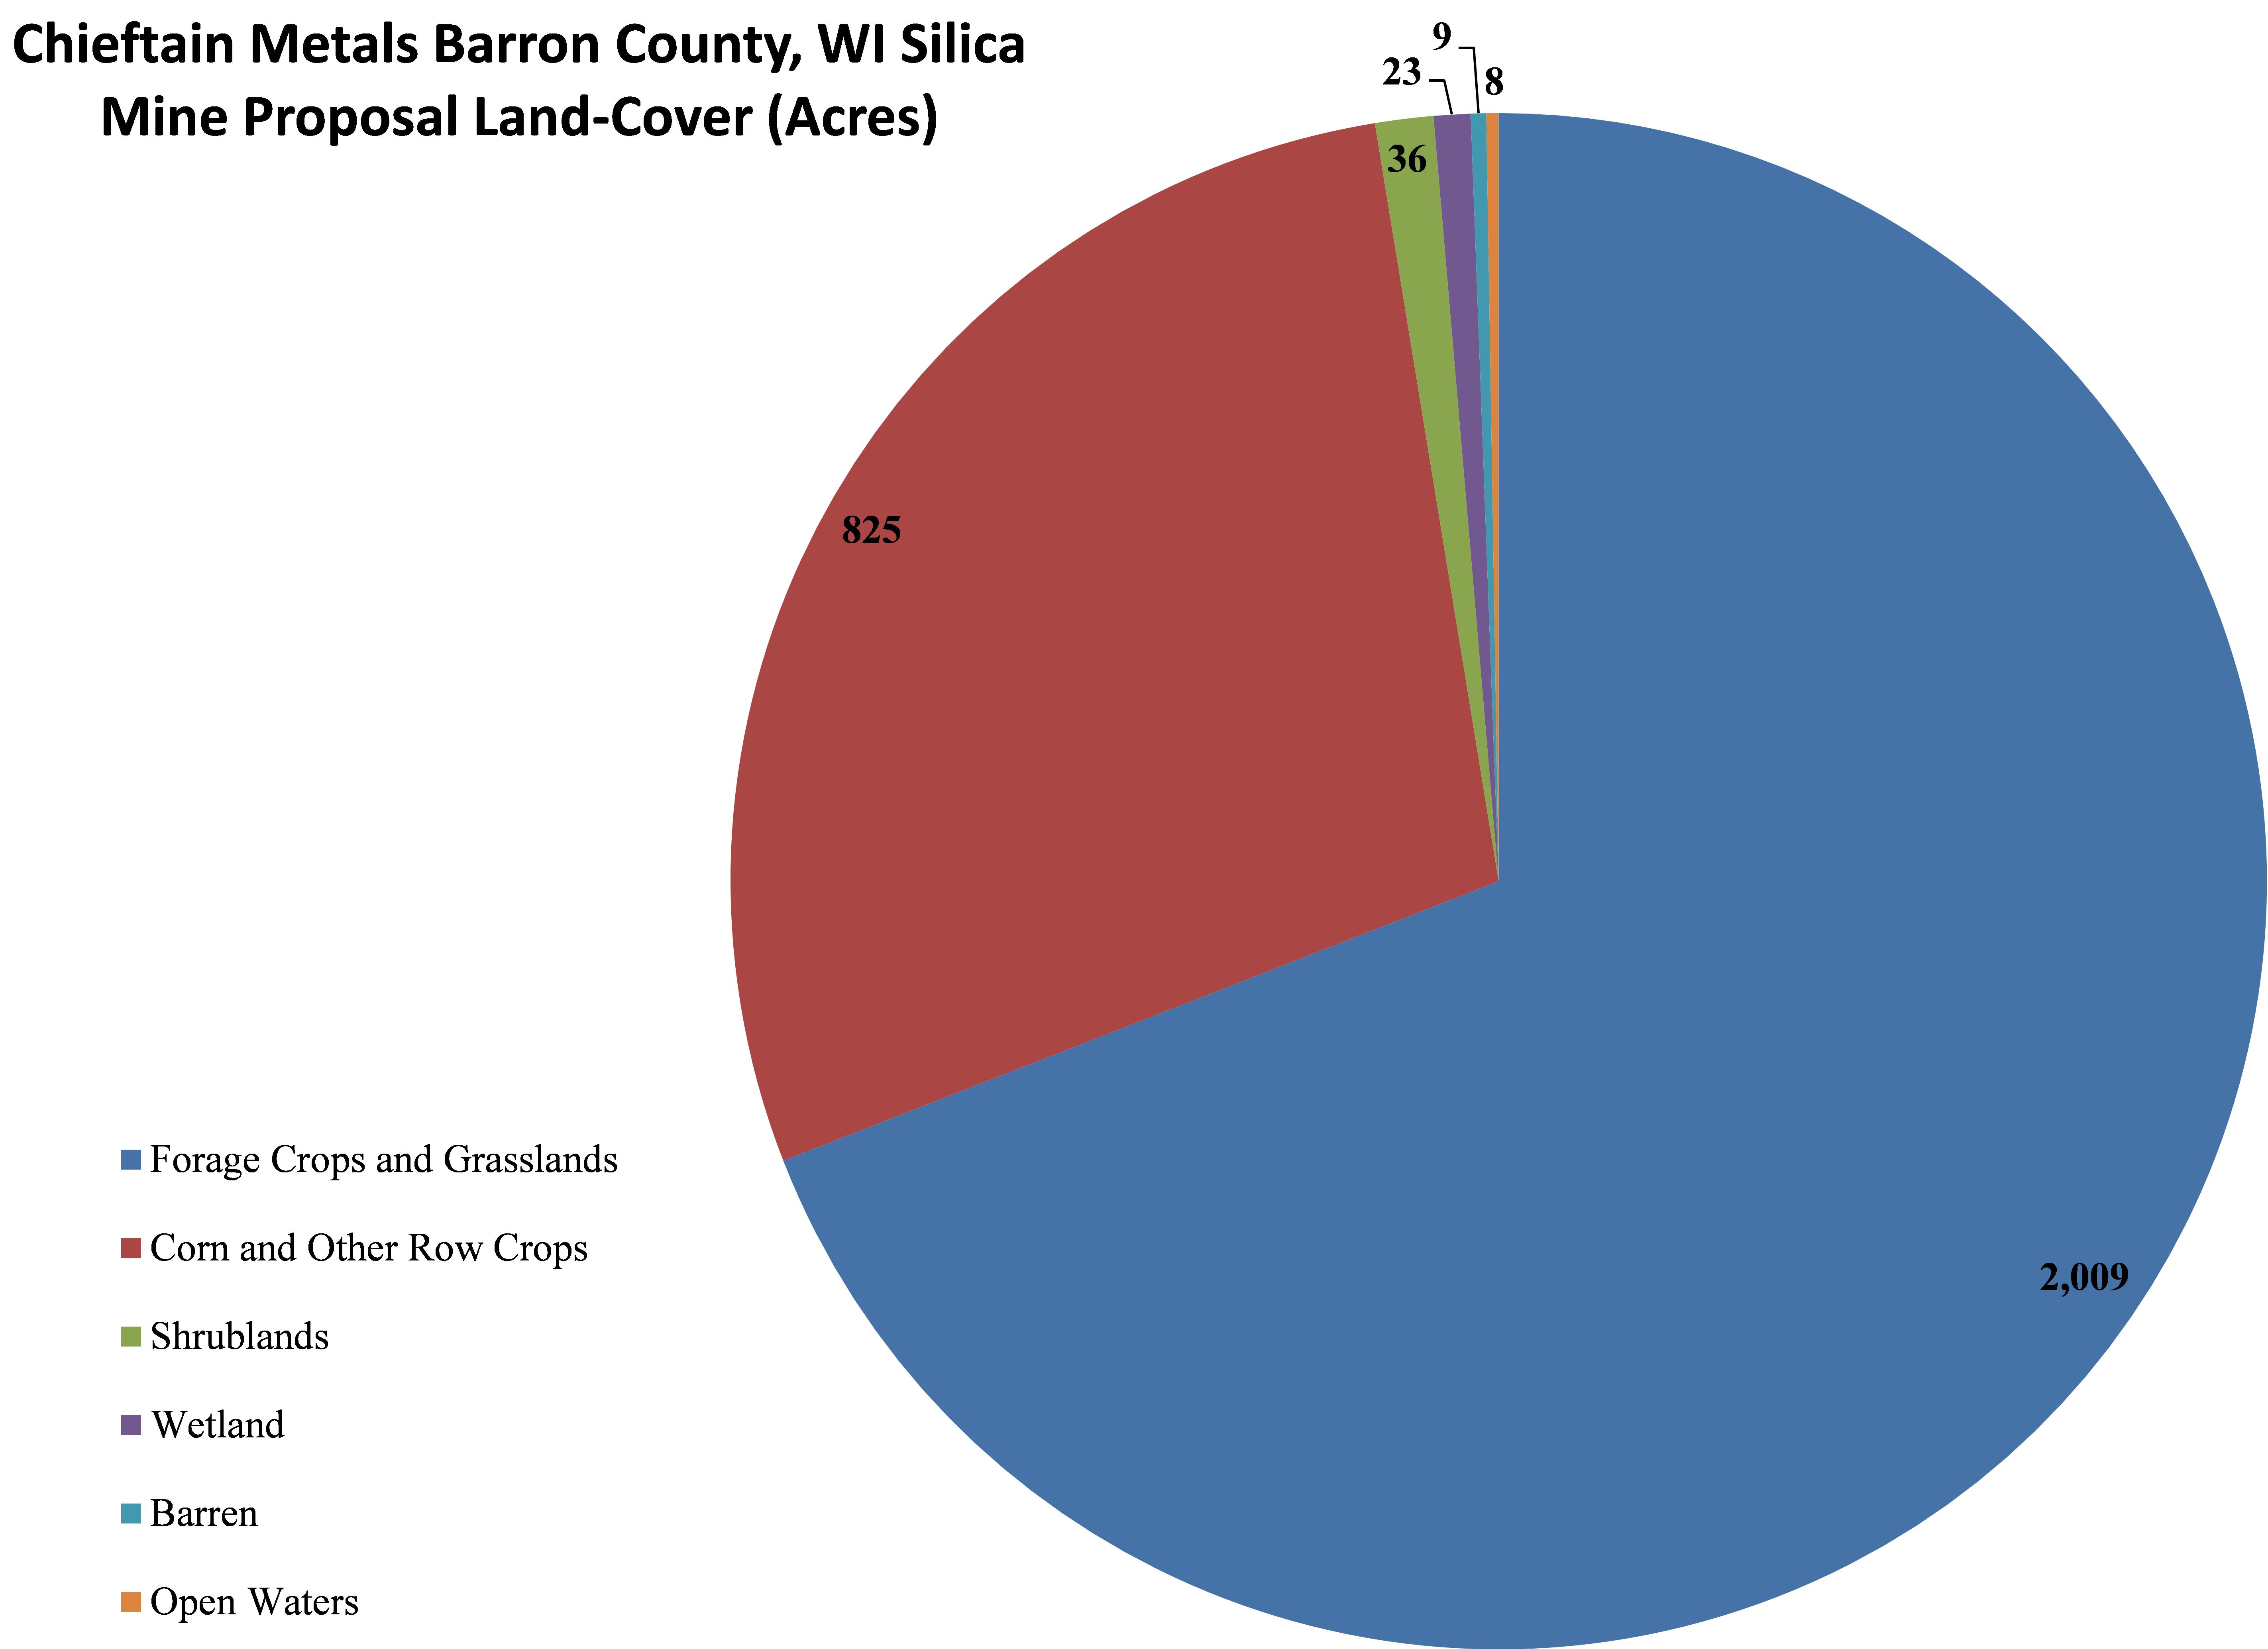 Figure 5. Chieftain proposal’s land-cover by acreage across 5,671 acres, Barron County, WI |
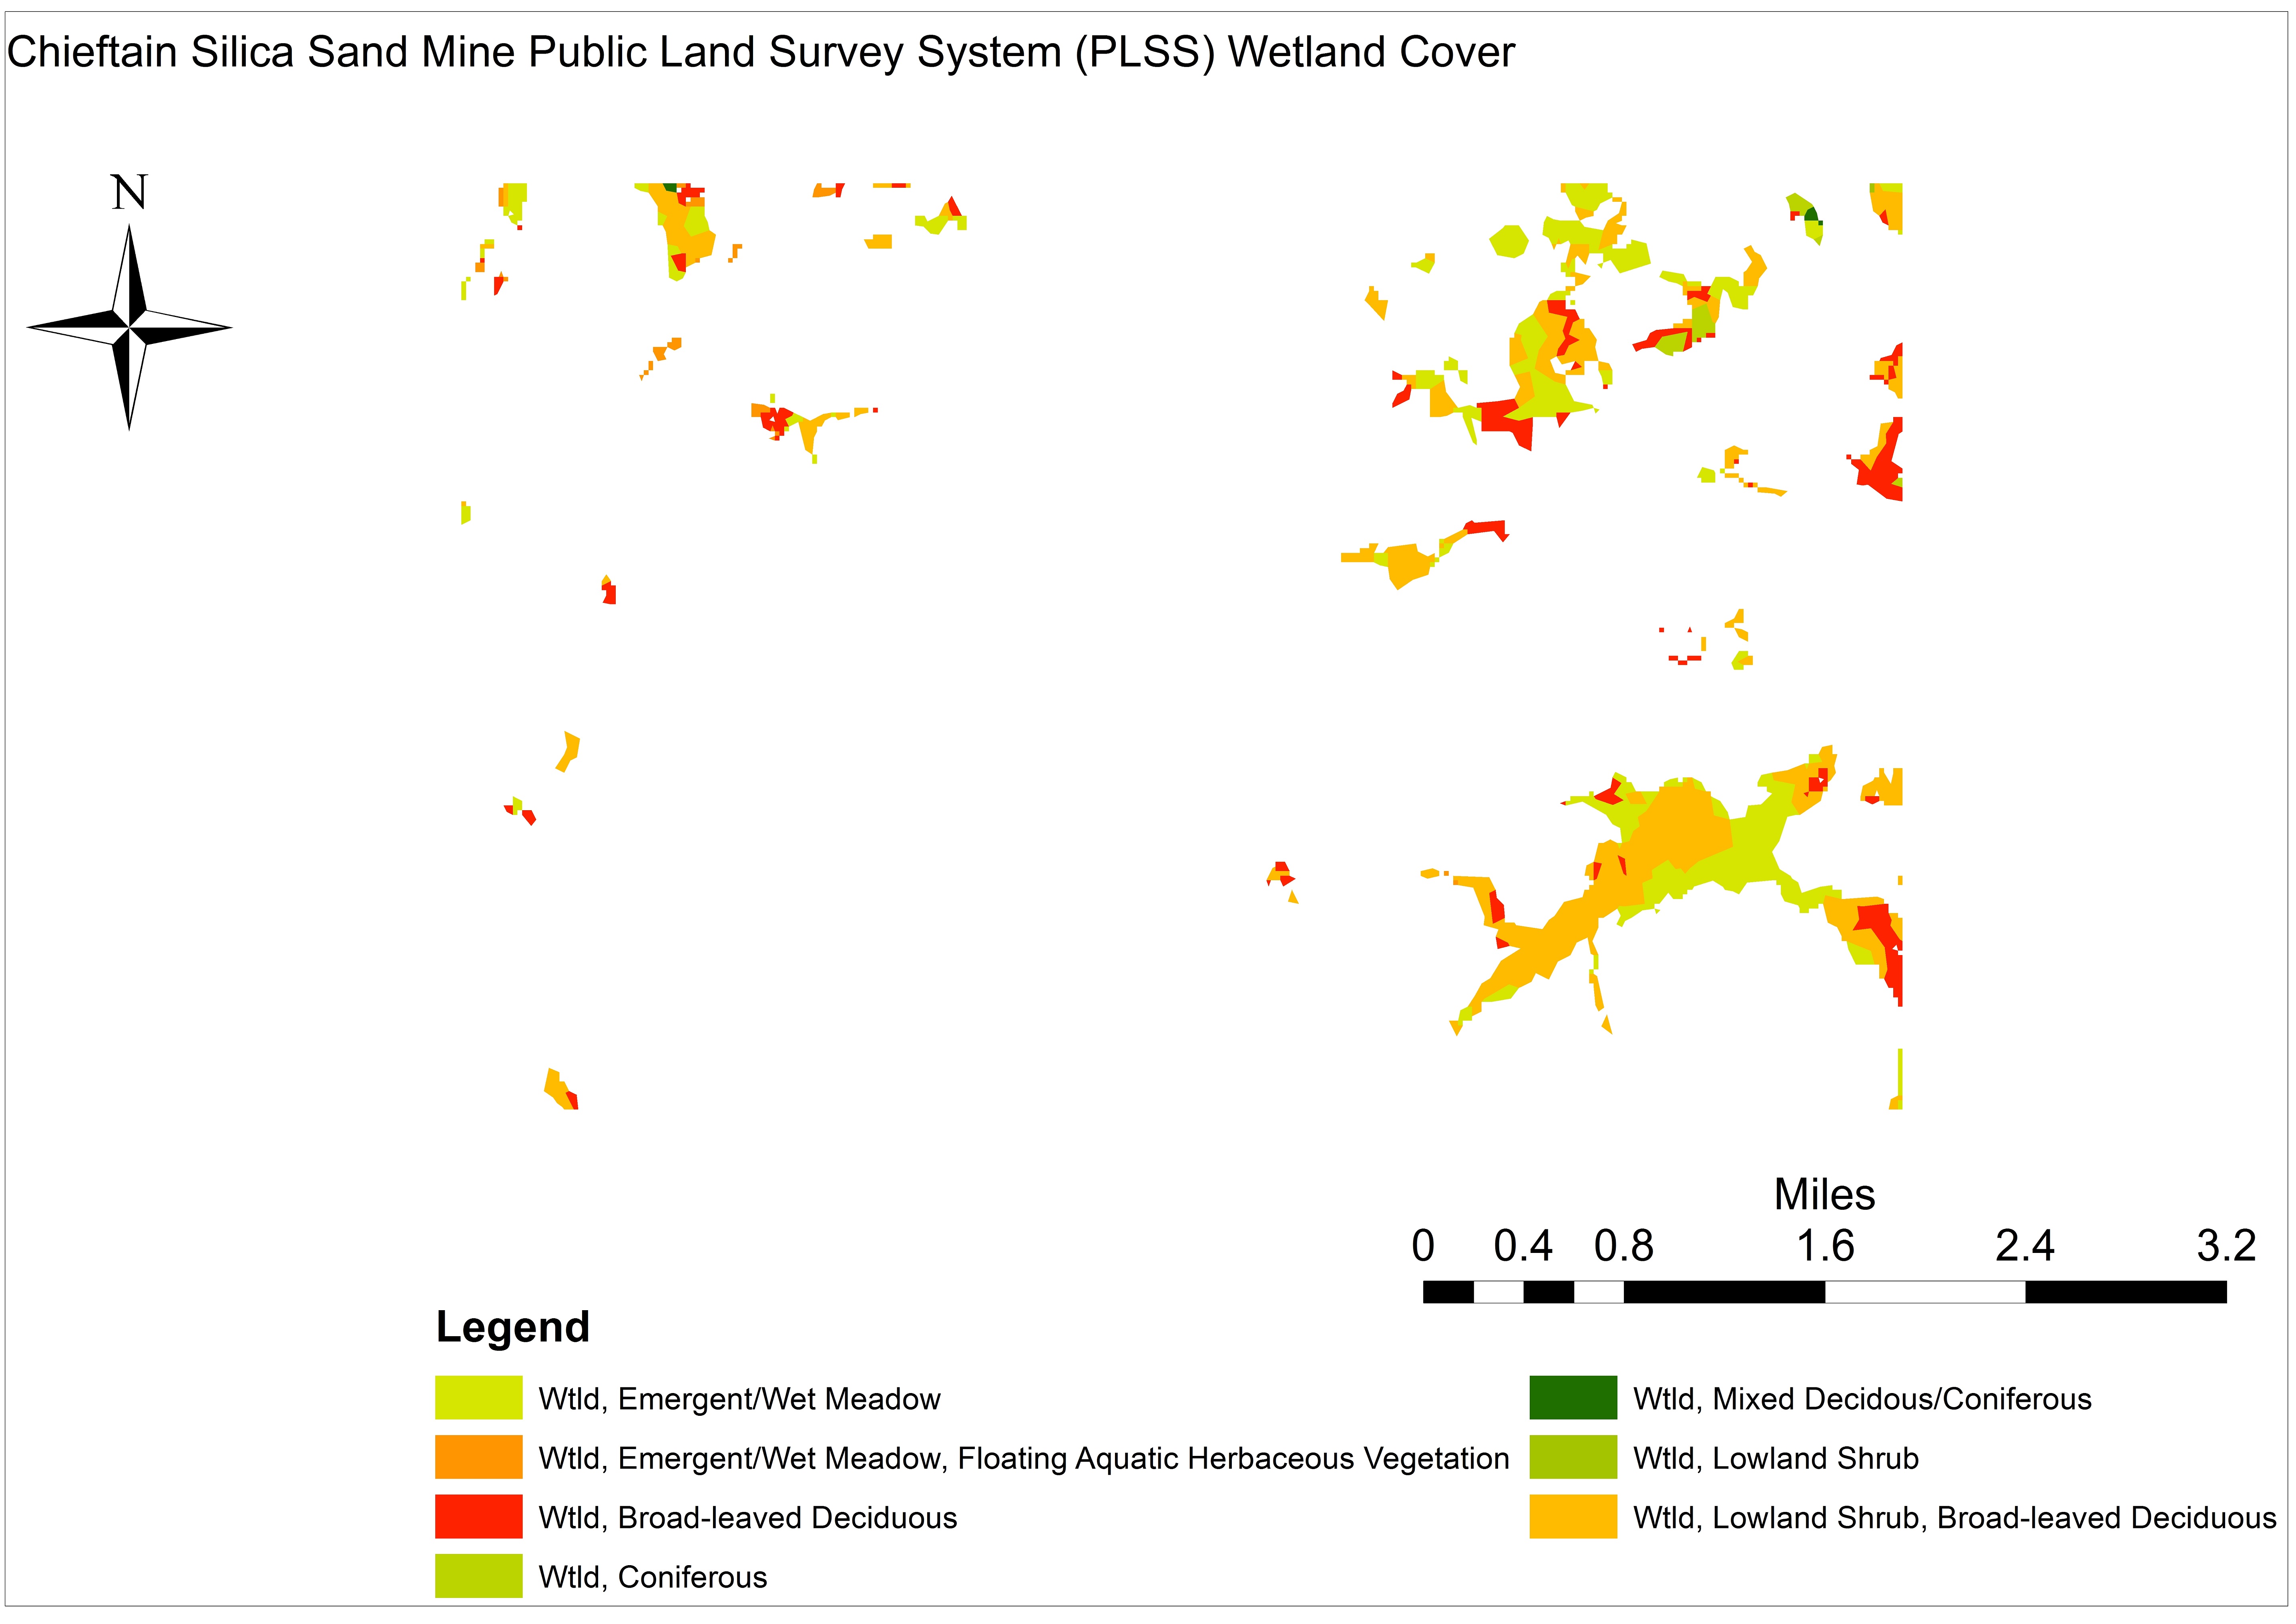
Figure 6. Chieftain silica sand mine proposal’s wetland cover across 5,671 acres in Barron County, WI.
Seven types of forested and shrub-dominated wetlands occupy 101 acres (1.8%) of Chieftain’s PLSS parcels, with an average size of four acres spread across 49 discrete polygons. Wetlands are clustered in three sections of the proposed mining area, with the largest continuous polygons being adjacent 160 acre “Wetland, Lowland Shrub, Broad-leaved Deciduous” and 88 acre “Wetland, Emergent/Wet Meadow” polygons along the area of interest’s eastern edge (See Figure 6 right).
Land Value
In an effort to quantify the value of this aggregation of parcels we calculated annual plant and soil productivity, as well as crop productivity, in terms of tons of carbon and nitrogen3 lost using established WI forest, crop, and freshwater productivity values.4-6
It is worth noting that the following estimates are conservative given that we were not able to determine average above/belowground ecosystem productivity values for the wetland and barren. Additionally, our estimates for crops and grasslands did not include belowground productivity estimates, which likely would increase the following estimates by 20-30%.
1. Forests
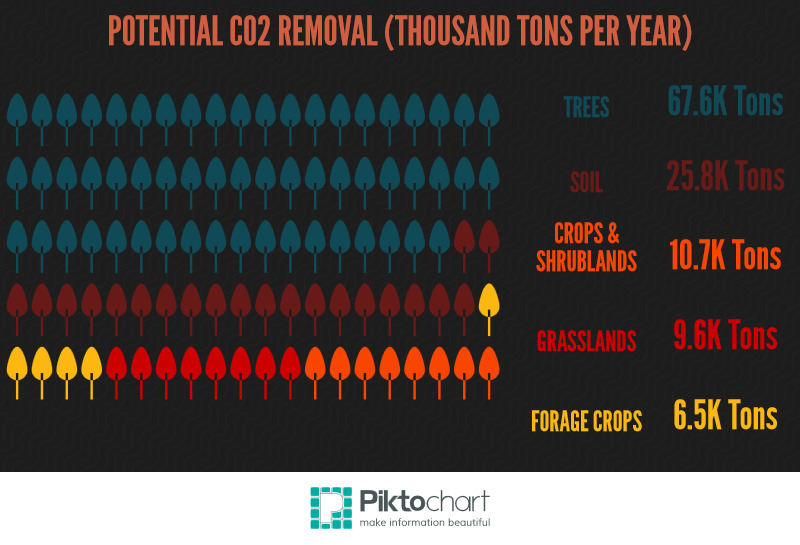
The aforementioned-forested polygons accrue 44,274-90,969 tons of aboveground CO2. This means that if we assume the average forest in this area is 65-85 years old, the Chieftain mine proposal would potentially remove 3.3-6.8 million tons of built up CO2 equivalents. This figure is equal to the per capita CO2 emissions of 202,800-416,700 WI residents. The renewable wood generated on this site has a current market value of $418,516 to $654,125.
If we assume that the price of CO2 is somewhere between $12 and $235 per ton the forested polygons within Chieftain’s proposal currently capture (remove from the atmosphere) $4-17 million worth of CO2 annually.
Additionally, this area generates 23,262-45,447 tons of CO2 via soil processes such as litter decomposition and root production (i.e., 1.8-3.4 million tons over the average 65-85 year lifespan of these forests). The annual value of these belowground processes in terms of soil fertility (i.e., soil organic matter, nitrogen, and phosphorus) is somewhere between $569,962 and $1,029,662 or $43-77 million over the 65-85 year period used in this analysis.
2. Forage Crops and Grasslands
The 1,018 acres of forage crops are currently generating 6,526 CO2 tons per year, which is equivalent to the per capita emissions of 400 WI residents (Note: This carbon has a current value in the range of $417,700-$848,200). The 992 acres of grasslands are capturing 6,600-12,600 tons of CO2 per year and if we assume the average grassland parcel in WI is 5-15 years of age these polygons have captured CO2 equivalent to the per capita emissions of 4,000-7,700 Wisconsinites. Together these two land-cover types capture $840,300-2,518,000 worth of CO2 annually. Again it is worth noting these values do not include any accounting soil processes, which are generally 20-30% of aboveground productivity.
3. Corn, Other Row Crops, Shrublands
The 860 acres of corn, miscellaneous row crops, and shrublands are currently generating 10,450-10,980 CO2 tons per year, which is equivalent to the per capita emissions of 640-670 WI residents. Using the same assumptions about time in grassland (i.e., average Conservation Reserve Program (CRP) tenure) and the 65-85 year assumption used for forests for shrublands we estimate these three land-cover types annually capture CO2 equivalent to the per capita emissions of 8,600-11,030 Wisconsinites. Together these three land-cover types capture $682,420-1,498,030 worth of CO2 annually.
The total average value of commodities produced on the 1,843 acres of cropland is $462 per acre or $851,272 annually.
4. Open Waters
This small fraction of the Chieftain proposal captures 134 tons worth of CO2 annually with a value of $8,590-17,650.
Total Quantifiable Monetary Value
In summary, the nine Chieftain frac sand mines if approved would use land that currently generates $8.77-16.63 million in ecosystem services and commodities per year. Historical and future land-use potential valuations are generally not accounted for in mineral lease agreements. This analysis demonstrates that such values are nontrivial and should at the very least be incorporated into lease agreements, given that post-mining reclamation strategies result in lands that are 40% less productive. If these lands are converted to sand mines, their annual values would drop to $5.0-9.5 million post-development.
Questions about the impact of such operations on LULC in the Mississippi Valley are becoming more and more frequent. For example, families such as the Schultz in Trempealeau County are signing permanent conservation easements. Doing so allows them to continue farming and allocates some acreage to the restoration of oak savanna and dry prairie, considered by the WI Department of Natural Resources (DNR) as “globally imperiled” and “globally rare,” respectively.
References & Footnotes
- It is worth noting that Chieftain is taking a huge gamble with this proposal. It stands to reason that such risky ventures are necessary given that the company’s share price has plummeted to $00.15 per share since its IPO days of around $5.50-6.00. These gambles could either catapult Chieftain into the frac sand mining big leagues or relegate it to the bench, however.
- Chieftain Silica Sand Mine Proposal, Barron County, WI Review, page 4
- We used carbon and nitrogen as their importance from a greenhouse gas (i.e., CO2, CH4, N2O), biogeochemical, and soil fertility perspective is well established.
- Burrows, S.N., Gower, S.T., Norman, J.M., Diak, G., Mackay, D.S., Ahl, D.E., Clayton, M.K., 2003. Spatial variability of aboveground net primary production for a forested landscape in northern Wisconsin. Canadian Journal of Forest Research 33, 2007-2018.
- Klopatek, J.M., Stearns, F.W., 1978. Primary Productivity of Emergent Macrophytes in a Wisconsin Freshwater Marsh Ecosystem. American Midland Naturalist 100, 320-332.
- Scheiner, S.M., Jones, S., 2002. Diversity, productivity and scale in Wisconsin vegetation. Evolutionary Ecology Research 4, 1097-1117.
Thanks to Jim Lacy at the Wisconsin Sate Cartographer’s Office, University of Wisconsin-Madison.