Pennsylvania Data Discrepancies
By Matt Kelso, Manager of Data & Technology
The Pennsylvania Department of Environmental Protection (PADEP) publishes oil and gas well data in two different places: on their own website’s Spud Data Report, and in the Oil and Gas Locations file published on the PA Spatial Data Access repository, also known as PASDA. Because these two sources are both ultimately published by PADEP, it would stand to reason that the data sources would match up. Unfortunately, that is not the case. Learn more about the data discrepancies we uncovered:
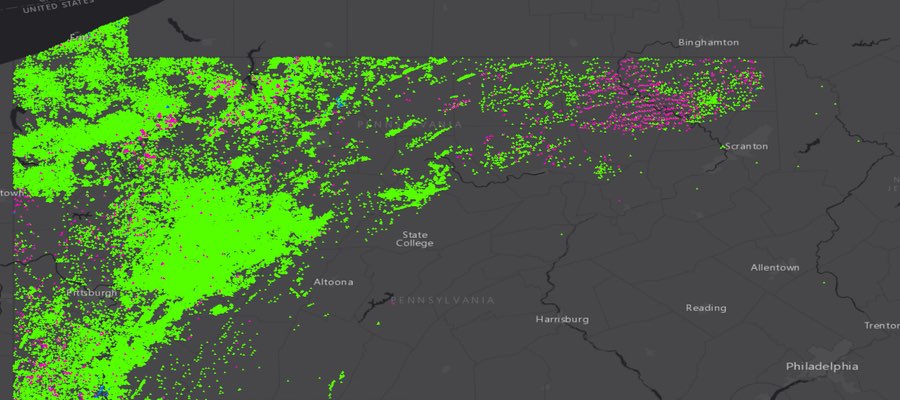
This map shows those wells in Pennsylvania that only show up on one of the two data sources. Pink dots show wells that appear on PASDA but not the PADEP site, while the reverse is true for blue wells. Click here for the full screen view with additional map tools.
Methodology
Both of these data sources have existed for years. When FracTracker does analyses of PA, we usually use data directly from the PADEP site, because it includes far more information about the wells, such as the spud date, county, municipality, well configuration, and whether or not the well is classified as unconventional. Even though it has less information about each well, the data on PASDA is useful for expediently mapping the inventory of wells in the Keystone State. In this current analysis, we looked at both sources, and found significant discrepancies between the two.
Individual oil and gas wells have been given unique API numbers since the 1950’s. The overwhelming majority of items on both lists that we examined have these numbers, and those that do not have other numeric identifiers in their place. The uniqueness of the data in these columns is what we used to determine the number of wells on both lists. These columns in both data sources were then tested against one another using Microsoft Excel in order to determine which wells were included on both lists.
The data on PASDA is described as “Oil and Gas Locations,” and nothing in available metadata made it clear as to whether wells that were permitted but not yet drilled might be included in this or not. Additionally, we are mostly interested in wells that are still operational, assuming that there might be accuracy issues for historical wells in an industry that has been operational in the state since before the Civil War. We did, however, include orphaned and abandoned wells, as they remain a source of impact throughout the state.
Summary
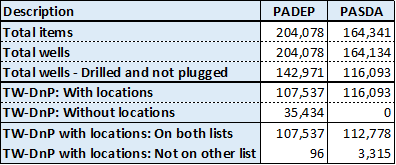
Number of wells in PA in various categories. For brevity, “Total wells – Drilled and not plugged” is shown as “TW-DnP.”
We found 3,315 records of drilled, unplugged wells with location information on the PASDA dataset that are not on the PADEP search tool, and 96 such wells on the PADEP site that aren’t found on PASDA. Additionally, there are 35,434 drilled and unplugged wells in the PADEP data that lack location data, although six of these wells are actually on the PASDA site, meaning that there is some location data for them somewhere at PADEP.
For those of you who might be looking for discrepancies in our discrepancy table, one might expect the number of both wells that appear on both lists (the second to last row on the chart) to be identical. The biggest reason that they are not is that some wells appear in the PASDA dataset multiple times. There are 6,997 fewer unique wells than there are entries on the full file, or a 95.74% match rate. In comparison, the PADEP spud report only has 19 duplicates for over 204,000 wells, a 99.99% match between the number of wells and the number of records. Indeed, when we filter for unique wells, the difference between the two lists shrinks to only 40 records, which might be explained by differences is well statuses that were used to shape our analysis.
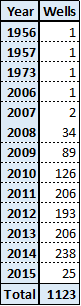
Number of wells drilled per year in Susquehanna Co., through 2/11/15.
Undoubtedly, it will take some effort to get the two datasets to reflect the full set of wells in PA, but that is certainly a task than can be accomplished. The wells lacking location data are likely to be much more of a challenge. If we include all status types, there are 75,508 wells on the spud report that lack latitude and longitude values altogether, leaving us with only the county and municipality to determine where these wells are located. Hopefully, this crucial data exists somewhere in the PADEP inventory, and these wells are not in fact lost.
Finally, there are a couple of things to note about dates. Since the PASDA dataset does not include spud dates, it is impossible to determine the age of the majority of the mismatched wells. Looking at the pink dots on the interactive map above, though, it is clear that a large number of these mismatched PASDA wells are in the northeastern corner of the state that has been booming since the recent development of the Marcellus, but saw little to no development before that time – at least according to the spud report.
Of the 96 wells that are on the spud report but not PASDA, 67 are given the date “1/1/1800,” which seems to be a default date; over 94,000 wells on the report have this listed as the spud date. Most of the other wells that don’t match are relatively old wells, with spud dates ranging between 1960 and 1984. One of these wells was drilled on May 6, 1999 though, and four more were drilled on August 19, 2014.
The mismatched data can be accessed here for those who are interested.