Sea otters, an endangered keystone species, are at risk due to offshore oil and gas drilling spills. Along the west coast of the U.S., this marine mammal’s habitat is commonly near offshore drilling sites, specifically in California and Alaska.
Sea Otters – a Keystone Species
Sea otter numbers used to range from several hundred thousand to more than a million. Today, there are estimated to be just over 106,000 in existence worldwide, with fewer than 3,000 living in California. Their habitats range from Canada, Russia, Japan, California and Washington, but the majority of all wild sea otters are found in Alaskan waters.
Sea otters play a significant role in their local environments, and a much greater ecosystem role than any other species in their habitat area. Sea otters are predators, critical to maintaining the balance of the near-shore kelp ecosystems, and are referred to as keystone species. Without this balancing act, coastal kelp forests in California would be devoured by other aquatic life. Sea otter predation helps to ensure that the kelp community continues to provide cover and food for many of the marine animals. Additionally, kelp plays a tremendous role in capturing carbon in the coastal ecosystems. In that sense, sea otters also inadvertently help to reduce levels of atmospheric carbon dioxide.
Oil Spills and their Health Implications
Recently, Alaska and California, home to a wide variety of marine life, have been popular areas for offshore oil and gas drilling, which may include the use of fracking to extract hydrocarbons. Oil spills are a great concern for the sea otter; unlike other marine animals that may be able to eventually rid themselves of the oil, contact with the oil causes the sea otters fur to mat, preventing insulation, which can lead to hypothermia. Additionally, the ingestion of toxic oil chemicals while cleansing their fur can cause liver and kidney failure, as well as severe damage to their lungs and eyes.
Because their numbers are low and their geographic location area is rather small compared to other sea otter populations, the California sea otter is especially vulnerable, and could be devastated by oil contamination.
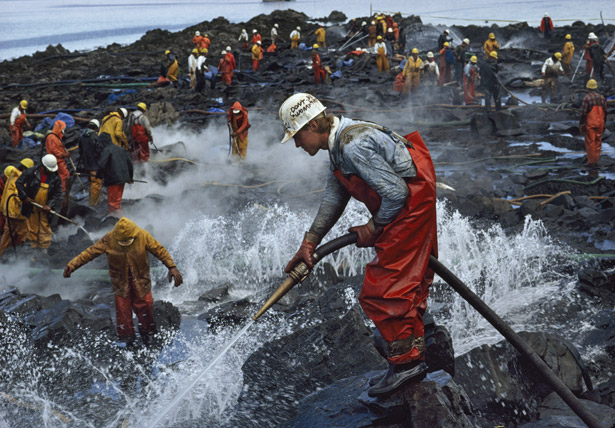
Prince William Sound, Alaska
Exxon Valdez cleanup. Photograph by Natalie Fobes, National Geographic
On March 24, 1989, the tanker vessel Exxon Valdez ran aground on Bligh Reef in Prince William Sound, Alaska, spilling an estimated 42 million liters of Prudhoe Bay crude oil. This incident affected marine life throughout western Prince William Sound, the Gulf of Alaska, and lower Cook Inlet. An estimated 3500–5500 otters from a total population of about 30,000 may have died as a direct result of the oil spill. Oiling and ingestion of oil-contaminated shellfish may have affected reproduction and caused a variety of long-term sublethal effects. Necropsies of sea otter carcasses indicated that most deaths of sea otters were attributed to the oil, and pathologic and histologic changes were associated with oil exposure in the lung, liver, and kidney. Studies of long-term effects indicate that the sea otter population in the Prince William Sound area suffered from chronic effects of oil exposure at least through 1991. While some populations may recover after a spill, it would seem that the threat of oil pollution impacts is intensified for populations in deteriorating habitats and to those that are in decline.
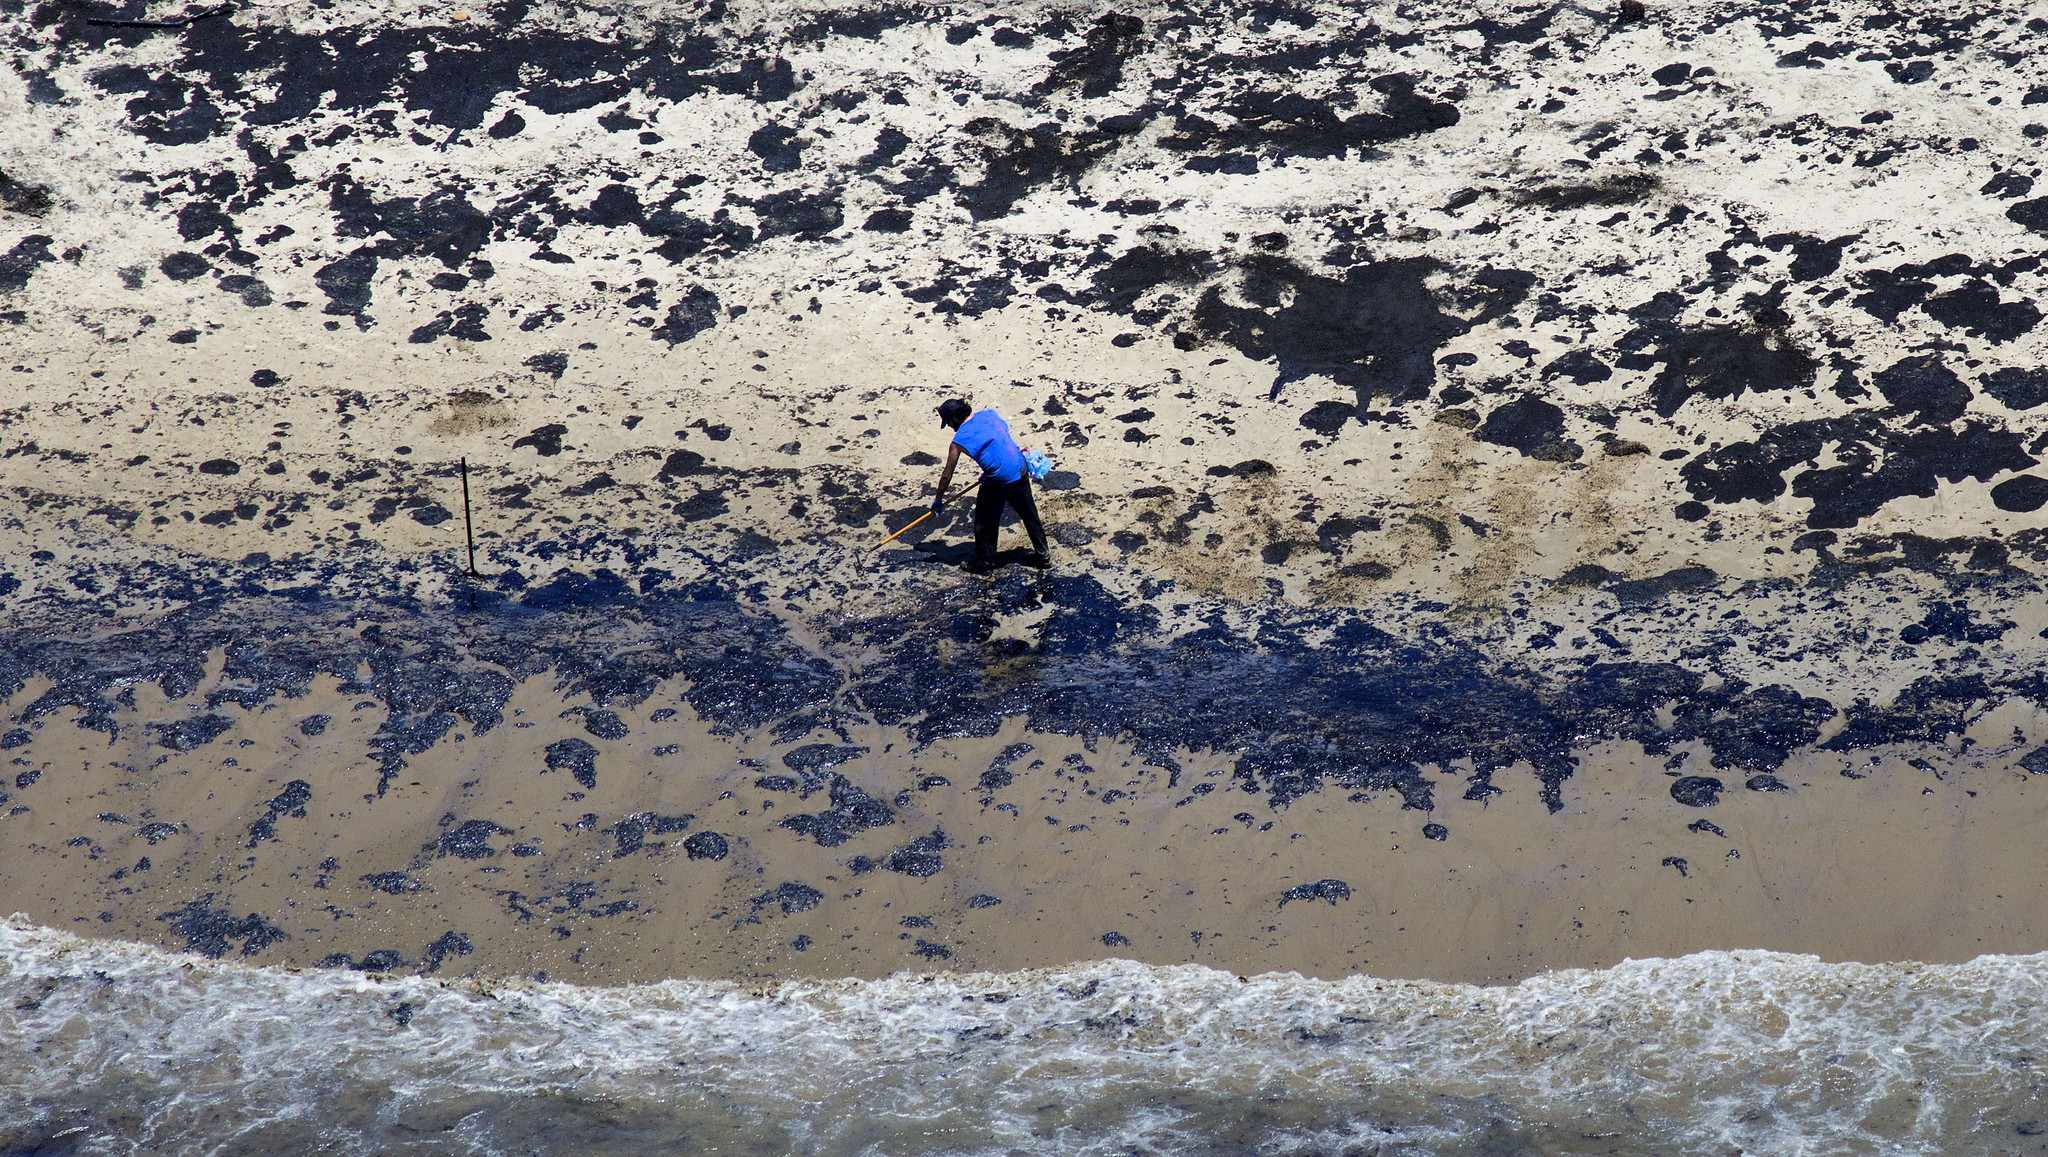
Santa Barbara Coast, California
LA Santa Barbara Oil Spill Cleanup – Photo by: Brian van der Brug / Los Angeles Times
On Tuesday, May 19, 2015, a pipeline was found to be leaking into the Santa Barbara Coast in California. This broken pipeline, owned by Plains All American, spilled approximately 105,000 gallons of crude oil into the ocean, according to various news reports, stretching out into a 4-mile radius along the central California coastline.
These waters are home to an array of shore birds, seals, sea lions, otters and whales. Numerous amounts of marine life have been found washed up on the shore, including crabs, octopuses, fish, birds, and dolphins. Elephant seals, sea lions, and other marine wildlife have been taken to Seaworld in San Diego for treatment and recovery.
The Santa Barbara accident occurred on the same stretch of coastline as spill in 1969 that – at the time – was the largest ever incident in U.S. waters and contributed to the rise of the American environmental movement. Several hundred-thousand gallons spilled from a blowout on an oil platform, and thousands of seabirds were killed and numerous ocean wildlife, including sea lions, elephant seals, and fish perished.
Conclusion
Overall, the ocean is home to a great diversity of marine wildlife, all of which are vulnerable to oil contamination. Offshore gas drilling is a significant threat to the survival of sea otters and other marine life, wherein spills and accidents could cause health problems, toxicity, and even death. Oil spills are exceptionally problematic for sea otters, due to the vulnerable state of this animal and its endangered species state. Keeping keystone species healthy is instrumental to maintaining a well flourished ecosystem, while protecting habitats for a large array of marine and wildlife. The potential impacts on CA sea otters and other marine life due to events such as the 2015 oil spill in California should not be taken lightly.
https://www.fractracker.org/a5ej20sjfwe/wp-content/uploads/2015/06/Otter-Feature.jpg400900FracTracker Alliancehttps://www.fractracker.org/a5ej20sjfwe/wp-content/uploads/2021/04/2021-FracTracker-logo-horizontal.pngFracTracker Alliance2015-06-30 13:00:062025-05-02 14:45:36Offshore Oil and Gas Drilling: Risks to the Sea Otter
A financial crisis seems to have been averted as the price of crude oil is beginning to stabilize – at least for now. One must wonder how such a volatile market affects oil and gas’ Wall Street, private equity, and pension fund followers, however. We have found that many oil and gas (O&G) shares have experienced steep valuation declines in the last few years for companies operating in Ohio.
Share[d] Values
To approach such a broad question, we focused our assessment on Ohio and looked at the share performance of the 17 publicly traded firms operating in the Ohio Utica region since the date of their respective first Utica permits. The Date of First Permit (DFP) ranges between 12/23/2010 for Chesapeake Energy to 3/20/2013 for BP.
Across these 17 companies there are, quite expectedly, winners and losers. On average their shares have experienced 3.75% declines in their valuation or -00.81% per year in the last several years, however. This might be why many of Wall Street and The City’s major banks have limited – or ended – their lines of credit with energy firms from Ohio to the Great Plains. Others are still picking off the highly leveraged losers one by one for pennies on the dollar (Corkery and Eavis, 2015; Staff, 2014). This cutoff of credit and disturbingly high levels of debt/leverage may explain why we found, in a separate analysis, that while cumulative producing oil and gas wells have increased by 349% and 171%, respectively, the rate of permitting needed to maintain and/or incrementally increase these production rates has been 589%.
Cross-Company Comparisons
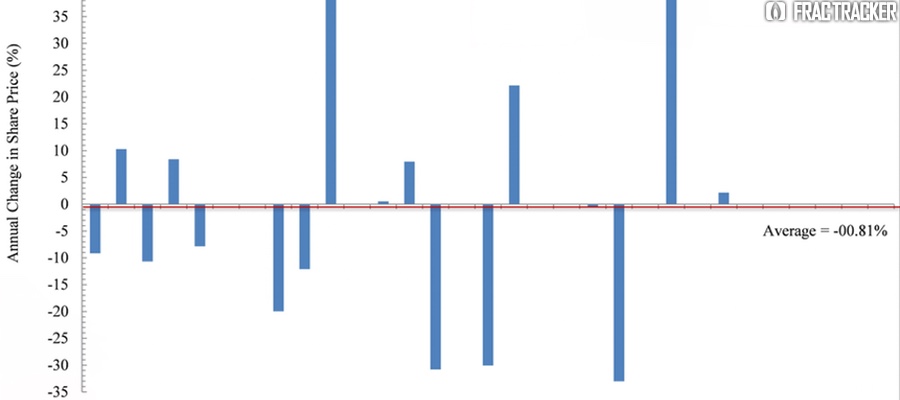
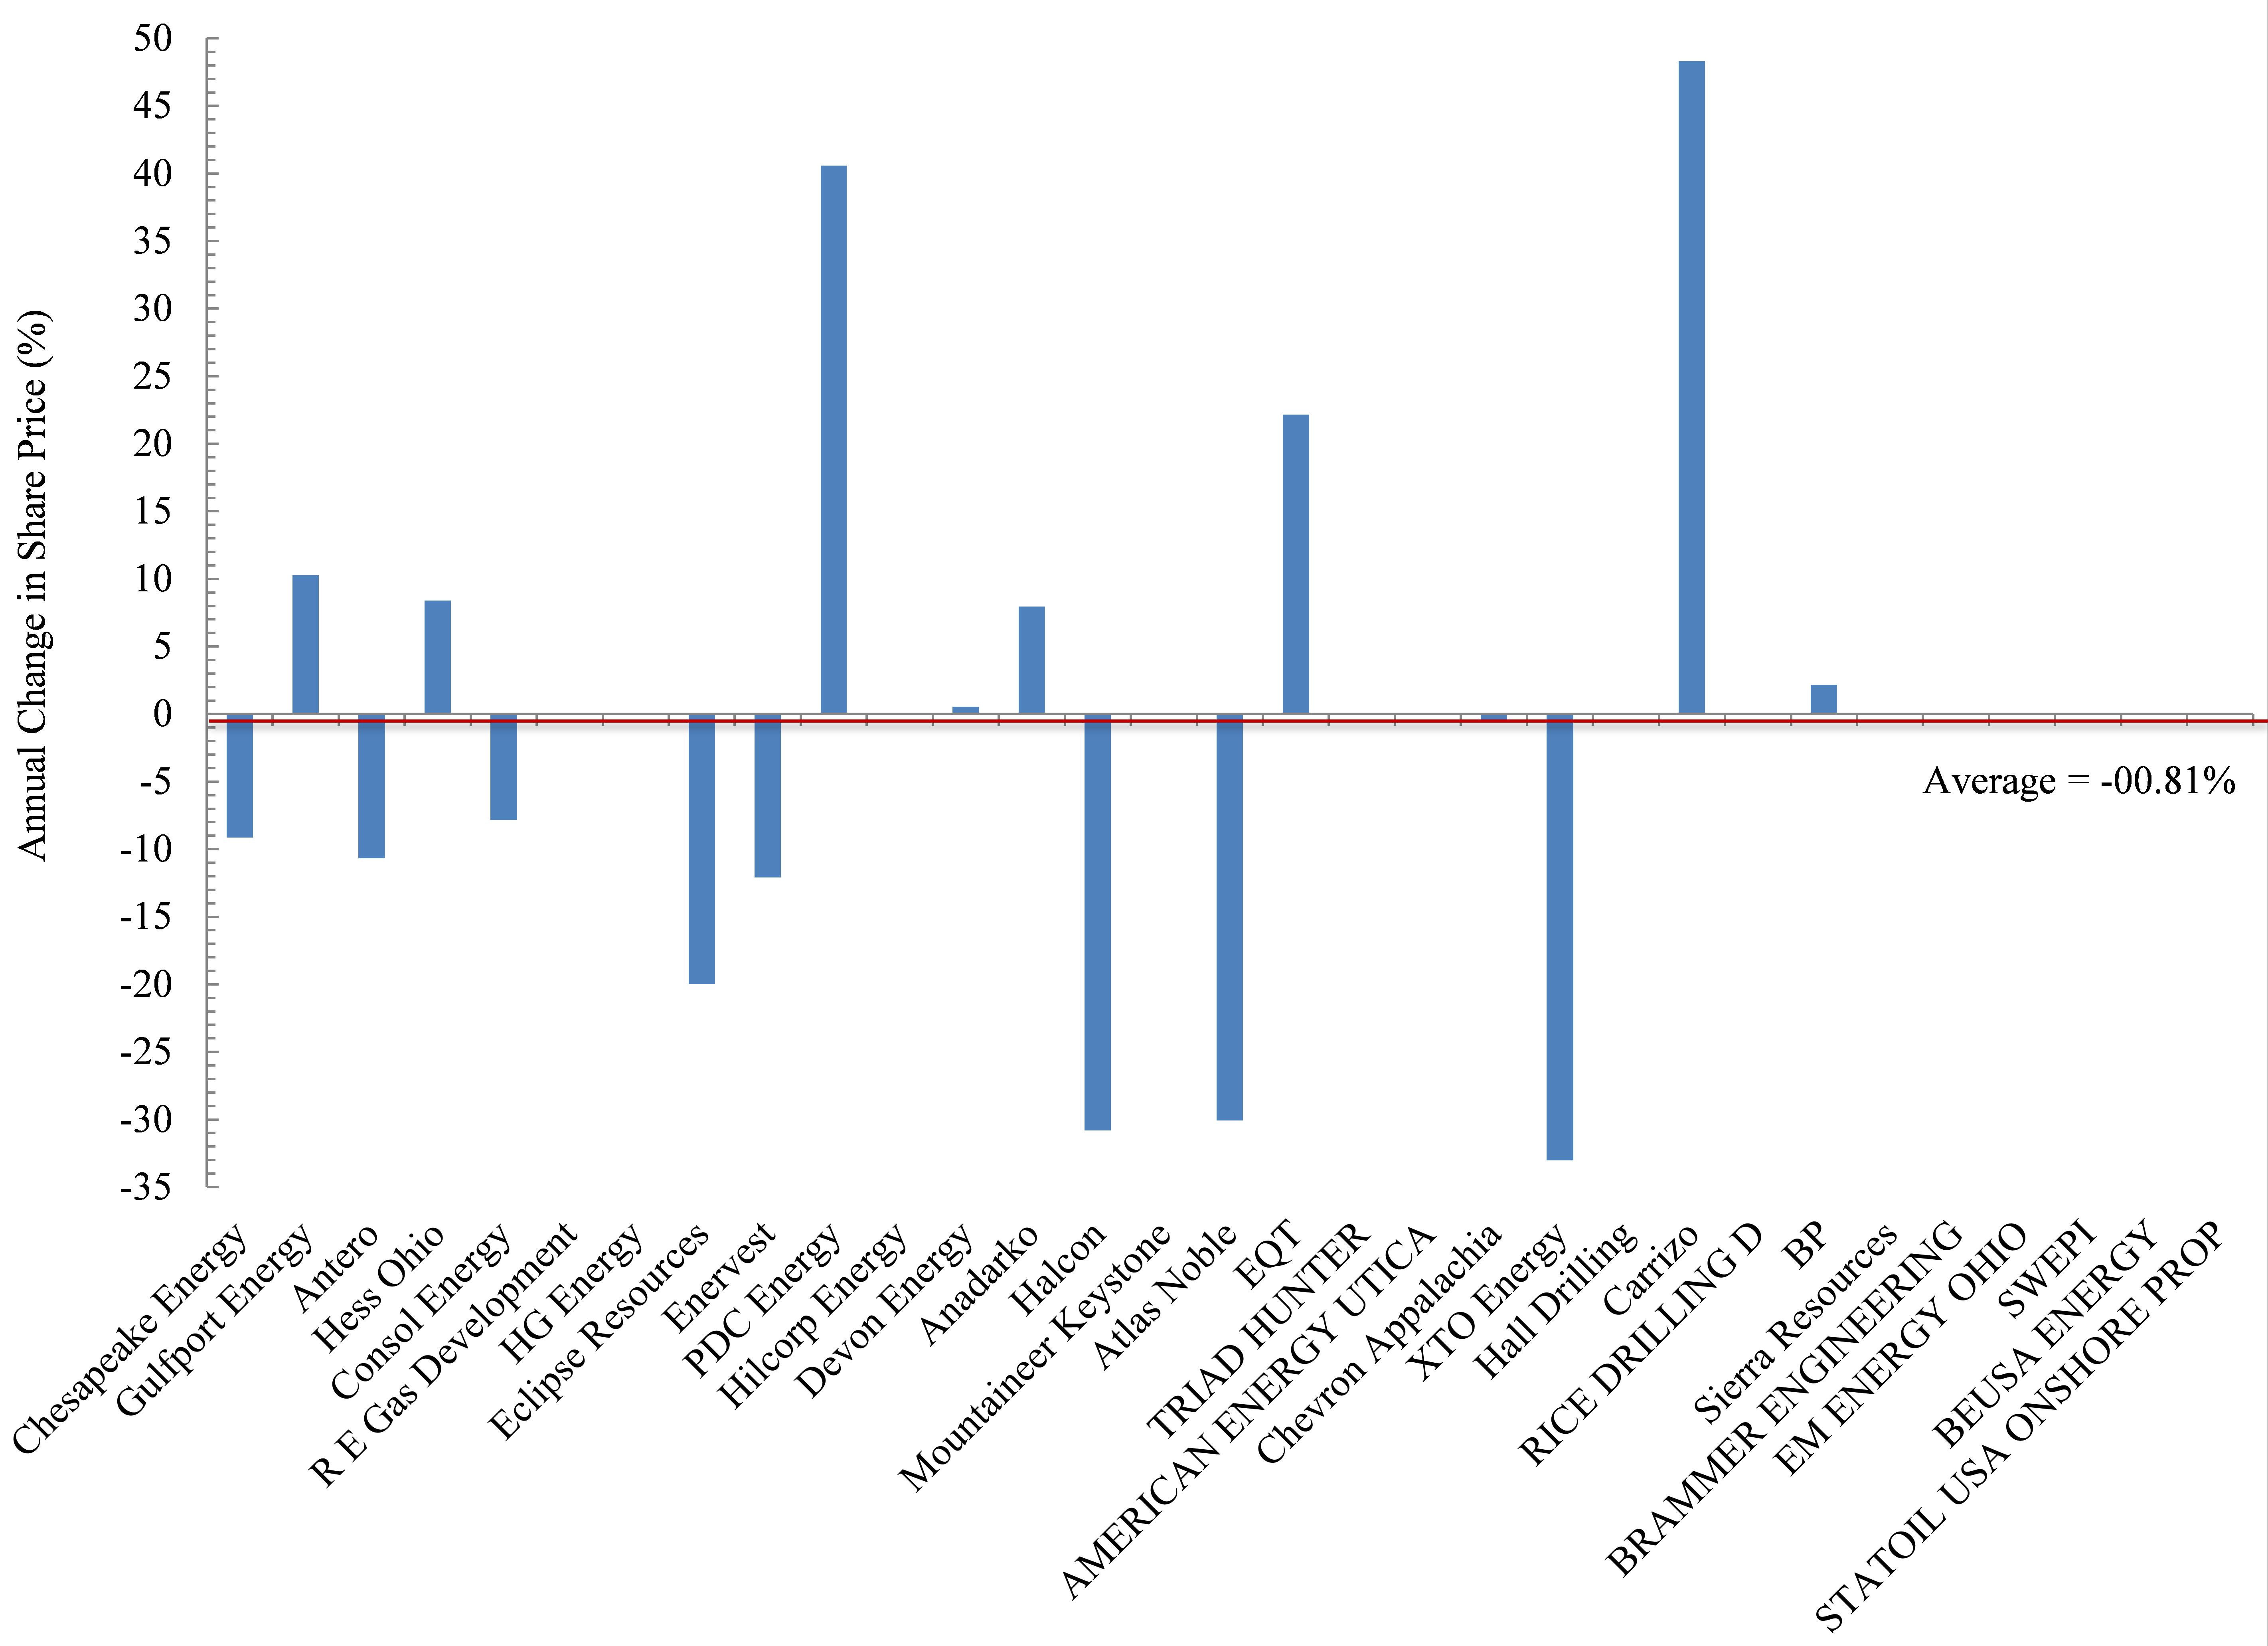
Figure 2. Annual change in share price (%) for 17 publicly traded firms operating in the Ohio Utica shale since their date of first permit
The biggest losers in Ohio’s oil and gas world include Chesapeake Energy. Chesapeake (CHK) is also the largest player in the Buckeye State based on total permits and total producing laterals, accounting for 41% and 55%, respectively. CHK has seen its shares decline on average by 9.1% each year since their DFP (Figure 2). Antero (-10.7% per year), Consol Energy (-7.8%), and Enervest (-12.1%) have experienced similar annual declines, with investors in these firms having seen their position shrink by an average of 37%. Eclipse shares have declined in value by nearly 20% per year, which pales in comparison to the 30-33% annual declines in the share price of Halcon, Atlas Noble, and XTO Energy.
Conversely, the biggest winners are clearly Carrizo (+49% per year), PDC Energy (+41%), and to a lesser degree smaller players like EQT (+22%), Hess Ohio (+8.4%), and Anadarko (+7.9%). Interestingly, the second most active firm operating in Ohio is Gulfport Energy, and their performance has been somewhere in the middle – with annual returns of 10.3%.
Out of State – The Bigger Picture
But before the big winners light up celebratory cigars, it is worth putting their performance into perspective relative to the rest of the field as it were. In an effort to be as fair as possible we chose the Dow Jones Industrial Average and S&P 500 – two indices that everyone has heard of because they are viewed as broad indicators of US economic growth. Incidentally, the DJIA includes the O&G companies Exon and Chevron. Exon is a multinational firm not involved in Ohio’s Utica development, while Chevron is involved. Additionally, the S&P 500 includes those two firms, as well as 39 other energy firms. Nine of those currently operate in Ohio. To assess these companies’ performance with the most energy-centric indices we have compared Ohio Utica players to the S&P 500’s Energy Index, which strips away all other components of its more famous metric, as well as the Vanguard Energy Index Fund. The latter is described by Vanguard as the following on the Mutual Funds portion of its website:
This low-cost index fund offers exposure to the energy sector of the U.S. equity market, which includes stocks of companies involved in the exploration and production of energy products such as oil, and natural gas. The fund’s main risk is its narrow scope—it invests solely in energy stocks. An investor should expect high volatility from the fund, which should be considered only as a small portion of an already well-diversified portfolio.
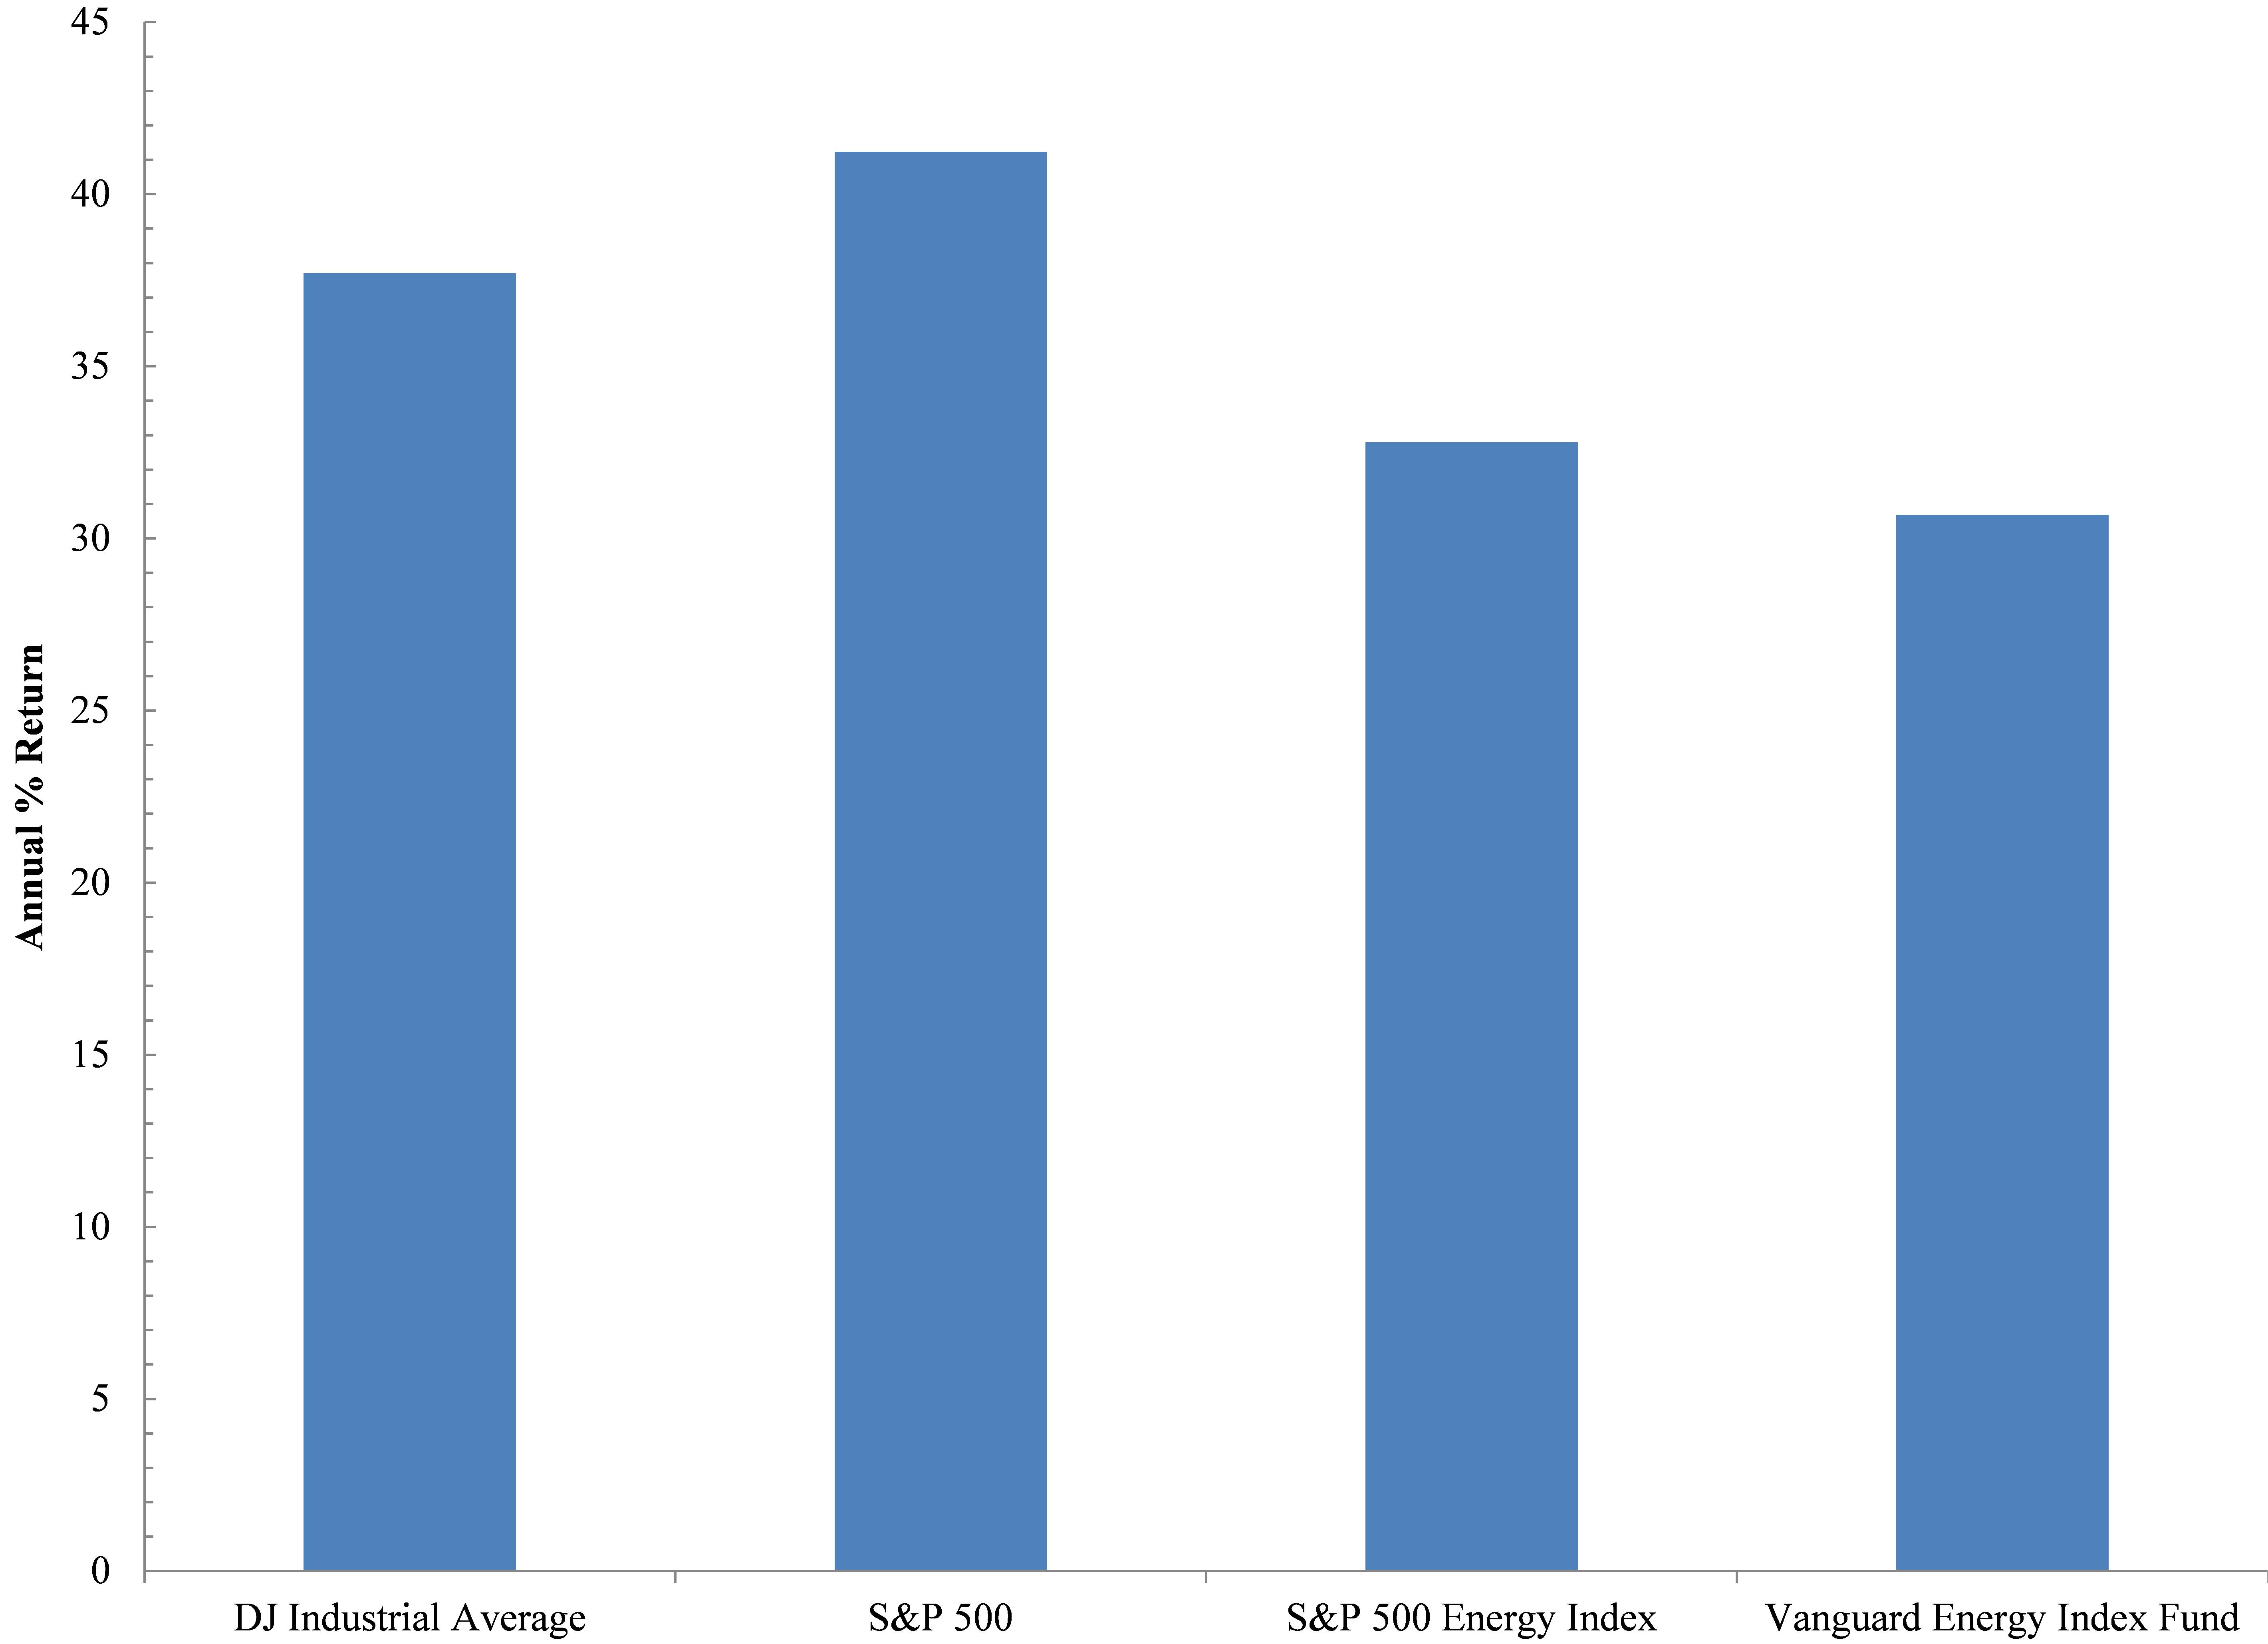
In reviewing these four indices we found that they have outperformed the 17 oil and gas firms here in Ohio or the Ohio Energy Complex (OEC), with annual rates of return (ROR) exceeding 35% (Figure 3). This ROR value was not approached or exceeded by any of the 17 OEC firms except for PDC Energy and Carrizo. However, these two companies only account for 2.8% of all Utica permits and 4.4% of all producing Utica laterals to date. Even if we remove the broader indicators of economic growth and just focus on the two energy indices we see the US energy space ROR has experienced annual growth rates of 33% or 7% below the broader US economy but impressive nonetheless. With such growth in the number of companies drilling for oil and gas, it is likely that we will see significant consolidation soon; some of the world’s largest multinationals like Exxon and Total may step in when all of the above are priced to perfection, which is something Exxon’s Chariman and CEO, Rex Tillerson, eluded to in a speech in Cleveland last June.
Figure 3. Annual % Return of Two Broad Economic and Two Energy Specific Indices.
The performance of the OEC indicates investors and/or lenders will not tolerate such a performance for much longer. Just like our country’s Too-Big-To-Fail banks, boards, CEOs, and shareholders were bailed out, it seems as though a similar bubble is percolating in the O&G world; the same untouchables will be protected by way of explicit or implicit taxpayer bailouts. Will Ohioans be made whole, too, or will they be left to pick up the pieces after yet another natural resource bubble bursts?
References
Corkery, M., Eavis, P., 2015. Slump in Oil Prices Brings Pressure, and Investment Opportunity, The New York Times, New York, NY.
Staff, 2014. Shale oil in a Bind: Will falling oil prices curb America’s shale boom?, The Economist, London, UK.
https://www.fractracker.org/a5ej20sjfwe/wp-content/uploads/2015/05/Shareholder-Feature.jpg400900Ted Auch, PhDhttps://www.fractracker.org/a5ej20sjfwe/wp-content/uploads/2021/04/2021-FracTracker-logo-horizontal.pngTed Auch, PhD2015-06-24 10:00:432020-07-21 10:30:04Ohio’s Shale Oil and Gas Firms Disappoint Shareholders
In Pennsylvania, the vast majority of unconventional oil and gas activity is focused on the Marcellus Shale formation, a Devonian period deposit of black shale with a high hydrocarbon content, which requires horizontal drilling and large scale hydraulic fracturing to produce enough oil and gas to make the drilling economically viable. This formation was created about 390 million years ago, when organic-rich deposits accumulated in what is now the Appalachian Mountains, but was at that time a shallow sea. Down below the base of the Marcellus lies the Utica Shale, an Ordovician period formation, with almost the same geographic extent as the Marcellus, but the deposits were placed there about 65 million years earlier.
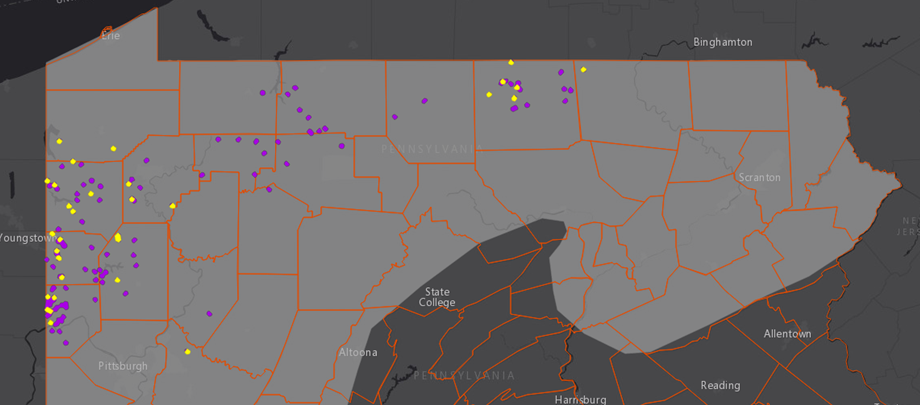
Utica permits and violations in Pennsylvania. Click here to access the legend and other map tools.
In neighboring Ohio, it is the Utica that gets most of the attention, with 937 permitted wells, as opposed to just 20 for the Marcellus. In Pennsylvania, the reverse is true: there are 16,110 permitted Marcellus wells, but only 279 permits for Utica wells. Part of the reason for this is because the subsurface characteristics of these formations vary widely, especially in terms of thickness and depth. With changes in depth come changes in temperature and pressure, which are key criteria in hydrocarbon formation. In other words, the same formation that produces considerable quantities of gas and valuable liquid hydrocarbons in eastern Ohio may be economically unviable just a county or two over in western Pennsylvania.
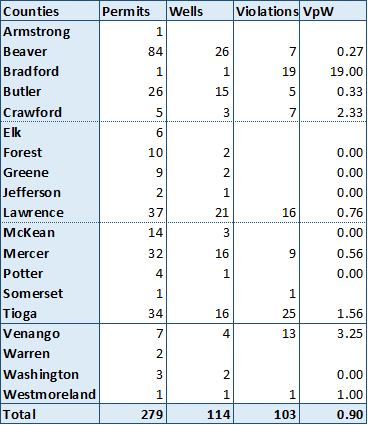
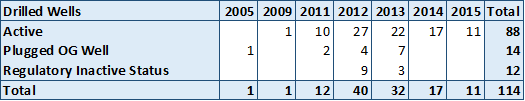
Utica shale permits, drilled wells, violations, and violations per well for Pennsylvania, through June 19, 2015.
Utica drilling permits have been issued in 19 different counties in Pennsylvania, with wells having been drilled in 15 of those. The violations per well (VpW) score for Utica wells in the Keystone State is 0.9, meaning that there are nine violations issued for every 10 wells that have been drilled. It is worth noting, however, that only 36 of the 114 drilled wells have received violations, meaning that some wells have been cited on multiple occasions.
Of particular note is Bradford county, the site of only one Utica well, but 19 items on the compliance report. The problematic Bayles 1 well was run by three different operators before being permanently plugged. This well also has two “Drill Deeper” permits, and as a result, it is likely that the first six violations assessed to this well were issued before it was associated with the Utica Shale, as they precede the most recent spud date for the well in June, 2005. Most of the violations for this well seem to be for pit violations and discharges to the ground and nearby stream.
Wells drilled into the Utica Formation in Pennsylvania, by year and current status.
In terms of drilling activity, it appears to have peaked in 2012, calling into question whether the industry considers the formation to be economically viable in Pennsylvania. Of the 28 wells drilled since the beginning of 2014, Tioga County has seen the most activity with 11 wells drilled, followed by five wells in Butler County, then three in Lawrence County. If we think of drilling activity as a sort of positive feedback from the industry – meaning that they like what they see and want to keep exploring – then only Tioga County seems to be holding the attention of the various operators who have been active in the Utica Shale. Given the Utica activity in Ohio, one might have thought that counties on the western edge of the state – especially Beaver, Lawrence, and Mercer – would have shown the most promise, but this appears not to be the case.
https://www.fractracker.org/a5ej20sjfwe/wp-content/uploads/2015/06/PA_Utica-crop.png405920Matt Kelso, BAhttps://www.fractracker.org/a5ej20sjfwe/wp-content/uploads/2021/04/2021-FracTracker-logo-horizontal.pngMatt Kelso, BA2015-06-23 14:52:012020-07-21 10:30:04Utica Drilling in Pennsylvania
Technologically-enhanced, naturally-occurring radioactive materials, also known as TENORM, are produced when radionuclides deep in the earth are brought to the surface by human activity such as oil and gas drilling. The radioactive materials, which include uranium (U), thorium (th), potassium-40 (K-40) and their decay products, occur naturally in the environment. These materials are known to dissolve in produced water, or brine, from the hydraulic fracturing process (e.g. fracking), can be found in drilling muds, and can accumulate in drilling equipment over time.
Bringing more of this TENORM to the surface has the potential to greatly impact public health and the environment. Since 2013, the Pennsylvania Department of Environmental Protection (PA DEP) has been gathering raw data on TENORM associated with oil and gas activity in the state. The study was initiated due to the volume of waste containing high TENORM concentrations in the state’s landfills, something that is largely unregulated at the state and federal level. In January 2015, the PA DEP released a report that outlined their findings and conclusions, including potential exposures, TENORM disposal practices, and possible environmental impacts.
Radioactivity Study Overview
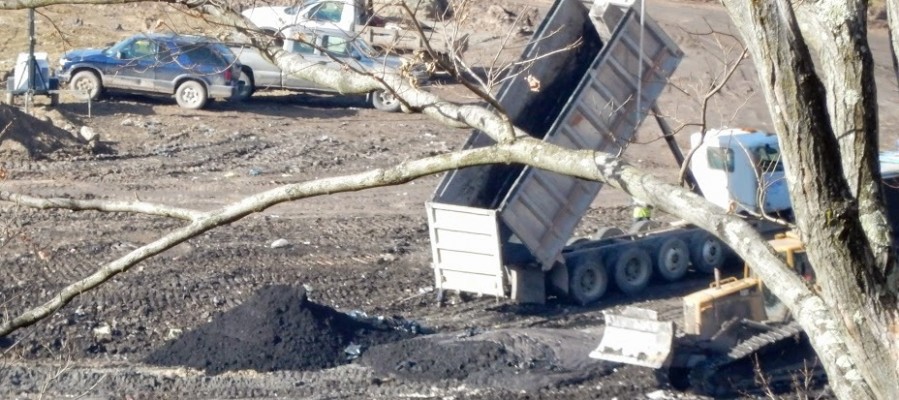
Drilling mud being collected on the well pad
This review touches on the samples tested, the findings, and the conclusions drawn after analysis. The main areas of concern included potential exposure to workers, members of the public, and the environment.
The samples gathered by the DEP came from 38 well sites, conventional and unconventional, by testing solids, liquids, ambient air, soils, and natural gas near oil and gas activity in Pennsylvania. All samples contained TENORM or were in some way impacted by TENORM due to oil and gas operations. The samples were mainly tested for radioactive isotopes, specifically radium, through radiological surveys.
The PA DEP concluded in the cases of well sites, wastewater treatment plants (POTW), centralized wastewater treatment plants, zero liquid discharge plants, landfills, natural gas in underground storage, natural gas fired power plants, compressor stations, natural gas processing plants, radon dosimetry (the calculation and assessment of the radiation dose received by the human body), and oil and gas brine-treated roads that there is little potential for internal radiation exposure to workers and members of the public. In spite of this, each section of the report typically concluded with: however, there is a potentialfor radiological environmental impacts…
Examples of these findings include:
There is little potential for radiological exposure to workers and members of the public from handling and temporary storage of produced water on natural gas well sites. However, there is a potential for radiological environmental impacts from spills of produced water from unconventional natural gas well sites and from spills that could occur from the transportation of this fluid.
There is little potential for radiological exposure to workers and members of the public from sediment-impacted soil at landfills that accepted O&G waste for disposal. However, there may be a radiological environmental impact to soil from the sediments from landfill leachate treatment facilities that treat leachate from landfills that accept O&G waste for disposal.
Radium 226 was detected within the hydraulic fracturing fluid ranging from 64.0-21,000 pCi/L. Radium-228 was also detected ranging from 4.5-1,640 pCi/L. The hydraulic fracturing fluid was made up of a combination of fresh water, produced water, and reuse flowback fluid. There is little potential impact for radiological exposure to workers and members of the public from handling and temporary storage of flowback fluid on natural gas well sites. However, there is a potential for radiological environmental impacts from spills of flowback fluid on natural gas well sites and from spills that could occur from the transport of this fluid.
Nine influent and seven effluent leachate samples were collected at the nine selected landfills. Radium was detected in all of the leachate samples. Radium-226 concentrations were detected in produced water samples ranging from 40.5 – 26,600 pCi/L. Radium-228 concentrations were also detected ranging from 26.0 – 1,900 pCi/L. The Ra-226 activity in unconventional well site produced water is approximately 20 times greater than that observed in conventional well site produced water. The ratio of Ra-226 to Ra-228 in unconventional well site produced water is approximately eight times greater than that found in conventional well site produced water. (Sections 3.3.4 and 3.6.3) (PA DEP TENORM study report section 9.0)
While the report comprehensively covers the processes from drilling to end users, the number of samples collected and analyzed are very sparse for a state-wide study. Just to give an idea, only 8 well sites were sampled during the flowback phase and of the 8 only 4 had enough volume to analyze. Of 14 drill mud samples collected, only 5 were analyzed as liquids, and alpha & beta analysis was only done on one sample.
Obtaining the proper sample size is often a major barrier for field studies. Additional research needs to be conducted with a larger sample size and more rigorous exposure monitoring to determine specific risk metrics for workers and the public.
Current Handling of TENORM
From drilling to distribution, there are many topics of concern associated with TENORM; however, we will focus on the current treatment of TENORM waste, the release of data, and the transparency of this issue.
According to the DEP report, hydraulic fracturing produces an enormous stream of waste by-products. Safe disposal of this waste has not yet been devised. A few of the conclusions concerning TENORM disposal and treatment in the report listed some areas of concern, identified below:
Filter cake[1] and its radiological environmental impact if spilled, and
The amount of radioactive waste entering the landfills in PA, which reached 430,317 tons in the first 10 months of 2014.
In unison with the conclusions were recommendations, where the report “recommends considering limiting radioactive effluent discharge from landfills, and adding radium-226 and radium-228 to annual sample analysis of leachate from landfills.” Additionally, the report states that if something such as filter cake spills, it will bring into question the safety of long-term disposal and suggest a protocol revision.
Public Health Concerns
The report identified two places where there is a higher than average radioactive exposure risk for workers and community members of the public: specifically at centralized wastewater treatment plants and zero liquid discharge plants that treat oil and gas wastewater. An additional unknown is whether there is a potential inhalation or ingestion hazard from fixed alpha and beta surface radioactivity if materials are disturbed. As a general precaution, they recommend the evaluation of worker’s use of protective equipment under certain circumstances.
Although research has not come to a consensus regarding a safe level of radiation exposure, it should not be assumed that any exposure is safe. Past research has evaluated two types of radiation exposure: stochastic and non-stochastic, both of which have their own risks and are known to be harmful to the human body. The EPA has defined stochastic effects as those associated with long-term, low level exposure to radiation, while non-stochastic effects are associated with short-term, high-level exposure. From past scientific research, radiation is known to cause cancer and alter DNA, causing genetic mutations that can occur from both stochastic and non-stochastic exposure. Radiation sickness is also common, which involves nausea, weakness, damage to the central nervous system, and diminished organ function. Exposure levels set by the EPA and other regulatory agencies fall at 100 millirem (mrem) per year to avoid acute health effects. As a point of reference, medical X-rays deliver less than 10 mrem, and yearly background exposure can be about 300 mrem.
In the report, Radiological Dose and Risk Assessment of Landfill Disposal of TENORM in North Dakota, Argonne National Laboratory researchers suggest that the exposure to workers be limited and monitored. In many of their studies, they found the doses exceed the 100 mrem/year level in the workers when the appropriate attire is not worn during working hours, which raised some concern.
The DEP deems certain radiation levels “allowable”, but it should be noted that allowable doses are set by federal agencies and may be arbitrary. Based on the PA DEP’s report, consumers of produced gas can get up to 17.8% of their yearly radiation allowance, while POTW workers could get up to 36.3% of their yearly allowable dose. According to the Nuclear Information and Resource Service, radiation bio-accumulates in ecosystems and in the body, which introduces a serious confounder in understanding the risk posed by a dose of 17.8% per year.
Transparency of Radiation Risk
The DEP has been gathering data for their TENORM report since 2012. In July of 2014, Delaware Riverkeeper Network filed a Right-to Know request to obtain the information that the DEP had collected in order for their expert to analyze the raw data. The department refused to release the information, insisting that “the release of preliminary invalidated data, including sample locations, could likely result in a substantial and demonstrable risk of physical harm, pose a security risk and lead to erroneous and/or misleading characterizations of the levels and effects of the radioactive risks.” Essentially, the DEP was equating the risks of radioactive material to the risks of releasing raw data — two incomparable risks. DRN appealed, claiming that they simply sought the raw information, which is presumed public unless exempt, and would have no risk on the public. PA DEP was ordered to release their records to DRN within 30 days.
Conclusion
One observation that you could take from this report is the lack of regulatory advancement. The study is filled with suggestions, like:
Radium should be added to the PA spill protocol to ensure cleanups are adequately characterized,
A limited potential was found for recreationists on roads with oil and gas brine from conventional natural gas wells–further study should be conducted, and
More testing is needed to identify areas of contamination and any area should be cleaned up.
Intent doesn’t make the changes; action does. Will any regulations change, at least in Pennsylvania where radioactive materials are returning to the surface on a daily basis? There seems to be no urgency when it comes to regulating TENORM and its many issues at the state level. Are workers, citizens, and the environment truly being protected or will we wait for a disaster to spur action?
Footnotes:
[1] This is the residue deposited on a permeable medium when a slurry, such as a drilling fluid, is forced against the medium under pressure. Filtrate is the liquid that passes through the medium, leaving the cake on the medium.
https://www.fractracker.org/a5ej20sjfwe/wp-content/uploads/2015/05/Drill-cuttings-at-landfill-3894-crop-e1432757459333.jpg400899FracTracker Alliancehttps://www.fractracker.org/a5ej20sjfwe/wp-content/uploads/2021/04/2021-FracTracker-logo-horizontal.pngFracTracker Alliance2015-06-16 09:00:402025-05-02 14:45:54Has radioactivity risk from oil and gas activity been underrated?