Approaching 10K Unconventional Wells in PA
By Matt Kelso, Manager of Data & Technology
Each state has its own definition of what it means for an oil or gas well to be “fracked.” In Pennsylvania, these wells are known as “unconventional,” a definition mostly based on the depth of the target formation:
An unconventional gas well is a well that is drilled into an unconventional formation, which is defined as a geologic shale formation below the base of the Elk Sandstone or its geologic equivalent where natural gas generally cannot be produced except by horizontal or vertical well bores stimulated by hydraulic fracturing.
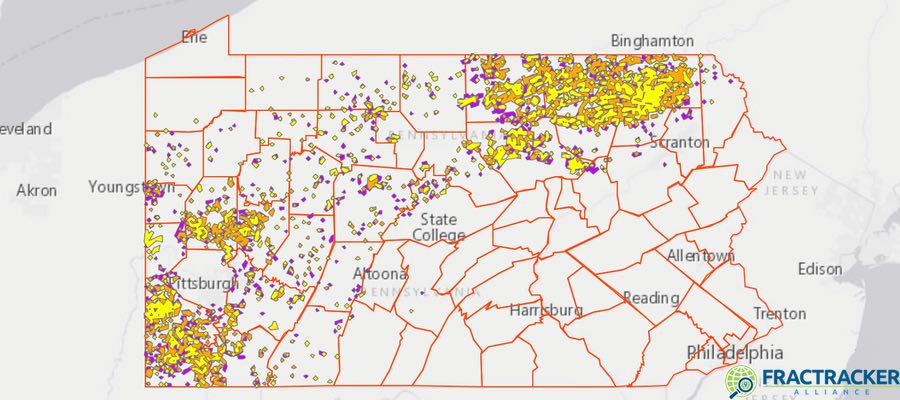
The count of these unconventional wells in PA stands at 9,760 as of June 14, 2016. Their distribution is widespread across the state, but is particularly focused in the northeast and southwest corners of Pennsylvania.
Unconventional oil and gas wells in Pennsylvania:
View map full screen | How FracTracker maps work
Wells Drilled
The industry is not drilling at the same torrid pace as it was between 2010 and 2012, however. The busiest month for drill rigs in the Keystone State was August 2011, with 210 unconventional wells drilled. Last month, there were just 32 such wells.
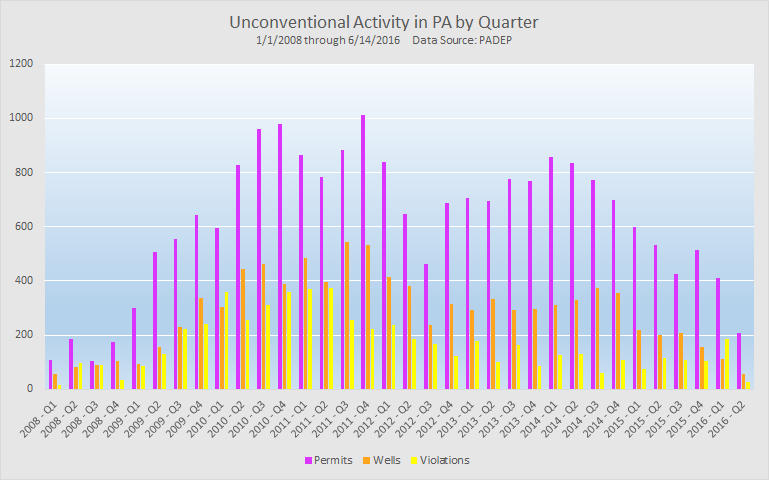
Figure 1. Unconventional oil and gas permits, wells, and violations in Pennsylvania by quarter. Data source: Pennsylvania DEP
Permits
As Figure 1 captures, the number of permits issued per quarter is always greater than the number of wells drilled during the same time period. Even when drilling activity seems to be entering a bust phase, oil and gas operators continue to plan for future development. Altogether, there are 17,492 permitted locations, meaning there are about 7,700 permitted locations where drilling has not yet commenced.
Violations
The number of violations issued by DEP is generally follows the same trends as permits and wells. It is usually the smallest of the three numbers. In the first quarter of 2016, however, is one of a few instances on the chart above where the number of violations issued outpaced wells drilled. There could be any number of reasons for this anomaly; it could have been due to to unusual compliance issued in the field or aggressive regulatory blitzes. It could also be due to some other factor that can’t be determined by the available published data source.
Interestingly, this phenomenon has not occurred since the first quarter of 2010, when the industry was in full swing.
About VpW
One of the best ways to understand the impact of the industry is to look at violations per well (VpW). Unfortunately, there are a number of important caveats to that discussion. First of all, not all items that appear on the compliance report receive their own Violation ID number. It is clear from the DEP workload report that violations are tallied internally by the number of Violation ID numbers. This is as opposed to the number of items on the compliance report. As of June 14, 2016, there were 6,706 rows of data and 5,755 distinct Violation ID numbers that were issued to 2,080 different oil and gas wells. This discrepancy means that about 21% of unconventional wells are issued violations in Pennsylvania. Those that are cited receive an average of 2.8 to 3.2 violations per well, depending on how you count them.
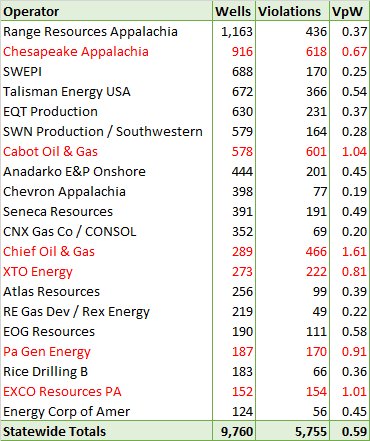
Table 1. Violations per well (VpW) of the 20 companies with the most unconventional wells in PA.
Determining the violations per well by operator comes with additional caveats. The drilled wells data comes from the spud report, which lists the current operator of each of the wells. The compliance report, however, lists the operator that was in charge of the well at the time of the infraction. This poses a problem for analysis, however. The ownership of the wells is quite fluid when taken in aggregate, as companies fold, are bought out, or change their names to something else.
VpW Results
We calculated VpW figures for the 20 operators with the largest inventory of drilled wells wells in Pennsylvania, found in Table 1. In some instances, we were able to reunite operators with violations that were issued under a different name but are in fact the same company. Specifically, we combined Rex Energy’s violations with RE Gas Dev, CONSOL violations with CNX, and Southwestern with SWN Productions, as the company is now known.
SWN’s violation-per-well score appears to be quite low. Their statistic, however, does not take into account wells that it purchased from Chesapeake in 2014, for example. In this transaction, 435 wells changed hands, with an unknown number of those in Pennsylvania. Any violations on these wells that Chesapeake had would stay with that company even as their well count was reduced. Such a change would thereby artificially inflate Chesapeake’s VpW score. On the other hand, SWN is now in possession of a number of wells which might have been problematic during the early stages of operation. Those violations, alternatively, are not associated with SWN, making their inventory of wells appear to be less problematic.
Data Caveats and Takeaways
Alas, we do not live in a world of perfect data. As such, these results must be taken with a grain of salt. Still, we can see that there are some trends that persist among operators that have been active in Pennsylvania for many years. Chief, Cabon, and EXCO, for example, all average more than one violation per well drilled. Chevron, CNX, and RE Gas Development, on the other hand, have much better rates of compliance, on the order of one violation per every five wells drilled.