Trends in California’s Oil and Gas Development
By Kyle Ferrar, Western Program Coordinator
Over 38,000 oil and gas wells have likely been hydraulically fractured in California. The last permitted hydraulic fracturing operation in CA was approved in June 2015. Additionally, new aquifer exemption proposals will make it easier for operators to obtain hydraulic fracturing permits. One of the most interesting and troubling issues we found when analyzing the data on violations is that operators with the highest number of new well permits are also responsible for the majority of violations. In this article, we provide a look at these and other the trends of unconventional drilling in CA.
Updated CA Shale Viewer
First of all, the CA Shale Viewer has been updated! New data has been uploaded into the map about unconventional drilling in California, and new data resources have been used to identify shale gas activity (Fig. 1). Recent reports in CA have exposed what many researchers expected – hydraulic fracturing has been occurring in the state without any oversight or documentation for a long time.
In this presentation of the Updated CA Shale Viewer we showcase an analysis of these new data sources that better describe unconventional drilling in CA. We then look to new well permitting data to see what current spatial trends may mean for future oil and gas development. We also look at a sample of operator violations issued by the state regulatory agency to tell us a bit about who the bad actors may be.
Figure 1. CA Shale Viewer – Location of well stimulation & other unconventional oil & gas activity
View map fullscreen | How FracTracker maps work
Current Fracking Activity
Fracking in California has been put on hold at the moment as a result of low oil prices combined with the new permitting requirements for groundwater monitoring. In 2015, the CA Council on Science and Technology (CCST) released a report on hydraulic fracturing, as required by State Bill 4, proposed by Senator Pavley. The legislation required the Division of Oil, Gas and Geothermal Resources to create regulations for hydraulic fracturing and other stimulation activities such as acidizing. The report highlighted the necessity of protecting California’s groundwater resources. As another requirement of SB4, the state water resources control board adopted Model Criteria for Groundwater Monitoring in areas of Oil and Gas Well Stimulation, which includes three main components:
- Area-specific required groundwater monitoring near stimulation wells by operators
- Requirements for designated contractor sampling and testing
- Regional scale groundwater monitoring to be implemented by the State Water Board
With these requirements in place to protect groundwater, using hydraulic fracturing and other “extreme” high energy input techniques to extract oil is not currently economical in California. Operators have not submitted a permit application for hydraulic fracturing in CA since June 2015.
This status may change in the near future, though, as DOGGR has proposed groundwater monitoring exemptions for 3 large aquifer systems in Kern and Arroyo Grande counties. Such a proposal would mean that operators would not have to monitor for groundwater contamination in these areas when using hydraulic fracturing or other stimulation technologies like acidizing.
Previous Fracking Activity
One outcome of the aforementioned CCST report on hydraulic fracturing was a review of stimulation activity that has occurred in CA but went undocumented. Researchers at Lawrence Berkeley National Laboratory (LBNL) screened thousands of oil and gas well logs and records to calculate the extent to which hydraulic fracturing was actually being used in California’s oil fields. LBNL derived “Well Stimulation Treatment” probabilities based on the number of well records that reported utilizing hydraulic fracturing.
Probabilities were then derived for each pool, which is a geographically isolated formation within an oil field. Using these probabilities, FracTracker calculated a conservative estimate for the number of stimulated wells in the state at over 38,000. There are 228,010 unique Well ID’s listed in the DOGGR database. This puts the proportion of hydraulically fractured wells in California at 16.7% of the total 228,090 wells known.
New Wells
Whereas many other states break down their oil and gas data to show in what phase of development a well may be, CA identifies all wells between the permitted and producing/injecting phase as “new.” In Figure 2 below you can see the wells identified in 2016 as “new.” The DOGGR dataset shows there are currently 6,561 new wells in California as of July 2016. Counts of new well permits were calculated for individual operators and are listed below in Table 1.
Table 1. Top 10 operators according to new well permit counts in California, along with the number of new well permits currently active, the percent those permits represent of total new well permits in the state, and the percentage of violations the operator is responsible in the DOGGR dataset provided to FracTracker Alliance.
| Order | Operator | Permit Count | Permit % | Violations % |
| 1 | Aera Energy LLC | 2012 | 30.67% | 22.34% |
| 2 | Chevron U.S.A. Inc. | 968 | 14.75% | 20.35% |
| 3 | California Resources Production Corporation | 768 | 11.70% | 5.89% |
| 4 | Linn Operating, Inc. | 574 | 8.75% | 12.04% |
| 5 | E & B Natural Resources Management Corporation | 572 | 8.71% | 1% |
| 6 | California Resources Elk Hills, LLC | 374 | 5.70% | 5.52% |
| 7 | Seneca Resources Corporation | 185 | 2.82% | 2.83% |
| 8 | Freeport-McMoRan Oil & Gas LLC | 164 | 2.50% | 15.22% |
| 9 | Vaquero Energy, Inc. | 154 | 2.35% | 0.22% |
| 10 | Macpherson Oil Company | 116 | 1.77% | 2.09% |
There are 68 fields in CA that have added new wells in the new DOGGR dataset published in July 2016. The top 10 fields are listed in Table 2 below.
Table 2. Top 10 Oil Fields by Permit (New Well) Count
| Order | Oil Field | Well Count |
| 1 | Belridge, South | 1518 |
| 2 | Midway-Sunset | 903 |
| 3 | Poso Creek | 553 |
| 4 | Lost Hills | 488 |
| 5 | Cymric | 336 |
| 6 | Kern River | 294 |
| 7 | Elk Hills | 276 |
| 8 | Kern Front | 233 |
| 9 | McKittrick | 186 |
| 10 | Belridge, North | 174 |
In Figure 2 below, the counts of new wells in fields are shown in shades of yellow/red. The fields with the highest number of new wells are located in the Central Valley. The top 10 operators’ wells are also identified. The majority of new well permits are located in the South Belridge oil field, and the majority of those wells are operated by Aera Energy. As can be seen in the map, most new wells are located in fields in Kern county, but Santa Barbara and Fresno, and even Salinas counties have fields with 40 or more new well permits.
Figure 2. New Well Permitting Map of Unconventional Drilling in California
View map fullscreen | How FracTracker maps work
Violations
Who collects violations data?
In most states with heavy oil and gas drilling, data on violations is collected by the state regulatory agency, aggregated in datasets and spreadsheets, and made available to the public. FracTracker has done analyses with such data in the past.
In Pennsylvania for instance, a 2011 look at the data showed us that as the number of inspectors on the ground in the Marcellus Shale fields increases, the number of violations/well actually decrease. This was important information that challenged the cynical hypothesis: that more inspectors mean additional eyes on the ground to identify more violations during inspections. In reality, more inspectors actually mean that operators are held to higher standards, and further best management practices (BMPs) are employed. This trend at least seemed to be the case in Pennsylvania. As a regulatory agency, such knowledge is incredibly important, and even validates increased spending and budgets for more personnel.
In California, the issue of publishing violations data is again met with a similar response from the Division of Oil Gas and Geothermal Resources (DOGGR), specifically the “Oh, is that my job?” question.
How is it shared?
At FracTracker, we spent time working with regulatory officials at DOGGR to get some data on violations. We were informed that at some point in the future, the data may be aggregated and available digitally. Until then, however, a request for the data would have to be made to each of the six district offices individually and would take approximately a year to pull together scanned copies of violations notices in PDF format. Unfortunately, we at FracTracker do not have the capacity to process such files. Instead we asked for anything DOGGR had digitally available, and we were provided with a sample subset of 2,825 violations dating mostly from 2013 and 2014 and only in District 2, the Los Angeles Basin.
What does CA violations data look like?
Looking at the sample of data in Table 2, we see that the majority of violations are caused by the operators that also have the most new well permits. Aera Energy, in particular, is responsible for over 1/5 of all violations in our sample set. Limiting factors and sampling bias of the sample set of violations may impact this analysis, though, as all violations are limited to Los Angeles County. Operators that mostly operate in the Central Valley will be under represented in the violations count. When more violations data becomes available we will be sure to expand this analysis.
Bans and Regulations on Unconventional Drilling in California
Although every state regulatory agency lambasts that they have the most comprehensive and conservative set of oil and gas extraction regulations, California regulators may actually be right. That is, save for New York which has banned hydraulic fracturing outright.
Regardless of the policy decisions made at the state-level, multiple local municipalities in CA have attempted to or succeeded in passing local bans. Six counties have passed outright bans on unconventional drilling in California, as can be seen in the FracTracker Local Actions map below (Fig. 3). Most recently the county of Alameda, home to the cities of Berkeley and Oakland, has passed a ban. The county of Monterey is also considering a ban on all oil and gas extraction, which has been approved as a local ballot initiative for November 2016.
Figure 3. Local Actions, Bans and Regulations Map
View map fullscreen | How FracTracker maps work
As the price of oil rebounds closer to $100/barrel, there will be more interest by operators to increase unconventional drilling in California. The addition of new aquifer exemptions will make it all the more appealing. These local movements are therefore incredibly important to ensure that “extreme” extraction methods like fracking don’t expand in the future.
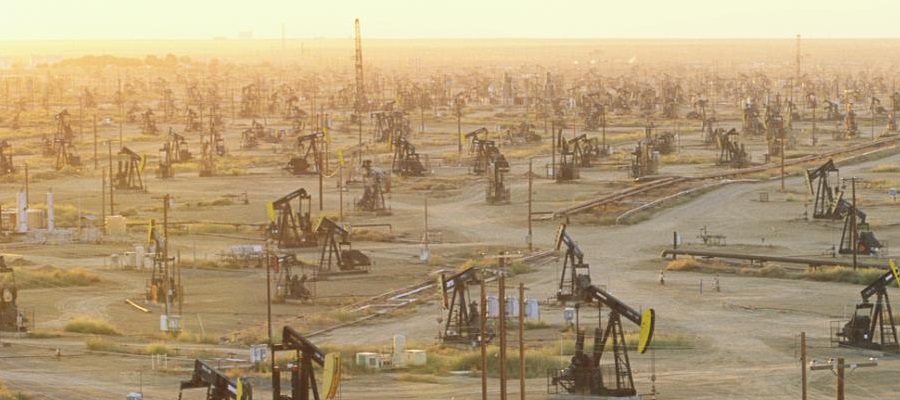
Feature Photo: South Belridge field by Sarah Leen, National Geographic