New York: A Sunshine State!
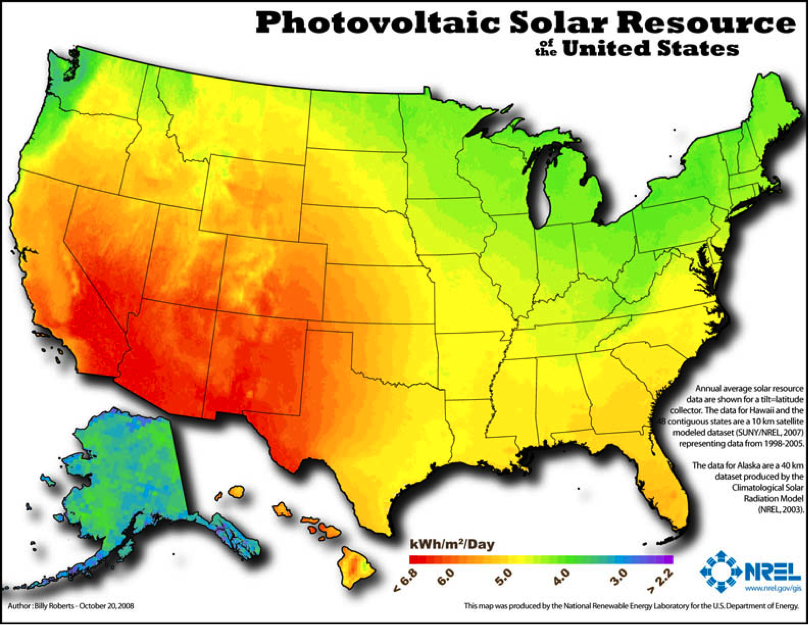
Photovoltaic solar resources of the US (NREL)
It’s difficult to talk about the risks of oil and gas extraction without providing data on energy alternatives in the conversation. Let’s look at New York State, as an example. There, solar power is taking a leadership position in the renewable energy revolution in the United States. Although New York State receives far less sunshine than many states to the west and south, the trends are bright! Currently, New York State ranks seventh in the nation in installed solar capacity, with over 700 MW of power generated by the sun, enough to power 121,000 homes.
Despite common assumptions that solar power only makes sense where the sun shines 360 days a year, we’ve been seeing successful adoption of solar in Europe for years. For example, in Germany, where even the most southern part of the country is further north of the Adirondack Mountains in New York State, close to 7% of all the power used comes from combined residential and commercial scale photovoltaic sources–35.2 TWh in all. Munich, one of the sunniest places in all of Germany, has a lower average solar irradiation rate of 3.1 kWh/m2/day than most cities in New York State; compare it with locations in New York like Rochester (3.7 kWh/m2/day), New York City (4.0 kWh/m2/day), and Albany (3.8 kWh/m2/day). At present, Germany still leads New York State by more than double the electrical output from solar for equivalent areas.
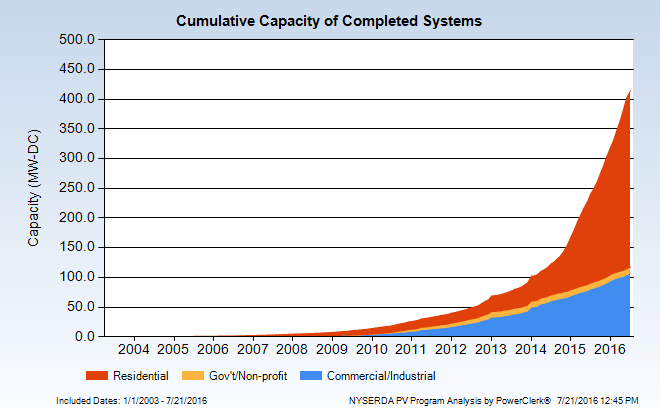
Cumulative Solar Capacity in New York
The cumulative capacity for completed photovoltaic systems in New York State has risen steeply in the past three years, with ground-mounted and roof-top residential capacity outpacing commercial capacity by a wide margin.
Nonetheless, commercial and industrial scale installations in New York account for over 100 MW of power capacity in the state.
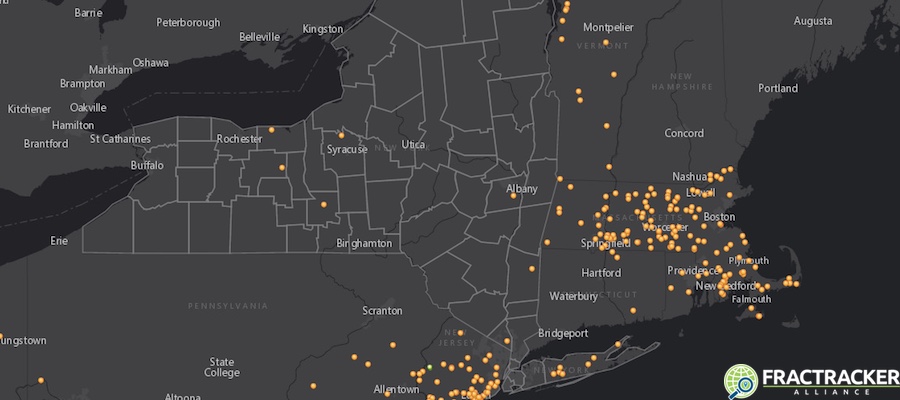
Large-Scale Solar Installations Map
This map shows the location of those large-scale solar installations in the US (zoom out to see full extent of US), as of March 2016. Here is our interactive map:
View map full screen | How FracTracker maps work
In the past fifteen years, the increase in small to medium-sized solar installations in New York State has been significant, and growth is projected to continue. The following animation, based on data from the New York State Energy Research and Development Authority (NYSERDA), shows that increase in capacity (by zip code) since 2000:
Solar Installations by Zip Code
NYSERDA also provides maps that show distributions of residential, governmental/NGO, and commercial solar energy projects (images shown below). For example, Suffolk County leads the way in the residential arena, with nearly 8200 photovoltaic (PV) systems on roofs and in yards, with an average size of 8.3 kW each.


Erie County has 128 PV systems run by governmental and not-for-profit groups, with an average size of about 27 kW each. Albany County has over 320 commercial installations, with an average size each of about 117 kW.
New York State’s Future Solar Contribution
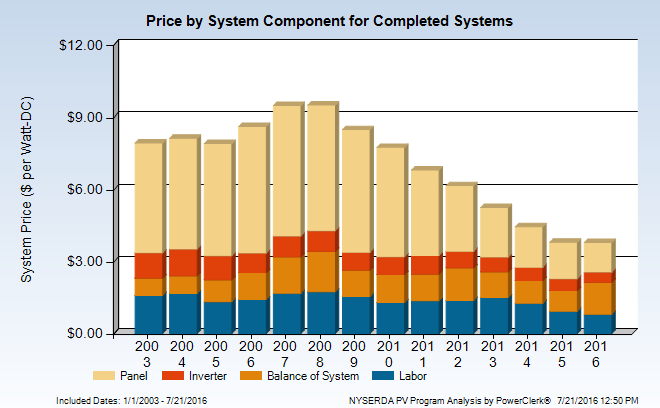
Price of Completed Solar Systems 2003-2016
The prices of solar panels is steeply declining, and is coupled with generous tax incentives. The good news, according to the Solar Energy Industries Association (SEIA), is that over the next five years, New York State’s solar capacity is expected to quadruple its current output, adding over 2900 MW of power. This change would elevate New York State from seventh to fourth place in output in the US.
By Karen Edelstein, Eastern Program Coordinator, FracTracker Alliance