Power Plants & Other Facilities Now on Ohio Oil & Gas Map
Over the last few months we’ve been busy working on some updates to our Ohio Oil & Gas Map. Check out what we’ve added recently and explore the map below!
New: Power Plants & ATEX Pipeline
We now have the locations of eight of the credible natural gas power plants proposed in Ohio, along with the jobs they cite during construction and operations. We also now have a complete inventory of 118 existing power plants, including 25 natural gas facilities. Together, these plants would produce 7,660 megawatts, around 957 per facility.
Six of these plants are either in the heart of Ohio’s Utica Shale or within several miles of the 1,200+ mile Appalachia-to-Texas (ATEX) pipeline. ATEX was installed to transport 190,000 barrels per day (BPD) of natural gas liquids (NGLs) from the Marcellus and Utica region to the Texas and Louisiana Gulf Goast refinery corridor. The 360 mile segment of this pipeline that runs from Pennsylvania to south central Jackson County, Indiana is also now shown on the Ohio Oil & Gas Map.
Late Permitting Increases
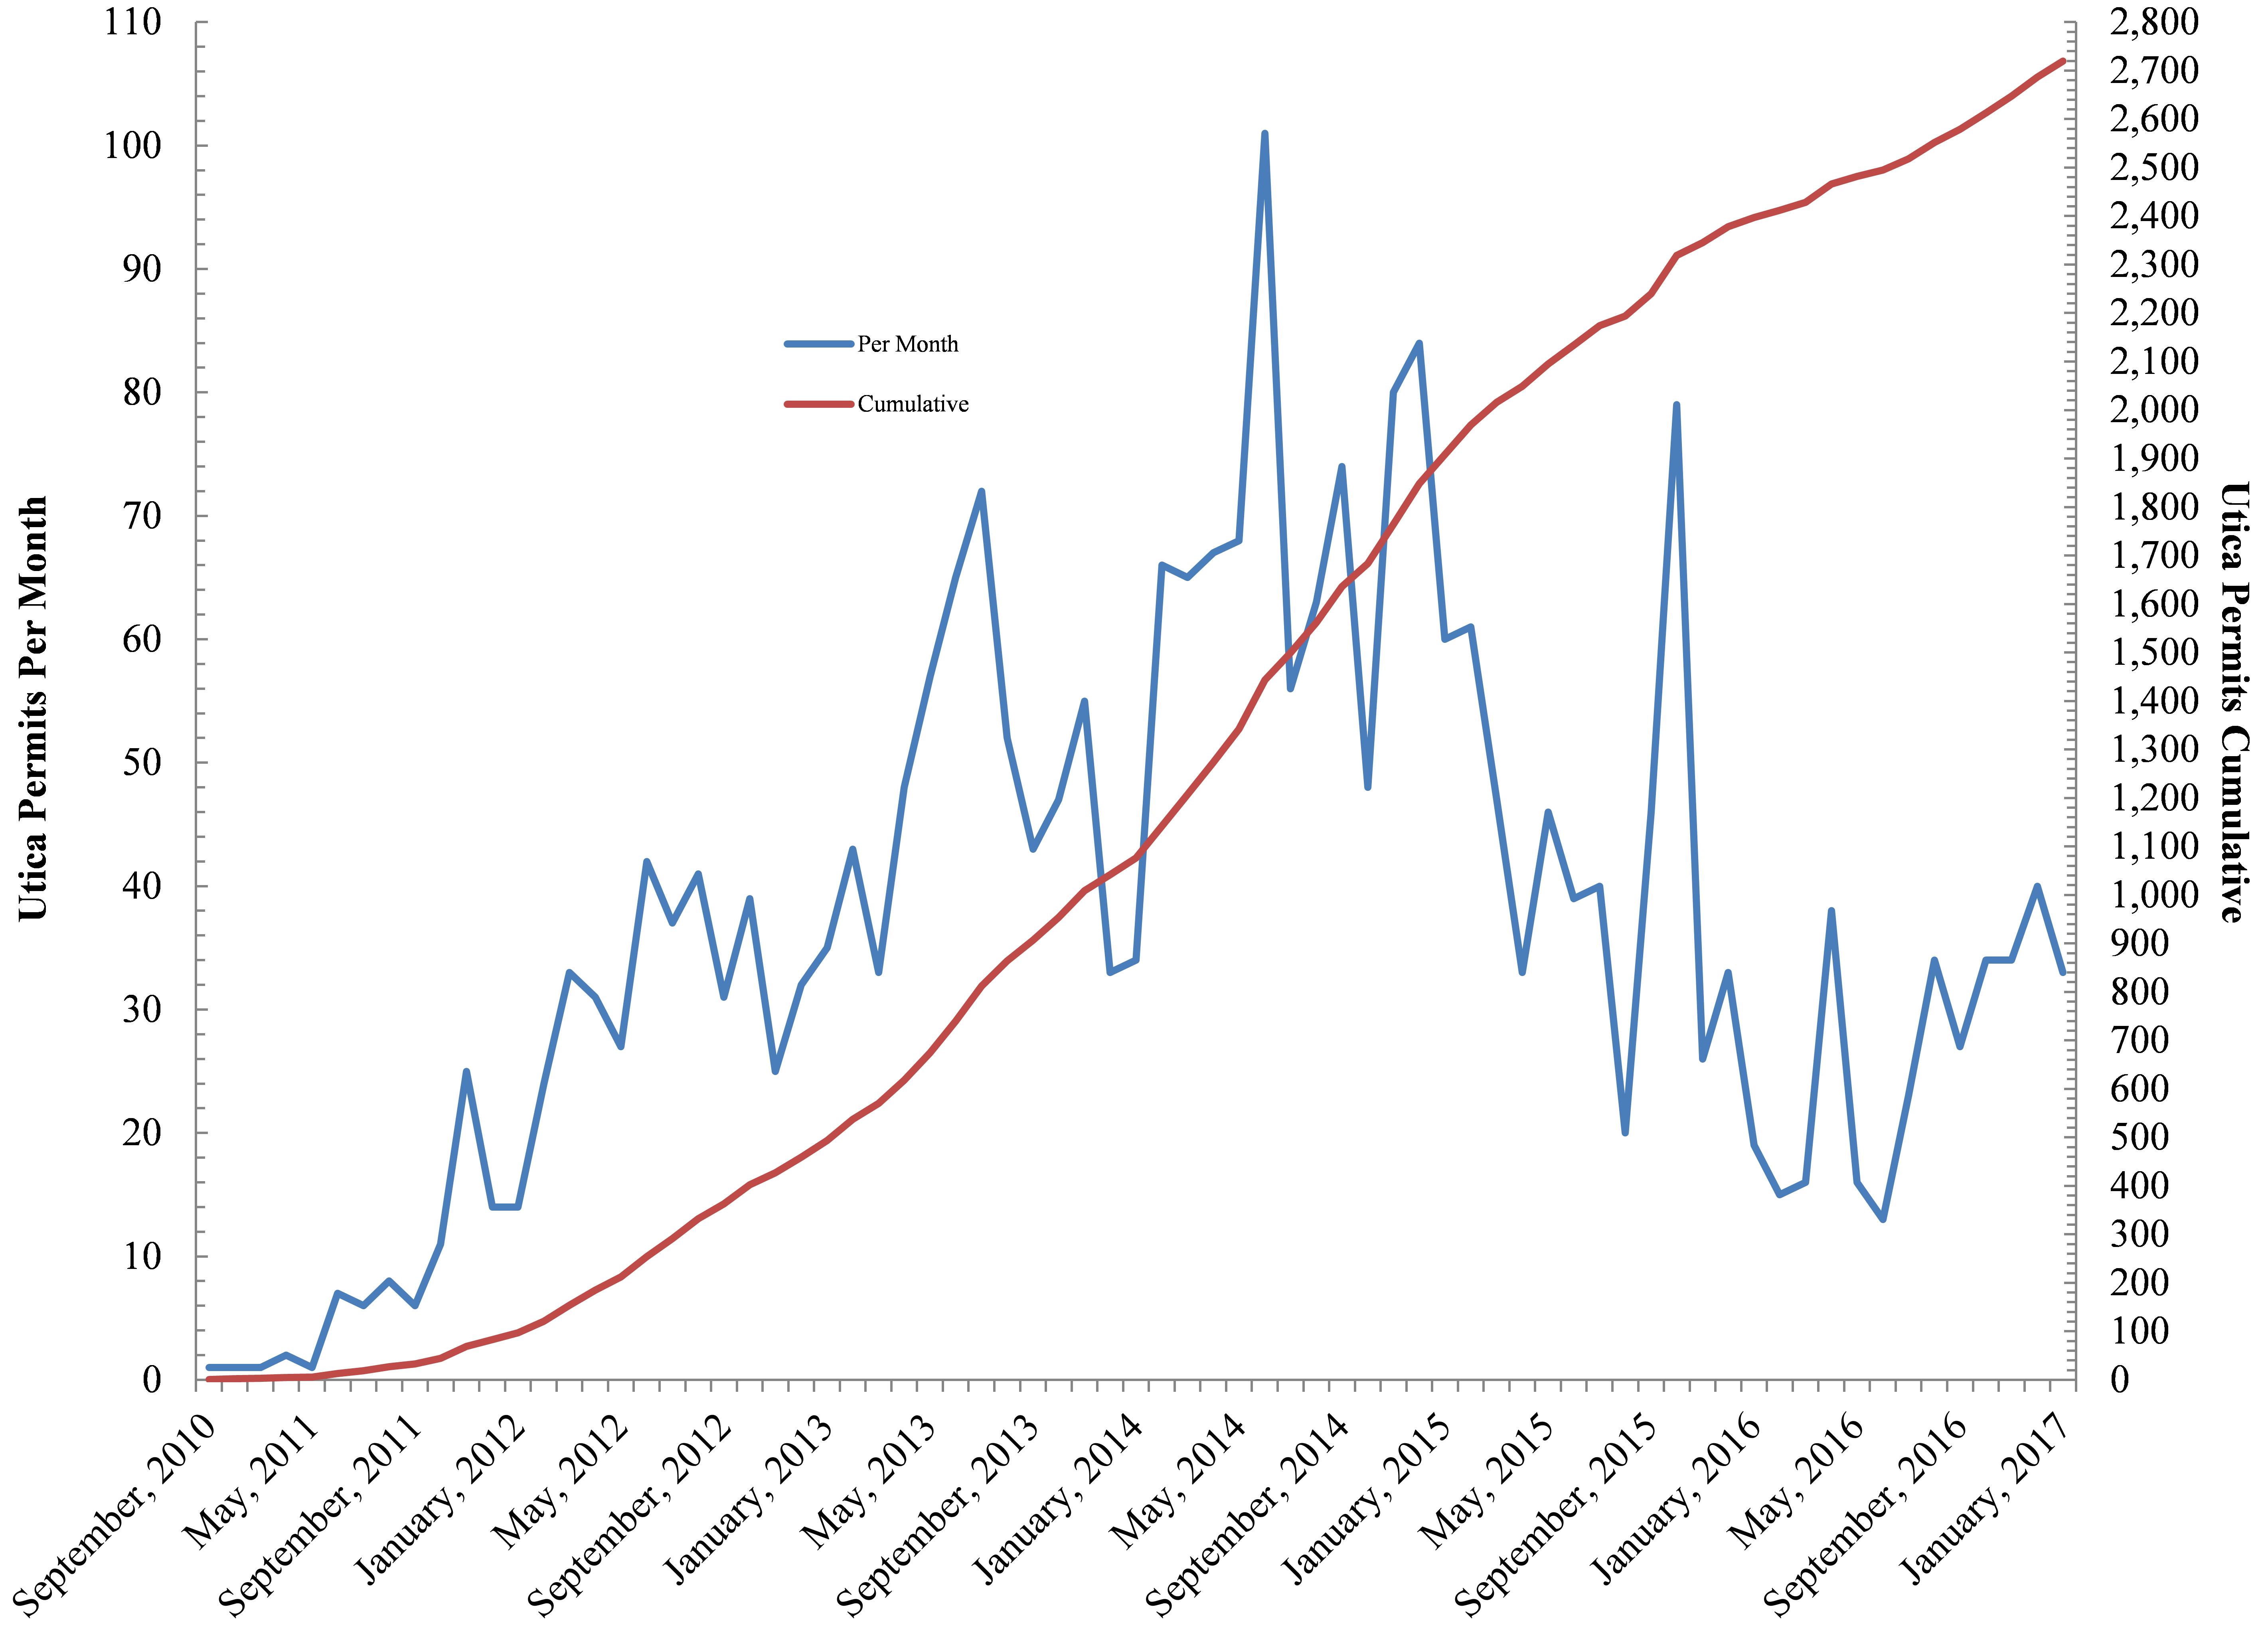
Figure 1. Cumulative and monthly hydraulic fracturing well permits in Ohio’s Utica Shale
While many shale plays across the United States are experiencing a period of contraction (with low gas prices often cited as the primary reason), drilling activity in Ohio’s Utica Shale has been experiencing a slow and steady expansion. The region has seen more than 2,700 permitted wells as of the end of January 2017. Incidentally, roughly 59% of these wells are producing either oil or gas as of Q3-2016. For more information on that subject, explore our production map.
The permitting trajectory hit a low of 13-16 permits per month between February and January of 2016. Since the presidential election in November, however, permitting rates have more than doubled (Figure 1).
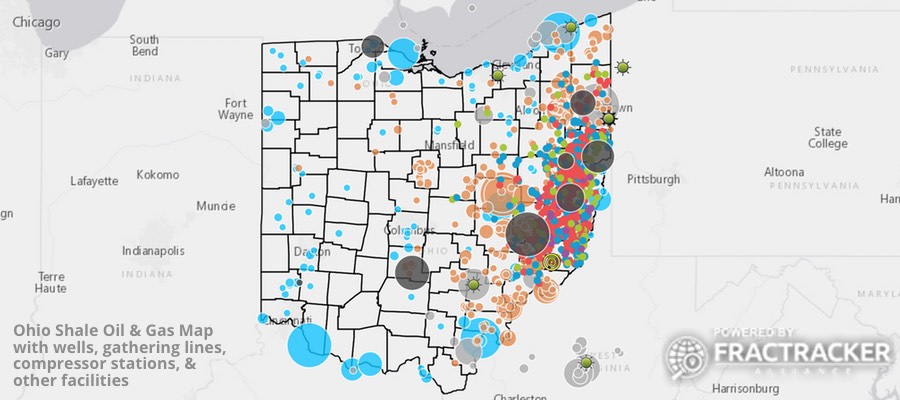
Ohio Oil & Gas Map
Ohio sits on the western edge of both the Utica and Marcellus Shale formations, but conditions are such that the Marcellus Shale is all but being ignored in Ohio. Explore our updated map of OH drilling activity and related facilities below:
View map fullscreen | How FracTracker maps work
Map Layers
The map above is made up of various datasets, from the location of permits to compressor stations. These “map layers” make up the legend. Below we describe each layer on the map, as well as the data source and date range.
Horizontal Marcellus Permits, Laterals
There have been 40+ permits issued for horizontal wells in Ohio’s Marcellus Shale.
Source: Ohio Department of Natural Resources
Date Range: December 2009 – Present
Horizontal Utica Permits
An aggregate of ODNR’s monthly cumulative Utica and Marcellus permits as well as a more detailed weekly Risk Based Data Management System (RBDMS) Microsoft Access inventory. At the present time Ohio is home to 2,160+ permitted Utica Wells with the wells broken out by status. Additionally this layer contains depth, water usage, sand usage, HCl, and Gelling Agent percentage for 249 wells based on data provided to FracFocus. Finally, we have incorporated production in various units from individual industry press releases and the ODNR annual report.
Source: Ohio Department of Natural Resources
Date Range: December 2009 – Present
Horizontal Utica Permits actual and straight line laterals
An aggregate of ODNR’s monthly cumulative Utica and Marcellus permits as well as a more detailed weekly Risk Based Data Management System (RBDMS) Microsoft Access inventory. At the present time we have straight line laterals for all drilled, drilling, and producing wells as well as actual PLAT laterals for 341 of the wells.
Source: Ohio Department of Natural Resources
Date Range: December 2009 – Present
High Volume Hydraulic Fracturing Gathering Lines
All gathering lines servicing Ohio’s inventory of High Volume Hydraulic Fracturing (HVHF) wells.
Source: Herbert Hoover Foundation grant
Date Range: December 2009 – 2015
High Volume Hydraulic Fracturing Well Pads
The well-pads of all Ohio’s drilled or producing High Volume Hydraulic Fracturing (HVHF) wells.
Source: Herbert Hoover Foundation grant
Date Range: December 2009 – 2015
High Volume Hydraulic Fracturing Well Pad’s Limits Of Disturbance (LOD)
Limits Of Disturbance (LOD) for all Ohio’s drilled or producing High Volume Hydraulic Fracturing (HVHF) well-pads.
Source: Herbert Hoover Foundation grant
Date Range: December 2009 – 2015
Compressor Stations and Cracking Facilities
Boundaries of several confirmed High Volume Hydraulic Fracturing (HVHF) servicing cracking and compressor station facilities.
Source: Herbert Hoover Foundation grant
Date Range: December 2009 – 2015
Ohio Active Class II Injection Wells
This data speaks to the state’s “Active” Class II Injection wells able to accept hydraulic fracturing waste. There are 240+ Active Wells with 51 having yet to receive waste from hydraulic fracturing. For more on Ohio’s Class II Inventory in depth refer to our recent Ohio Fracking Waste Transport & Disposal Network article.
Source: Ohio Department of Natural Resources
Date Range: Historical to October, 2015
Earthquakes of >2.0 Magnitude
This data speaks to the state’s 258 earthquakes with current updates from the Ohio Seismic Network and historical quakes – all >2.0 magnitude. These data come from the department’s inventory. Additionally, we present Ohio earthquakes with <2.0 magnitude courtesy of Environment Canada’s Search the Earthquake Database platform.
Source: Ohio Department of Natural Resources, Division of Geological Survey, The Ohio Seismic Network
Date Range: Historical to Present