Forest Fragmentation and O&G Development in PA’s Susquehanna Basin
In this forest fragmentation analysis, FracTracker looked at existing vegetation height in the northern portion of Pennsylvania’s Susquehanna River Basin. The vegetation height data is available from LANDFIRE, a resource used by multiple federal agencies to assess wildfire potential by categorizing the vegetation growth in 30 by 30 meter pixels into different categories. In the portion of Pennsylvania’s Susquehanna Basin where we looked, there were 29 total categories based on vegetation height. For ease of analysis, we have consolidated those into eight categories, including roads, developed land, forest, herbs, shrubs, crops, mines and quarries, and open water.
Methods
We compared the ratio of the total number of each pixel type to the type that was found at vertical and horizontal wells in the region. In this experiment, we hypothesized that we would see evidence of deforestation in the areas where oil and gas development is present. Per our correspondence with LANDFIRE staff, the vegetation height data represents a timeframe of about 2014, so in this analysis, we focused on active wells that were drilled prior to that date. We found that the pixels on which the horizontal wells were located had a significantly different profile type than the overall pixel distribution, whereas conventional wells had a more modest departure from the general characteristics of the region.
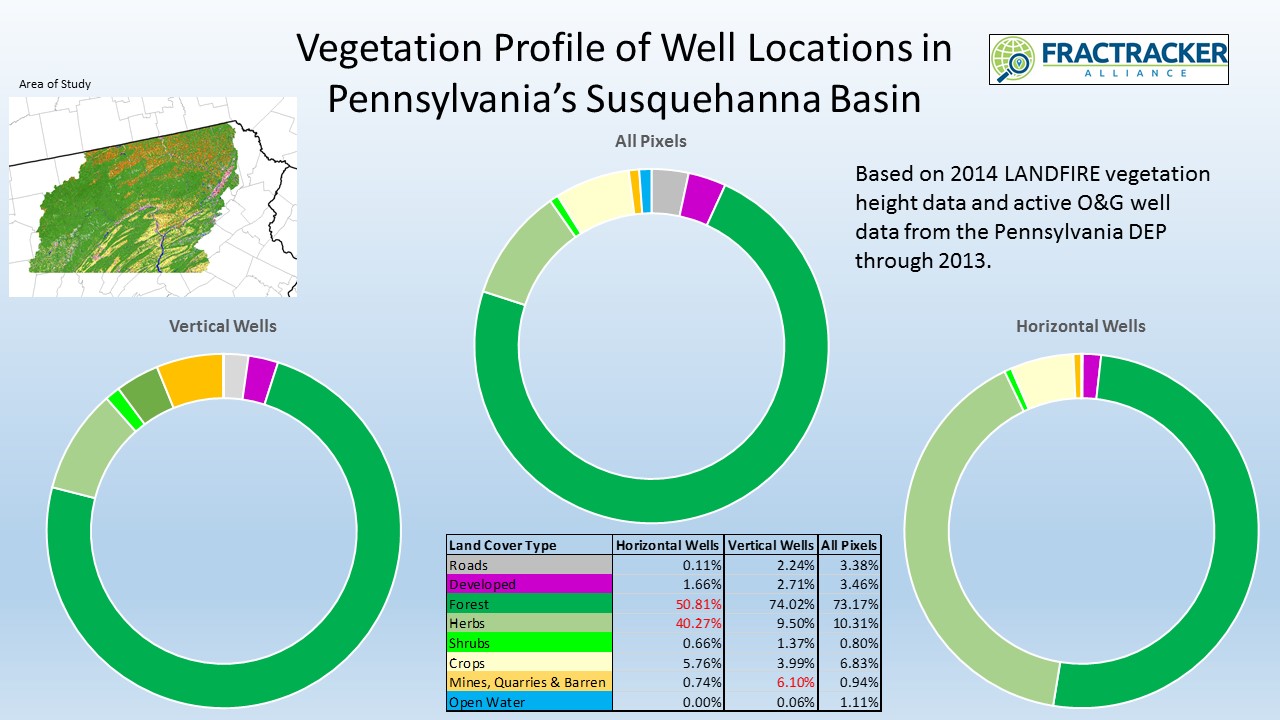
Figure 1 – Vegetation profile of the northern portion of Pennsylvania’s Susquehanna River Basin. The area is highly impacted by O&G development, a trend that is likely to continue in the coming years.
In Figure 1, we see that the land cover profile where vertical wells (n=6,198) are present is largely similar to the overall distribution of pixels for the entire study area (n=40,897,818). While these wells are more than six times more likely to be on areas classified as mines, quarries, or barren, it is surprising that the impact is not even more pronounced. In terms of forested land, there is essentially no change from the background, with both at about 73%. However, the profile for horizontal wells (n=3,787) is only 51% forested, as well as being four times more likely than the background to be categorized as herbs, which are defined in this dataset as having a vegetation height of around one meter.
Why Aren’t the Impacts Even More Pronounced?
While the impacts are significant, particularly for horizontal wells, it is a bit surprising that evidence of deforestation isn’t even more striking. We know, for example, that unconventional wells are usually drilled in multi-well pads that frequently exceed five acres of cleared land, so why aren’t these always classified as mines, quarries, and barren land, for example? There are several factors that can help to explain this discrepancy.
First, it must be noted that at 900 square meters, each pixel represents almost a quarter of acre, so the extent of these pixels will not always match with the area of disturbance. And in many cases, the infrastructure for older vertical wells is completely covered by the forest canopy, so that neither well pad nor access road is visible from satellite imagery.
View map fullscreen | How FracTracker maps work
The map above shows horizontal and vertical wells in a portion of Centre County, Pennsylvania, an area within our study region. Note that many of the vertical wells, represented by purple dots, appear to be in areas that are heavily forested, whereas all of the horizontal wells (yellow dots) are on a defined well pad in the lower right part of the frame. Panning around to other portions of Centre County, we find that vertical wells are often in a visible clearing, but are frequently near the edge, so that the chances of the 30 by 30 meter pixel that they fall into is much more likely to be whatever it would have been if the well pad were not there.
We must also consider that this dataset has some limitations. First of all, it was built to be a tool for wildfire management, not as a means to measure deforestation. Secondly, there are often impacts that are captured by the tool that were not exactly on the well site. For this reason, it would make sense to evaluate the area around the well pad in future versions of the analysis.
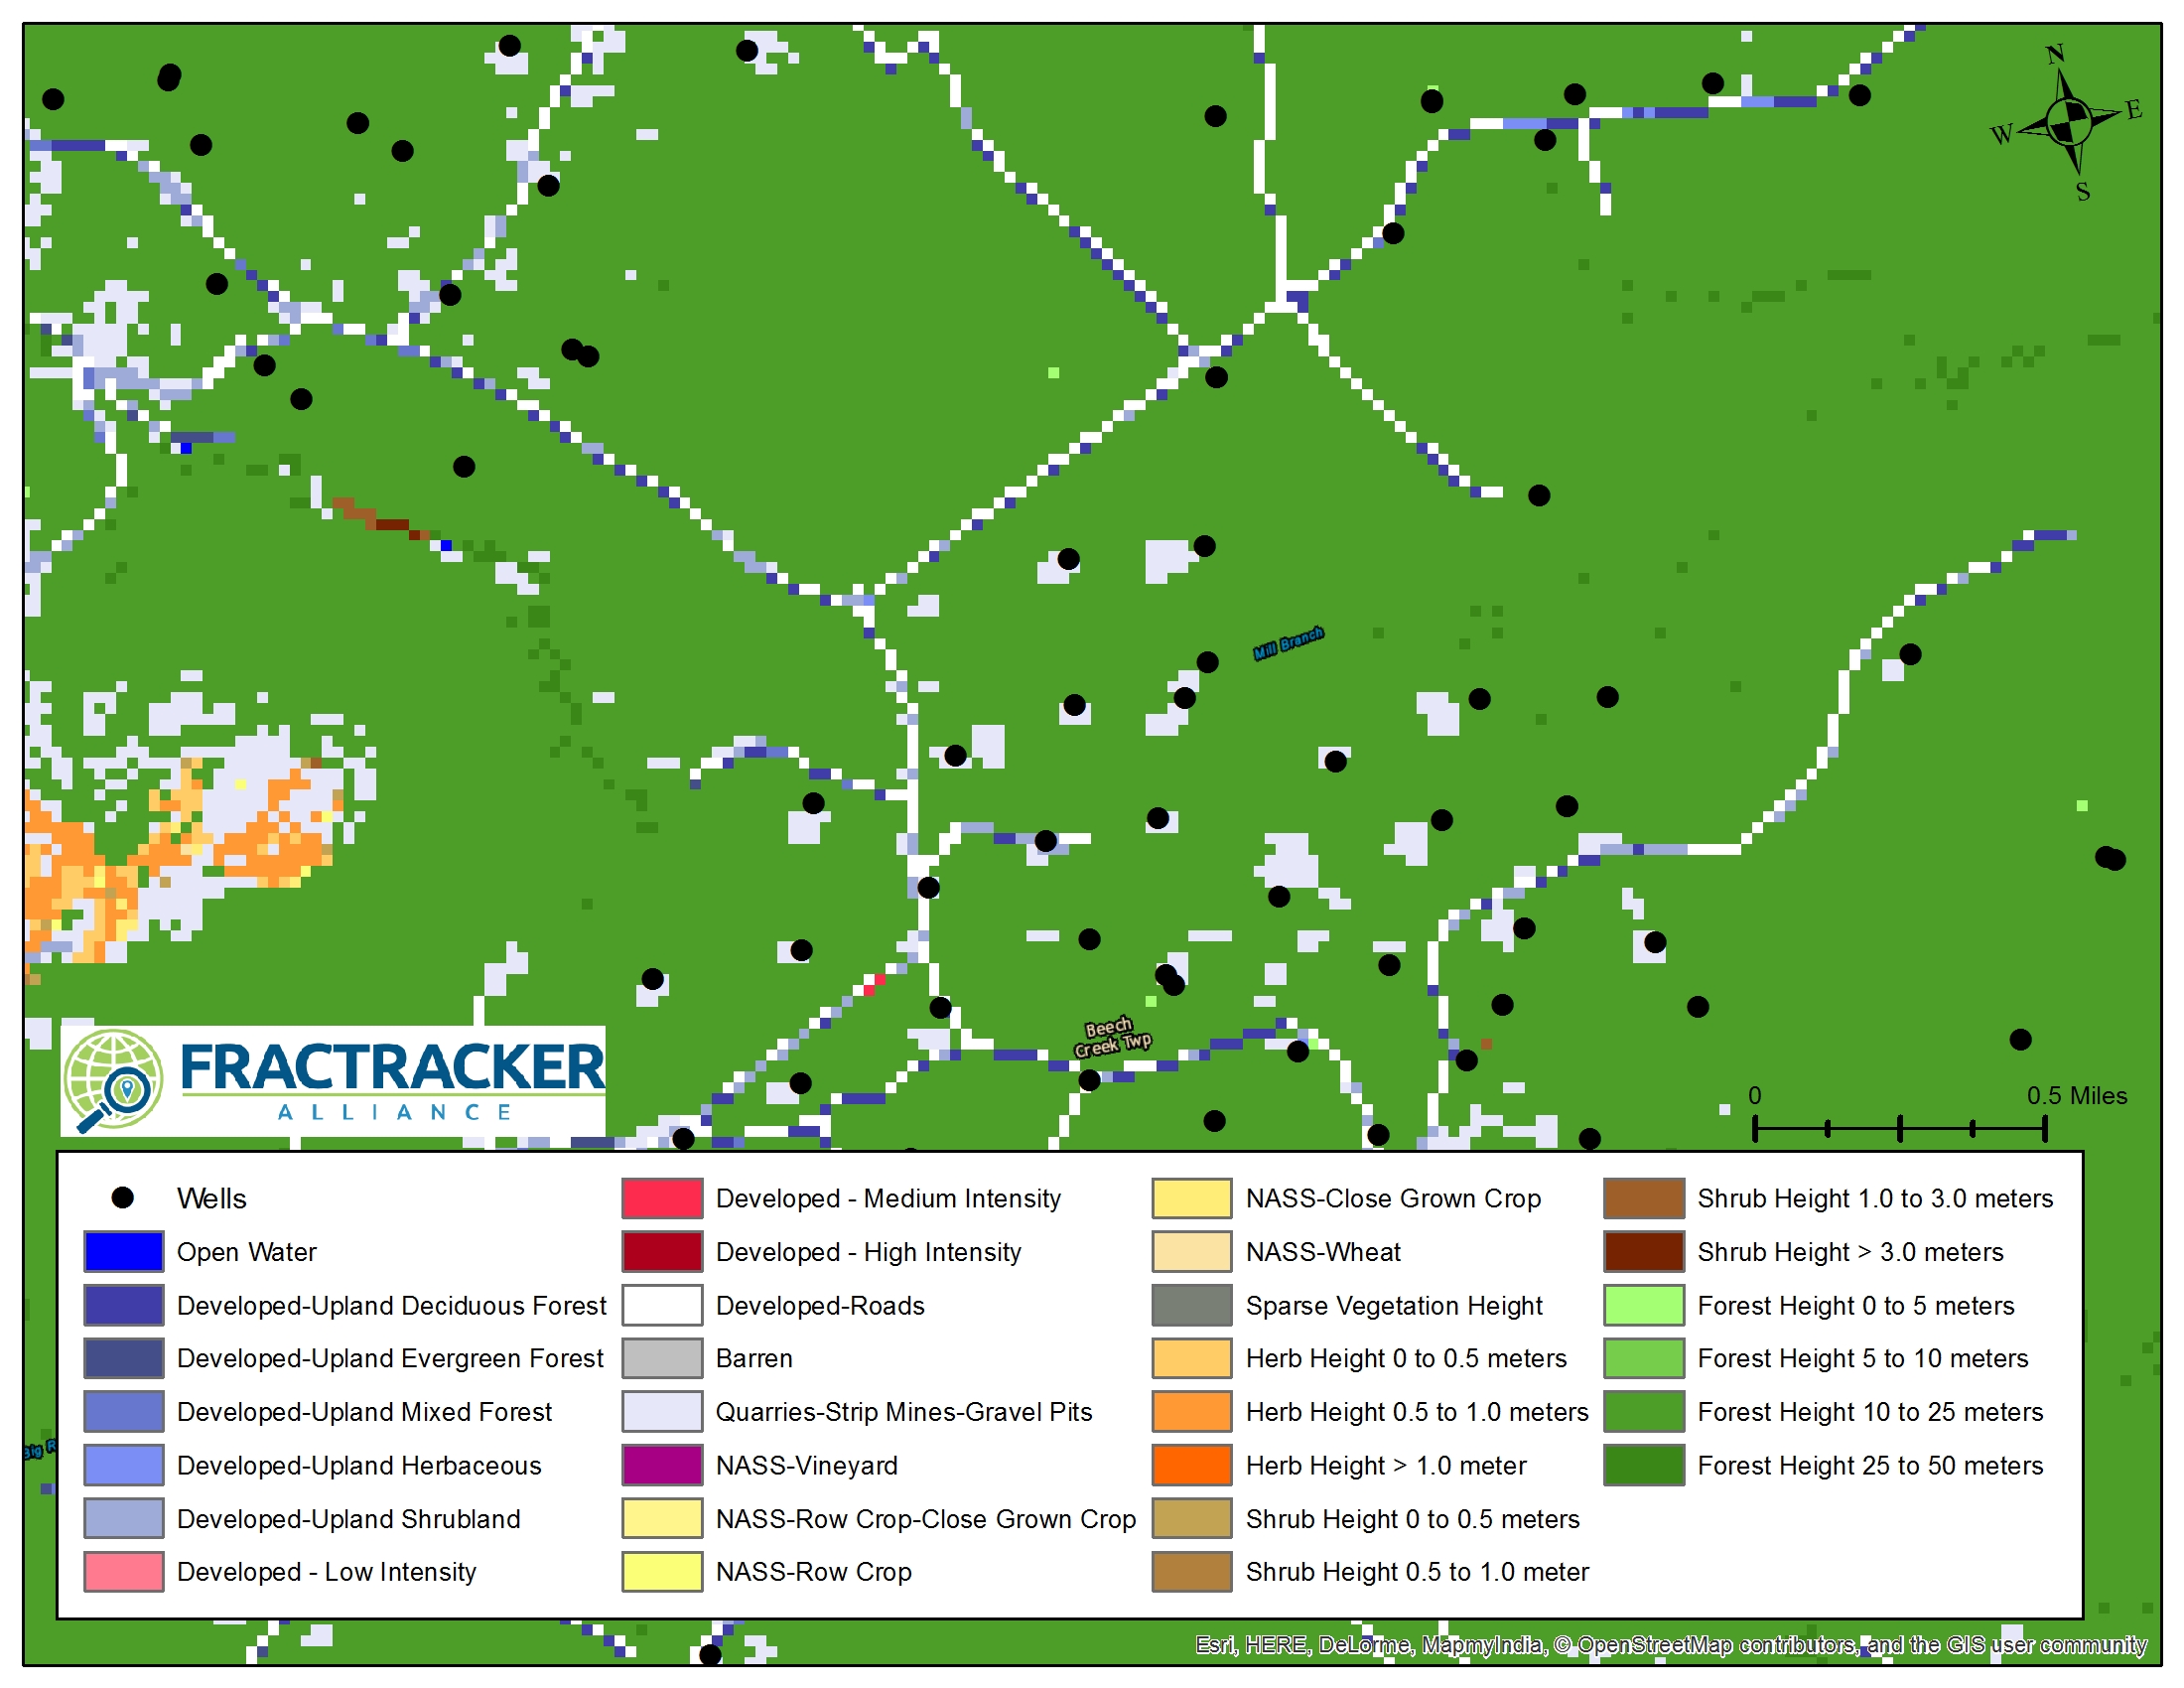
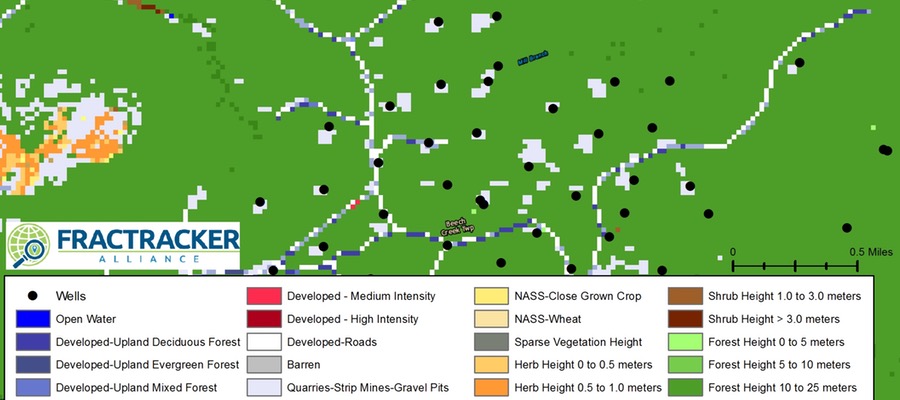
Figure 2 – A close up of a group of wells in the study area. Note that the disturbed land (light grey) does not always correspond exactly with the well locations.
In Figure 2, we see a number of light grey areas –representing quarries, strip mines, and gravel pits –with an O&G well just off to the side. Such wells did not get classified as being on deforested land in this analysis.
And finally, after clarifying the LANDFIRE metadata with US Forest Service personnel involved in the project, we learned that while the map does represent vegetation cover circa 2014, it is actually build on satellite data collected in 2001, which has subsequently been updated with a detailed algorithm. However, the project is just beginning a reboot of the project, using imagery from 2015 and 2016. This should lead to much more accurate analyses in the future.
Why Forest Fragmentation Matters
The clearing of forests for well pads, pipelines, access roads, and other O&G infrastructure that has happened to date in the Susquehanna Basin is only a small fraction of the planned development. The industry operates at full capacity, there could be tens of thousands of new unconventional wells drilled on thousands of well pads in the region through 2030, according to estimates by the Nature Conservancy. They have also calculated an average of 1.65 miles of gathering lines from the well pad to existing midstream infrastructure. With a typical right-of-way being 100 feet wide, these gathering lines would require clearing 20 acres. It isn’t unusual for the total disturbance for a single well pad and the associated access road to exceed ten acres, making the total disturbance about 30 acres per well pad. Based on the vegetation distribution of the region, we can expect that 22 of these acres, on average, are currently forested land. Taking all of these factors into consideration, a total disturbance of 100,000 to 200,000 acres in Pennsylvania’s Susquehanna River Basin due to oil and gas extraction, processing, and transmission may well be a conservative estimate, depending on energy choices we make in the coming years.
This forest fragmentation has a number of deleterious effects on the environment. First, many invasive plant species, such as bush honeysuckle and Japanese knotweed, tend to thrive in recently disturbed open areas, where competing native plants have been removed. The practice also threatens numerous animal species that thrive far from the forest’s edge, including a variety of native song birds. The disturbed lands create significant runoff into nearby rivers and streams, which can have an impact on aquatic life. And the cumulative release of carbon into the atmosphere is staggering – consider that the average acre of forest in the United States contains 158,000 pounds of organic carbon per acre. As the area is 73% forested, the total cumulative impact could result in taking 5.8 to 11.6 million tons of organic carbon out of forested storage. Much of this carbon will find its way into the atmosphere, along with the hydrocarbons that are purposefully being extracted from drilling operations.