Pennsylvania Pipelines and Pollution Events
When people think about oil and gas extraction in Pennsylvania, they think about the tens of thousands of oil and gas wells in the state. It makes sense, because that’s where the process starts. However, while oil and other liquids can be shipped in tanker trucks, all of the producing gas wells in the state – whether they are small conventional wells or the giants of the Marcellus and Utica – must be connected by a network of pipelines.
Moving hydrocarbons from the well to processing facilities to power plants and residential customers all occurs within this giant midstream system, and the cumulative impact that pipelines have on the state is formidable. Let’s take a closer look at where the oil and gas pipelines are located in PA, their safety records, and major data gaps. Additionally, we’ve made available a detailed, interactive map of Pennsylvania pipelines and other important features such as water crossings.
Pipeline routes are everywhere in Pennsylvania
According to the Pipeline and Hazardous Materials Safety Administration (PHMSA), there were 92,407 miles of pipelines carrying natural gas and liquid petroleum products in Pennsylvania in 2017. That distance is equivalent to 151 round trips between Philadelphia and Pittsburgh on the Pennsylvania Turnpike, or more than three trips around the globe at the equator. This figure includes 78,022 miles of distribution lines (which takes gas from public utilities to consumers), 10,168 miles of transmission lines (which move gas between various processing facilities), 3,111 miles of petroleum liquid routes, and 1,105 miles of natural gas gathering lines (which take the gas from wells to midstream processing facilities).
Of note – The last category’s estimate is almost certainly a drastic underestimation. As of June 7th, there were 3,781 unconventional well pads in Pennsylvania, according the Pennsylvania Department of Environmental Protection (DEP), and all of the pads need to be connected to gathering lines. A 2014 report by the Nature Conservancy estimates that 19 acres of land are cleared for each well pad, which would work out to 3.1 miles of gathering lines for a typical 50-foot right-of-way. Multiplied out, 3,781 wells pads would require a total of 11,721 miles of gathering lines – well over PHMSA’s estimate of a 1,105 miles (See Table 1 for estimate comparisons).
Table 1. Varying estimates of gathering lines in Pennsylvania.*
| Source |
Unconventional Well Pads |
Average Gathering Line Length (Miles) | Statewide Total Estimated Miles |
| Nature Conservancy | 3,781 | 3.1 | 11,721 |
| Bradford County | 3,781 | 3.5 | 13,234 |
| PHMSA | 3,781 | 0.3 | 1,105 |
*Estimates based on Nature Conservancy and Bradford County data are based on calculating the average length of segments, then multiplying by the number of well pads in the state to find the statewide total. The PHMSA estimate was calculated in reverse, by dividing the purported total of gathering lines by the number of well pads to find the average mileage.
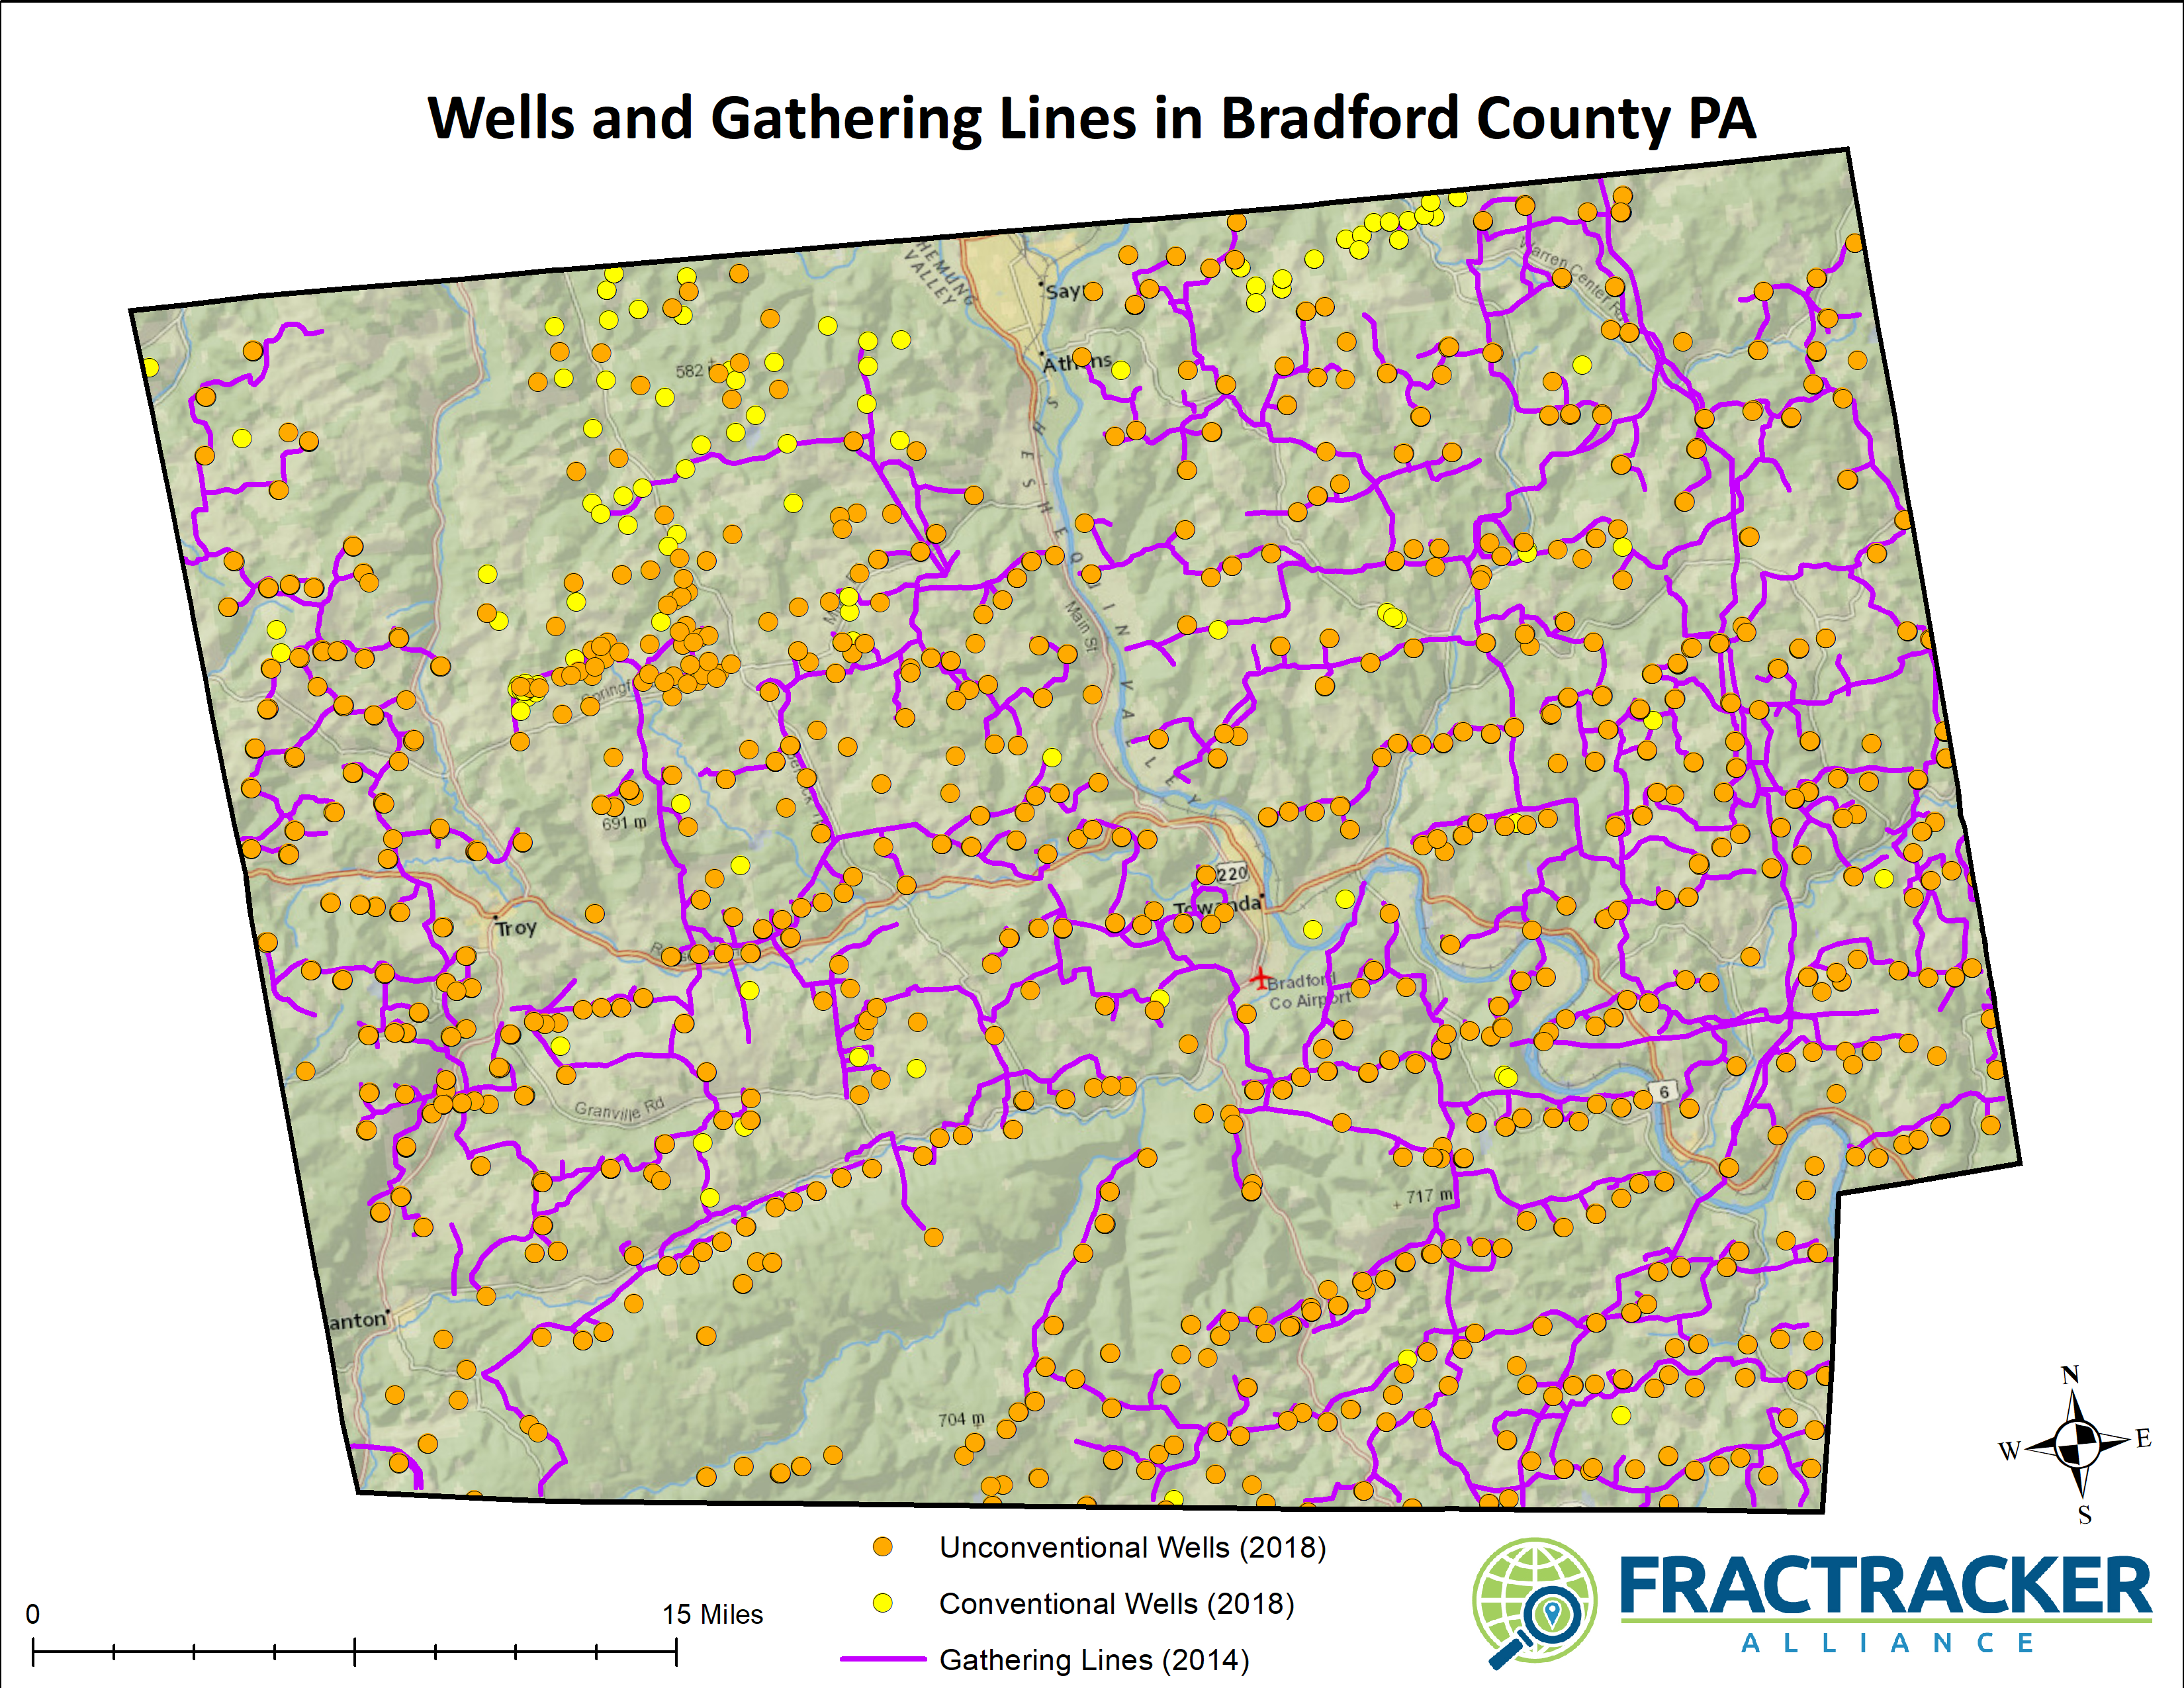
Figure 1: Location of gathering lines (2014) and oil and gas wells (2018) in Bradford County, Pennsylvania. Note the pockets of newer wells that are not connected to the older gathering line network.
In 2014, the FracTracker Alliance digitized a published map of gathering lines in Bradford County, allowing us to analyze the data spatially (Figure 2). These efforts yield similar results, with gathering lines averaging 3.5 miles in length. Not counting segments of transmission lines included in the data, such as Stagecoach, Sunoco, and Kinder Morgan’s Tennessee Gas Pipeline, there were 1,003 miles of gas gathering lines just in Bradford County in 2014.
Almost all of this data is based only on unconventional oil and gas activity, and therefore ignores the more than 96,000 conventional oil and gas (O&G) wells active in the state. We do not have a reasonable estimate on the average length of gathering line segments are for this network. It is reasonable to assume that they tend to be shorter, as conventional wells are often closer together than unconventional well pads, but they must still network across vast portions of the state.
Table 2. Estimated length of gathering lines for conventional wells in Pennsylvania by variable average lengths
| Average Length (Miles) | Conventional Wells | Total Miles |
| 0.5 | 96,143 | 48,072 |
| 1.0 | 96,143 | 96,143 |
| 1.5 | 96,143 | 144,215 |
| 2.0 | 96,143 | 192,286 |
| 2.5 | 96,143 | 240,358 |
| 3.0 | 96,143 | 288,429 |
If the average gathering line for conventional wells in Pennsylvania is at least 1 mile in length, then the total mileage of gathering lines would exceed all other types of gas and petroleum pipelines in the state. Conversely, for the PHMSA figure of 1,105 miles to be accurate, the average gathering line for all conventional wells and unconventional well pads in Pennsylvania would be 0.011 miles, or only about 58 feet long.
Pipelines are dangerous
As pipelines impact residents in many ways, there are numerous reason why communities should try to understand their impacts – including basic planning, property rights, sediment runoff into streams, to name a few. Perhaps the most significant reason, however, is the potential for harmful incidents to occur, which are more common than anyone would like to think (See Table 3). Some of these incidents are quite serious, too.
Table 3. Nationwide pipeline incidents statistics from PHMSA from January 1, 2010 through July 13, 2018
| Report | Events | Fatalities | Injuries | Explosions | Evacuees | Total Damages |
| Gas Distribution | 909 | 92 | 432 | 220 | 16,949 | $348,511,528 |
| Gas Transmission / Gathering | 1,031 | 23 | 94 | 49 | 8,557 | $1,085,396,867 |
| Hazardous Liquids | 3,368 | 10 | 24 | 14 | 2,467 | $2,531,839,207 |
| Grand Total | 5,308 | 125 | 550 | 283 | 27,973 | $3,965,747,602 |
As of the July 13, 2018 download date, the PHMSA report covers 3,116 days.
Incidents Per Day
This means that nationally per day there are 1.7 pipeline incidents, almost 9 people evacuated, and $1,272,704 in damages, including the loss of released hydrocarbons.
On average, there is a fatality every 25 days, an injury every six days, and an explosion every 11 days. The location of those explosions obviously has a lot to do with the casualty count and aggregate property damage.
How do Pennsylvania pipelines hold up? As one might expect from a state with so many pipelines, Pennsylvania’s share of these incidents are significant (See Table 4).
Table 4. Pennsylvania pipeline incidents statistics from PHMSA from January 1, 2010 through July 13, 2018
| Report | Events | Fatalities | Injuries | Explosions | Evacuees | Total Damages |
| Gas Distribution | 29 | 8 | 19 | 12 | 778 | $6,769,061 |
| Gas Transmission / Gathering | 30 | 0 | 2 | 2 | 292 | $51,048,027 |
| Hazardous Liquids | 49 | 0 | 0 | 1 | 48 | $9,115,036 |
| Grand Total | 108 | 8 | 21 | 15 | 1,118 | $66,932,124 |
Within Pennsylvania, an incident is reported to PHMSA every 29 days, an injury or fatality can be expected every 107 days, and the daily average of property damage is $21,480.
The issue with under-reported gathering lines notwithstanding, PHMSA lists Pennsylvania with 92,407 miles of combined gas and hazardous liquid pipelines, which is roughly 3.3% of the nationwide total, and there is no reason to believe that PHMSA’s issue with accounting for gathering lines is unique to the Keystone State.
Just 2% of the total number of incidents are in Pennsylvania. In terms of impacts, however, the state has seen more than its fair share – with 6.4% of fatalities, 3.8% of injuries, 5.3% of explosions, and 3.9% of evacuations. Property damage in Pennsylvania accounts for just 1.7% of the national total, making it the only category examined above for which its share of impacts is less than expected, based on total pipeline miles.
Pipeline location data not widely available
Pipeline data is published from a variety of public agencies, although almost none of it is really accessible or accurate.
For example the Department of Homeland Security (DHS) publishes a number of energy-related datasets. While they do not publish gas pipelines, they do have a 2012 dataset of natural gas liquid routes, which is a significant portion of the hazardous liquid inventory. From an analytical point of view, however, this dataset is essentially worthless. Many of these pipelines are so generalized that they don’t make a single bend for multiple counties, and the actual location of the routes can be miles from where the data are represented. Communities cannot use this as a tool to better understand how pipelines interact with places that are important to them, like schools, hospitals, and residential neighborhoods. The dataset is also incomplete – the original Mariner East natural gas pipeline, which has been around for decades, isn’t even included in the dataset.
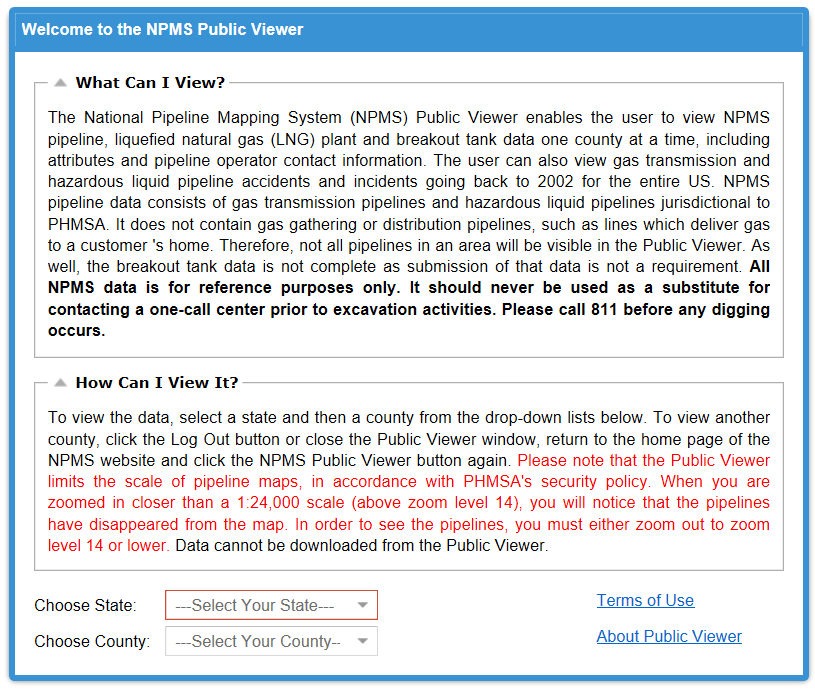
Figure 2: This text appears to viewers of PHMSA’s public pipeline viewer.
Another data source is PHMSA’s National Pipeline Mapping System Public Viewer. While this source is rich in content, it has several intentional limitations that thwart the ability of the public to accurately analyze the pipeline network and understand potential impacts:
- Data can only be accessed one county at a time, which is impractical for long interstate transmission routes,
- Data can not be be downloaded, and
- The on-screen representation of the routes disappears when users zoom in too far.
Within Pennsylvania, the Department of Environmental Protection (DEP) maintains the Pennsylvania Pipeline Portal, which contains a lot of information about various recent pipeline projects. However, with the sole exception of the Mariner East II project, the agency does not provide any geospatial data for the routes. The reason for this is explained on the Mariner East II page:
These shapefiles are the GIS data layers associated with the permits that have been submitted for the proposed pipeline project. These shapefiles are not required as part of a permit application and are not commonly submitted but were provided to the Department by Sunoco Pipeline, L.P.
The files were accepted by the Department to aid in the review of the application material given the large scale of the project. The shapefiles ease the review by displaying some information contained in the hardcopy of the plans and application in a different format.
The Department of Conservation and Natural Resources (DCNR) does make oil and gas infrastructure data available, including pipelines, where it occurs on state forest land.
Pennsylvania Pipelines Map
Considering the risks posed by pipelines, their proliferation in Pennsylvania, and this critical juncture in their development with an implicit opportunity to document impacts, FracTracker believes it is important now to develop an accurate interactive statewide map of these projects, fortify it with essential data layers, and facilitate citizen reporting of the problems that are occurring.
Other than the Mariner East II route and the state forest data available from DCNR, all of the pipeline routes on our Pennsylvania Pipeline Map, below, have been painstakingly digitized – either from paper maps, PDFs, or other digital media – to make geospatial data that can analyzed by interacting with other datasets. These layers are only as good as their sources, and may not be exact in some cases, but they are orders of magnitude better than data produced by public agencies such as DHS.
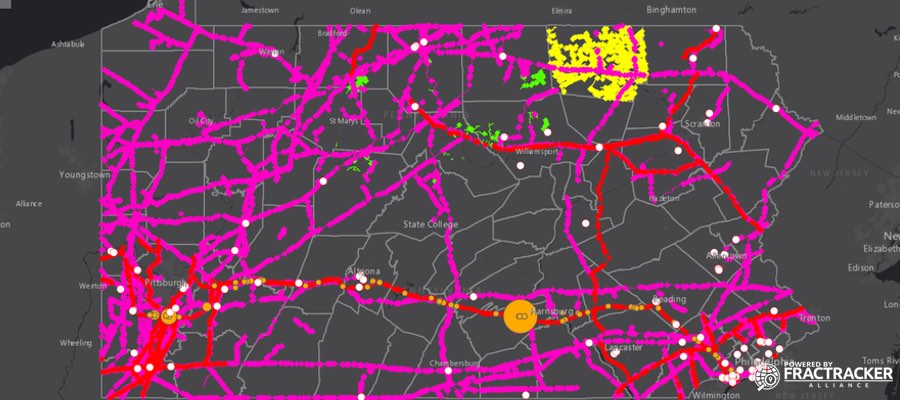
Figure 3: FracTracker’s Pennsylvania Pipeline Map. View fulll screen to explore map further, view water crossings, and other details not visible at the statewide map view.
Data Layers on Pennsylvania Pipelines Map
By Matt Kelso, Manager of Data and Technology
This article is the first in a two-part series on Pennsylvania pipelines. Stay tuned!