A Disturbing Tale of Diminishing Returns in Ohio
Utica oil and gas production, Class II injection well volumes, and lateral length trends from 2010-2018
The US Energy Information Administration (EIA) recently announced that Ohio’s recoverable shale gas reserves have magically increased by 11,076 billion cubic feet (BCF). This increase ranks the Buckeye State in the top 5 for changes in recoverable shale natural gas reserves between 2016 and 2017 (pages 31- 32 here). After reading the predictable and superficial media coverage, we thought it was time to revisit the data to ask a pertinent question: What is the fracking industry costing Ohio?
Recent Shale Gas Trends in Ohio
According to the EIA’s report, Ohio currently sits at #7 on their list of proven reserves. It is estimated there are 27,021 BCF of shale gas beneath the state (Figure 1).
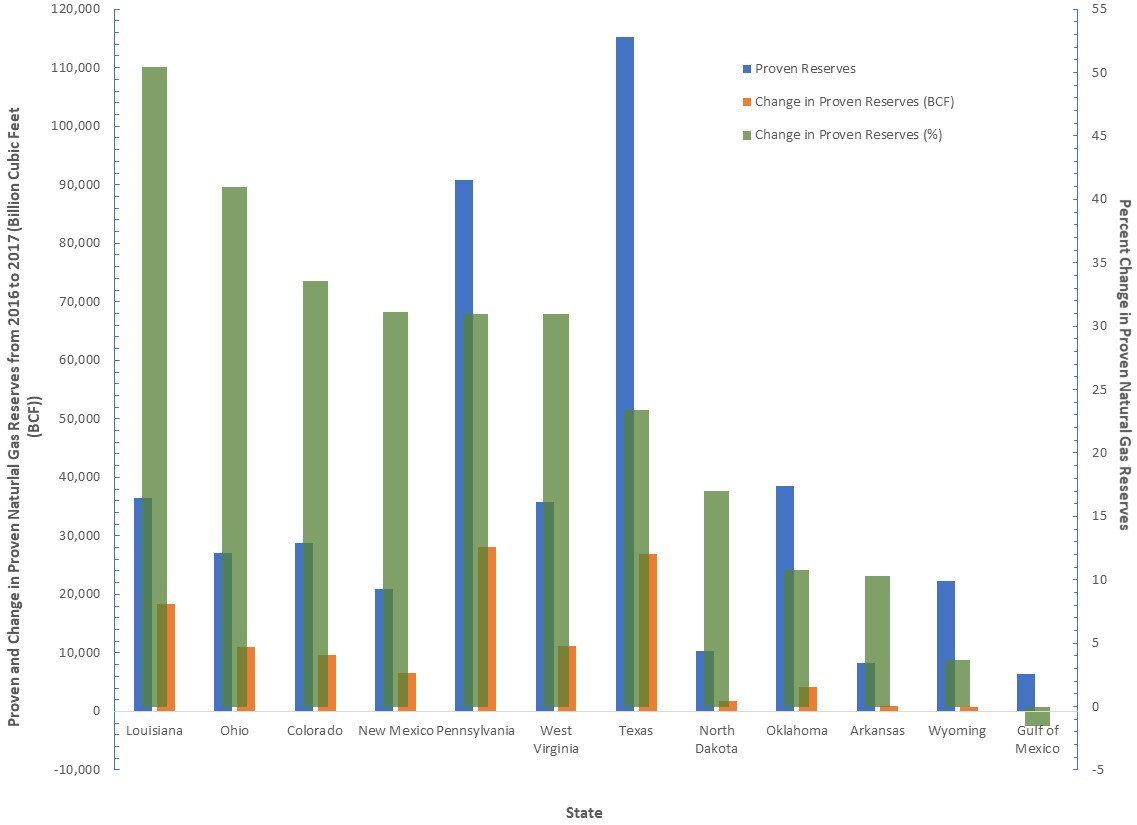
Figure 1. Proven and change in proven natural gas reserves from 2016 to 2017 for the top 11 states and the Gulf of Mexico (calculated from EIA’s “U.S. Crude Oil and Natural Gas Proved Reserves, Year-End 2017”).
There are a few variations in the way the oil and gas industry defines proven reserves:
…an estimated quantity of all hydrocarbons statistically defined as crude oil or natural gas, which geological and engineering data demonstrate with reasonable certainty to be recoverable in future years from known reservoirs under existing economic and operating conditions. Reservoirs are considered proven if economic producibility is supported by either actual production or conclusive formation testing. – The Organization of Petroleum Exporting Countries
… the quantity of natural resources that a company reasonably expects to extract from a given formation… Proven reserves are classified as having a 90% or greater likelihood of being present and economically viable for extraction in current conditions… Proven reserves also take into account the current technology being used for extraction, regional regulations and market conditions as part of the estimation process. For this reason, proven reserves can seemingly take unexpected leaps and drops. Depending on the regional disclosure regulations, extraction companies might only disclose proven reserves even though they will have estimates for probable and possible reserves. – Investopedia
What’s missing from this picture?
Neither of the definitions above address the large volume of water or wastewater infrastructure required to tap into “proven reserves.” While compiling data for unconventional wells and injection wells, we noticed that the high-volume hydraulic fracturing (HVHF) industry is at a concerning crossroads. In terms of “energy return on energy invested,” HVHF is requiring more and more resources to stay afloat.
OH quarterly Utica oil & gas production along with quarterly Class II injection well volumes:
The map below shows oil and gas production from Utica wells (the primary form of shale gas drilling in Ohio). It also shows the volume of wastewater disposed in Class II salt water disposal injection wells.
View map fullscreen | How FracTracker maps work
Publications like the aforementioned EIA article and language out of Columbus highlight the nominal increases in fracking productivity. They greatly diminish, or more often than not ignore, how resource demand and waste production are also increasing. The data speak to a story of diminishing returns – an industry requiring more resources to keep up gross production while simultaneously driving net production off a cliff (Figure 2).
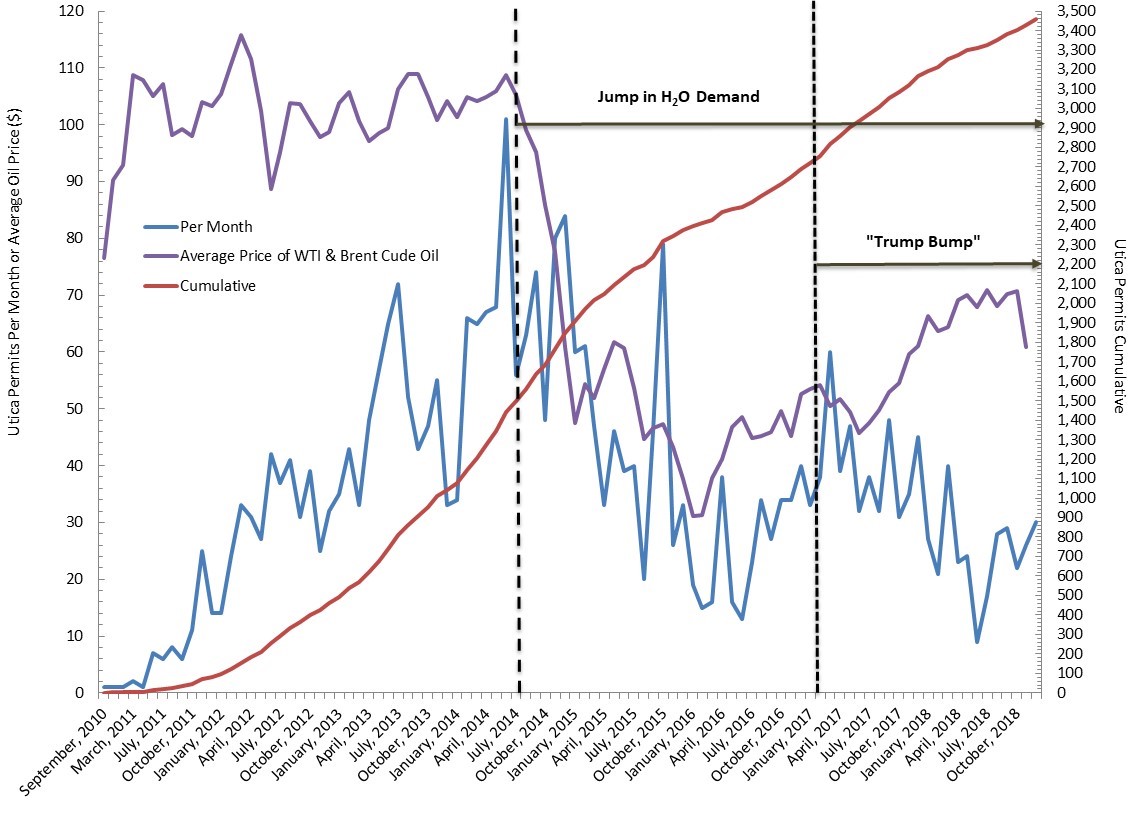
Figure 2. Number of Utica permits in Ohio on a cumulative and monthly basis along with the average price of West Texas Intermediate (WTI) and Brent Crude oil per barrel from September 2010 to December 2018
The Great Decoupling of New Year’s 2013
In the following analysis, we look at the declining efficiency of the HVHF industry throughout Ohio. The data spans the end of 2010 to middle of 2018. We worked with Columbus-area volunteer Gary Allison to conduct this analysis; without Gary’s help this work and resulting map, would not have been possible.
A little more than five years ago today, a significant shift took place in Ohio, as the number of producing gas wells increased while oil well numbers leveled off. The industry’s permitting high-water mark came in June of 2014 with 101 Utica permits that month (a level the industry hasn’t come close to since). The current six-month permitting average is 25 per month.
As the ball dropped in Times Square ringing in 2014, in Ohio, a decoupling between oil and gas wells was underway and continues to this day. The number of wells coming online annually increased by 229 oil wells and 414 gas wells.
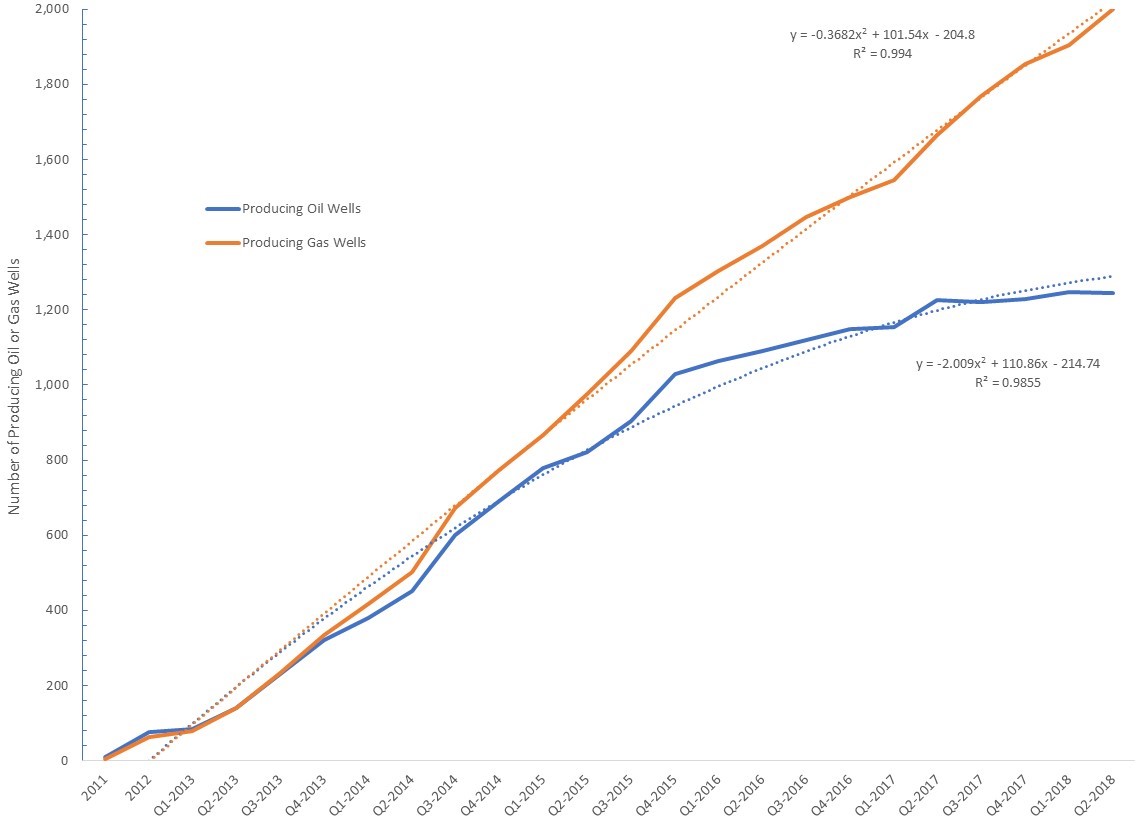
Figure 3. Number of producing oil and gas wells in Ohio’s Utica Shale Basin from 2011 to Q2-2018
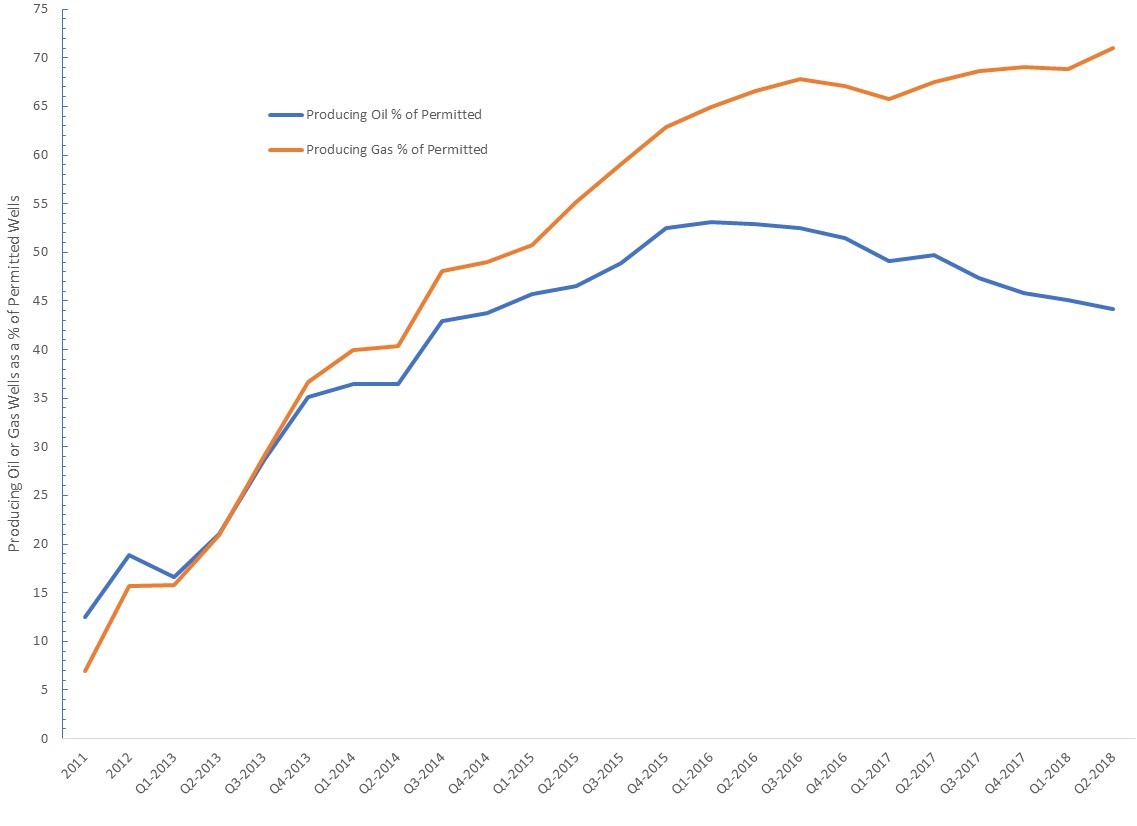
Figure 4. Producing oil and gas wells as a percentage of permitted wells in Ohio’s Utica Shale Basin from 2011 to Q2-2018
Permits
The ringing in of 2014 also saw an increase in the number of producing wells as a percentage of those permitted. In 2014, the general philosophy was that the HVHF industry needed to permit roughly 5.5 oil wells or 7 gas wells to generate one producing well. Since 2014, however, this ratio has dropped to 2.2 for oil and 1.4 for gas well permits.
Put another way, the industry’s ability to avoid dry wells has increased by 13% for oil and 18% for gas per year. As of Q2-2018, viable oil wells stood at 44% of permitted wells while viable gas wells amounted to 71% of the permitted inventory (Figure 4).
Production declines
from the top-left to the bottom-right
To understand how quickly production is declining in Ohio, we compiled annual (2011-2012) and quarterly (Q1-2013 to Q2-2018) production data from 2,064 unconventional laterals.
First, we present average data for the nine oldest wells with respect to oil and gas production on a per day basis (Note: Two of the nine wells we examined, the Geatches MAH 3H and Hosey POR 6H-X laterals, only produced in 2011-2012 when data was collected on an annual basis preventing their incorporation into Figures 6 and 7 belwo). From an oil perspective, these nine wells exhibited 44% declines from year 1 to years 2-3 and 91% declines by 2018 (Figure 5). With respect to natural gas, these nine wells exhibited 34% declines from year 1 to years 2-3 and 79% declines by 2018 (Figure 5).
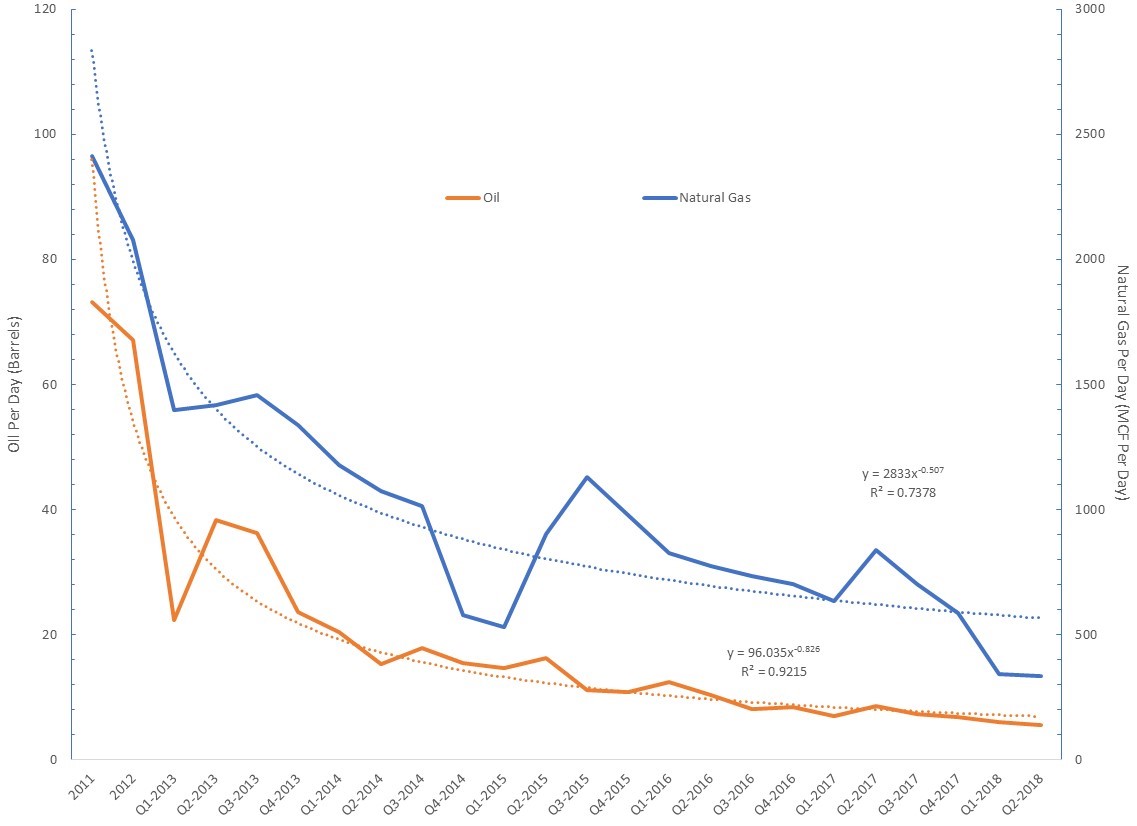
Figure 5. Average daily oil and gas production decline curves for the above seven hydraulically fractured laterals in Ohio’s Utica Shale Basin, 2011 to Q2-2018
Four of the nine wells demonstrated 71% declines by the second and third years and nearly 98% declines by by Q2-2018 (Figure 6). These declines lend credence to recent headlines like Fracking’s Secret Problem—Oil Wells Aren’t Producing as Much as Forecast in the January 2nd issue of The Wall Street Journal. Four of the nine wells demonstrated 49% declines by the second and third years and nearly 81% declines by Q2-2018 (Figure 7).
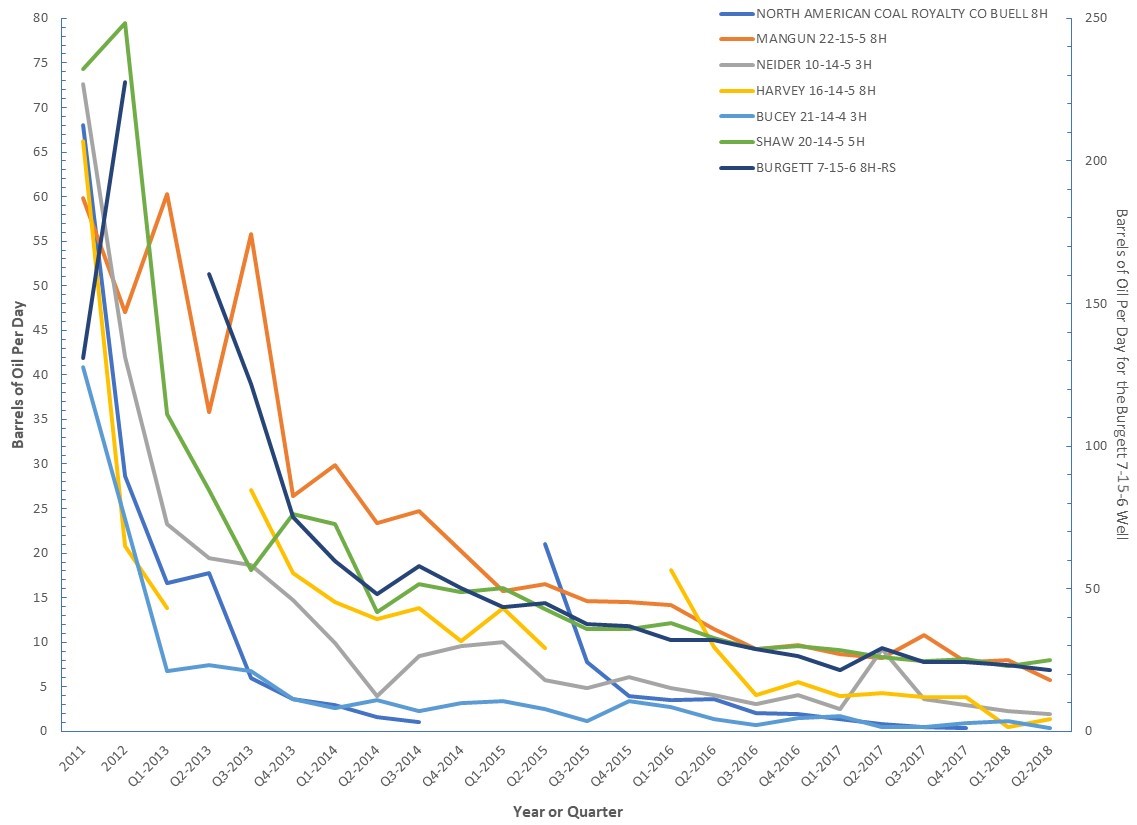
Figure 6. Oil production decline curves for seven hydraulically fractured laterals in Ohio’s Utica Shale Basin from 2011 to Q2-2018
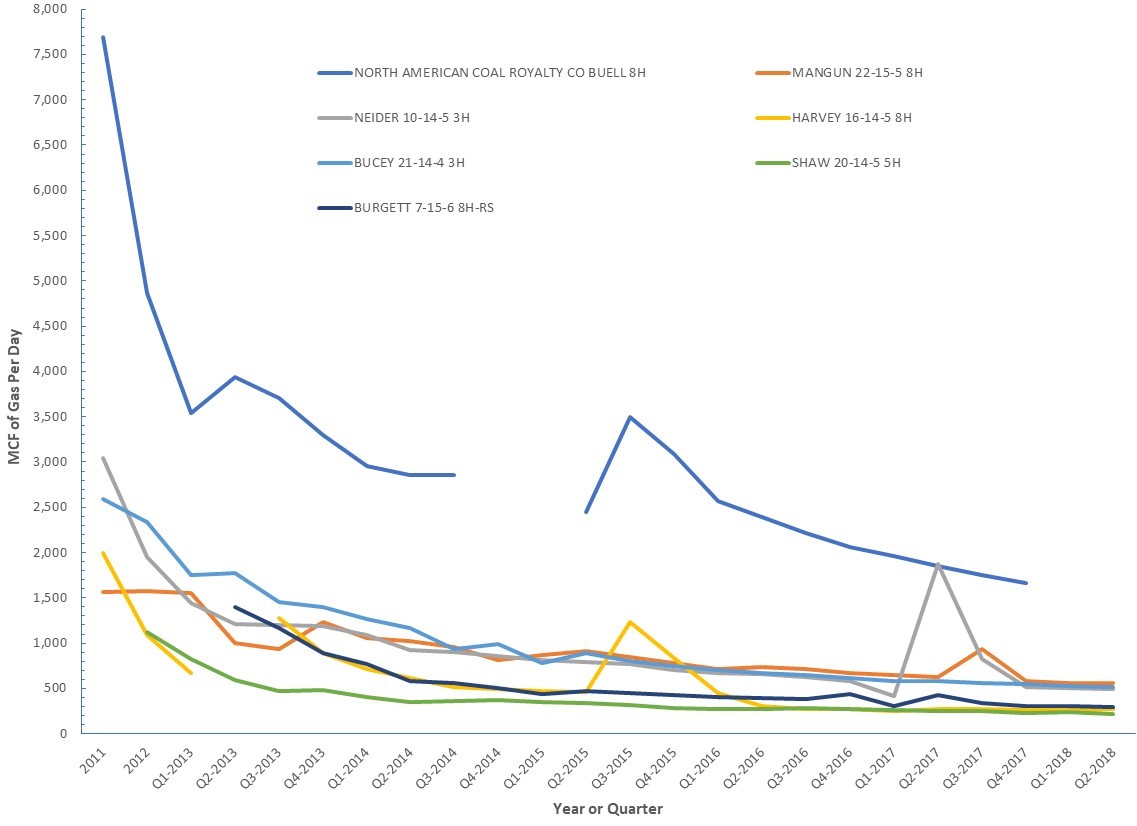
Figure 7. Natural gas production decline curves for seven hydraulically fractured laterals in Ohio’s Utica Shale Basin from 2011 to Q2-2018
Fracking waste, lateral length, and water demand
from bottom-left to the top-right
An analysis of fracking’s environmental and economic impact is incomplete if it ignores waste production and disposal. In Ohio, there are 226 active Class II Salt Water Disposal (SWD) wells. Why so many?
- Ohio’s Class II well inventory serves as the primary receptacle for HVHF liquid waste for Pennsylvania, West Virginia, and Ohio.
- The Class II network is situated in a crescent shape around the state’s unconventional wells. This expands the geographic impact of HVHF to counties like Ashtabula, Trumbull, and Portage to the northeast and Washington, Athens, and Muskingum to the south (Figure 8).
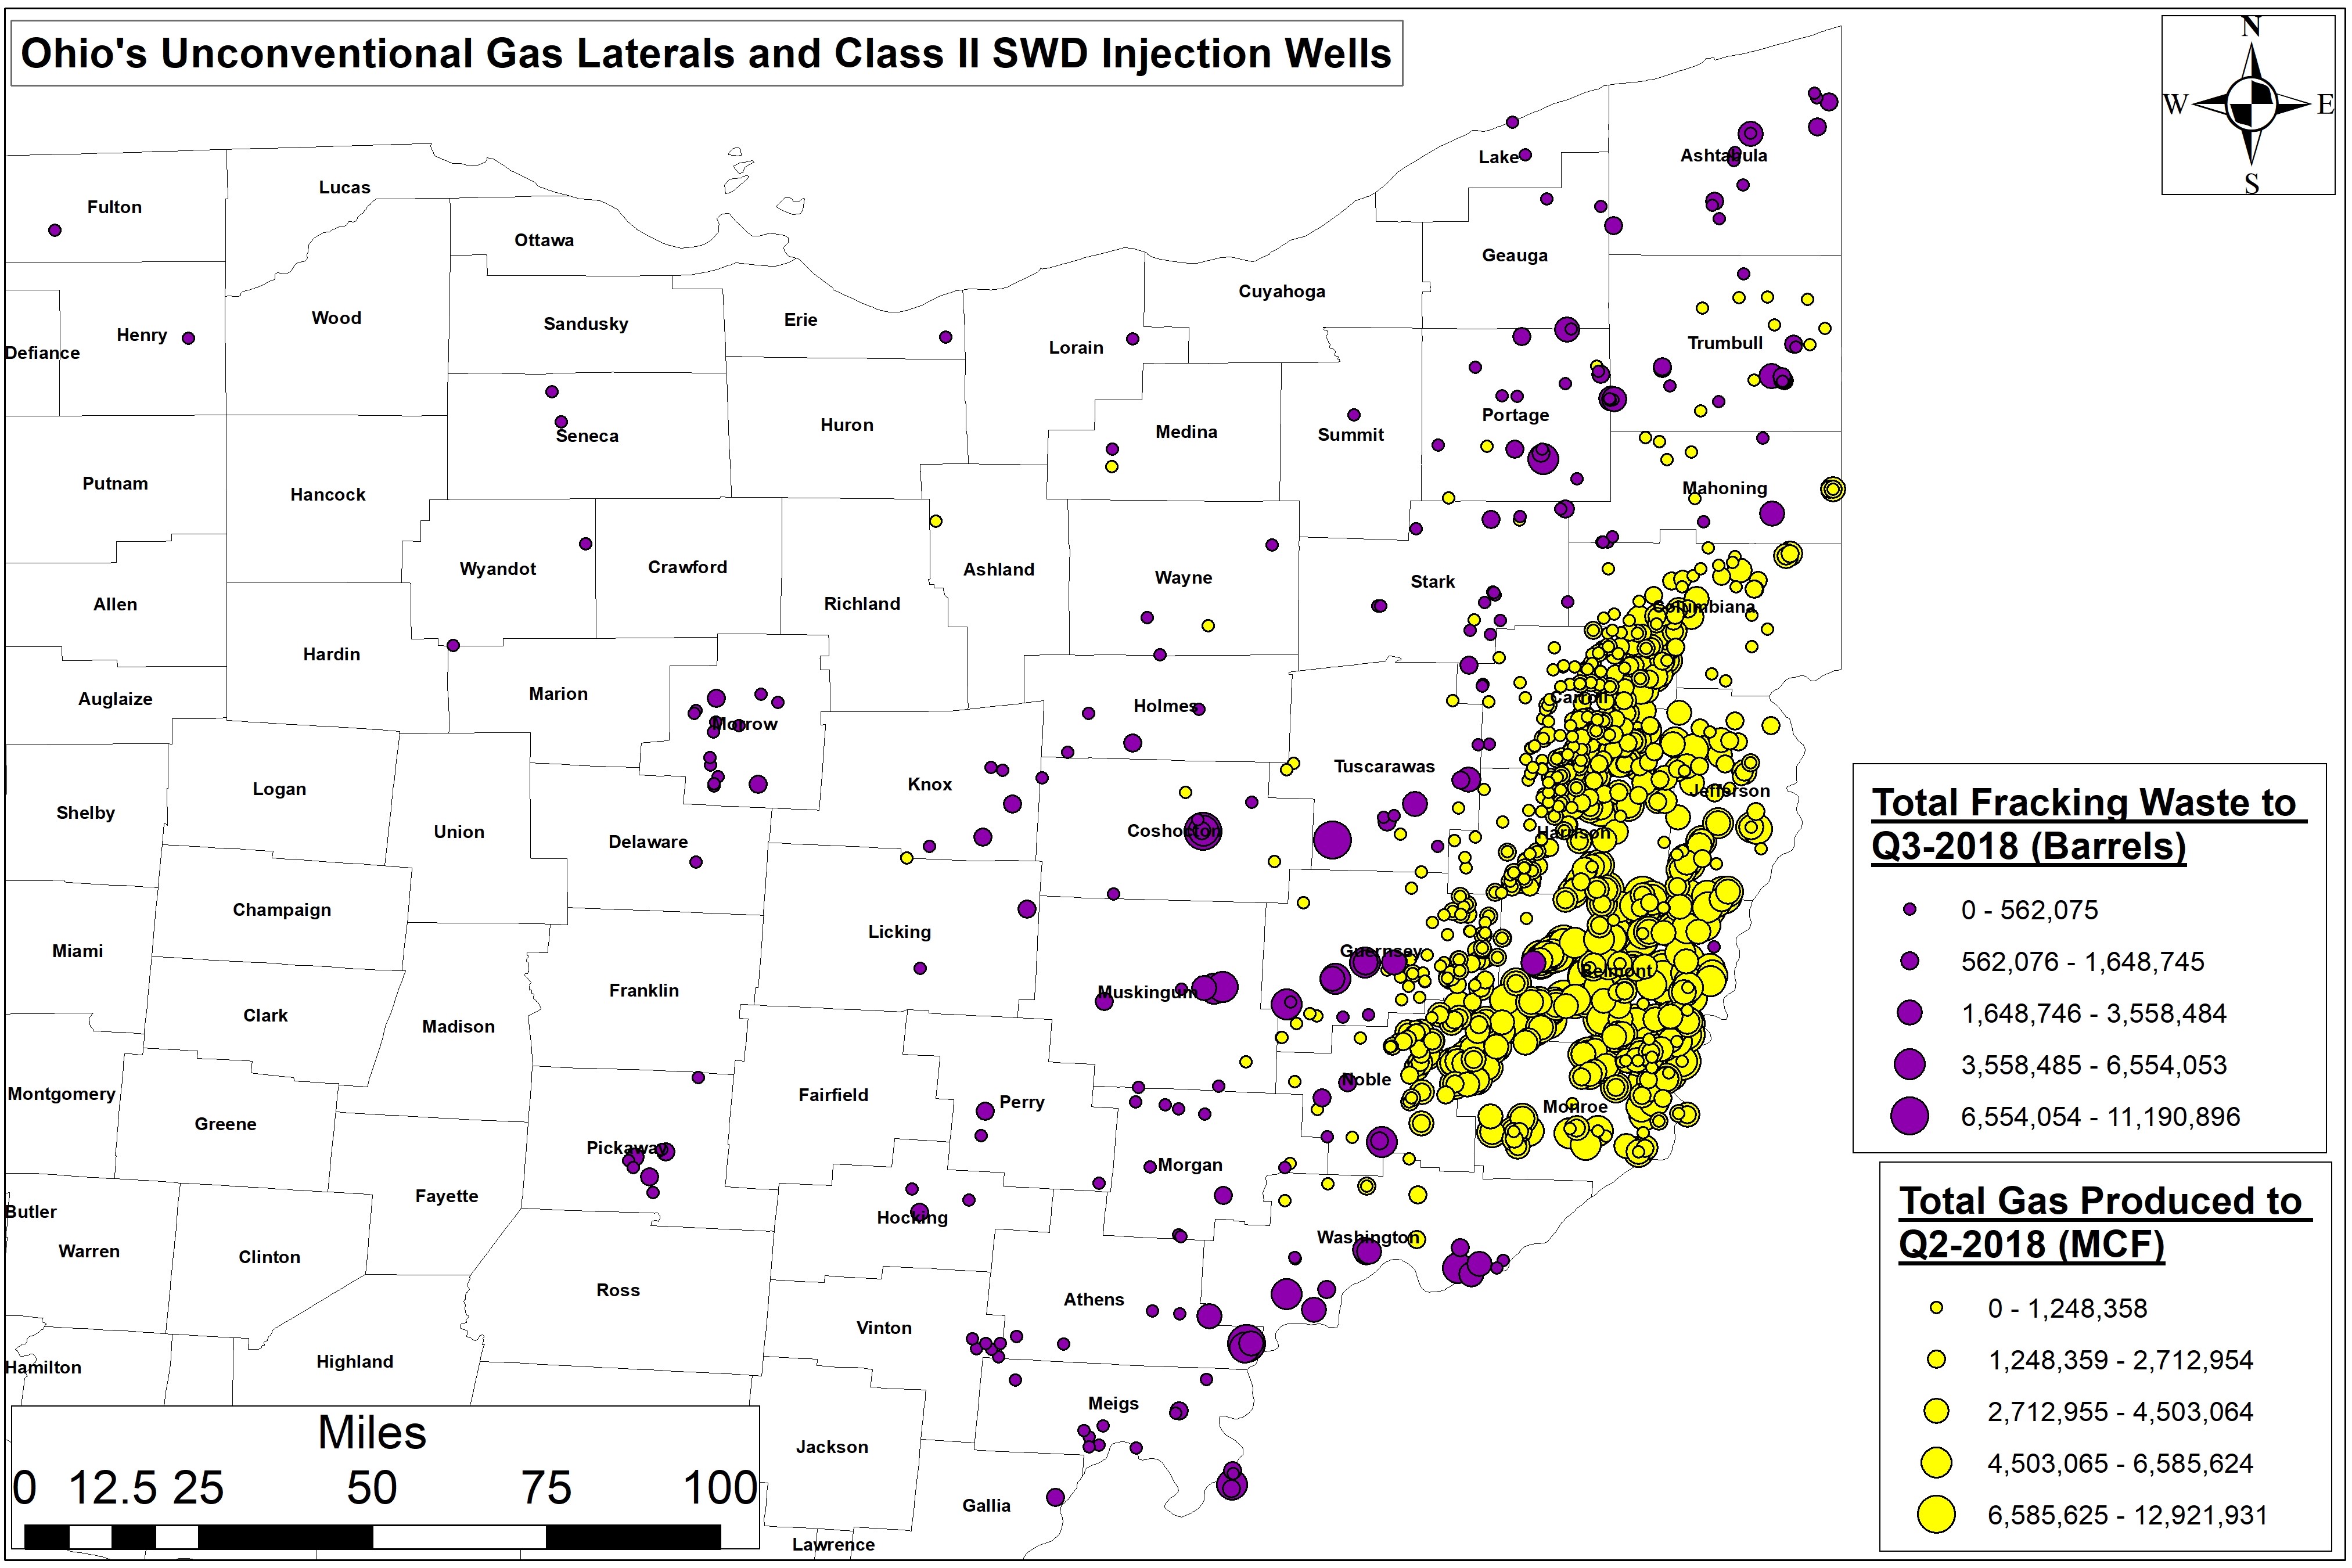
Figure 8. Ohio’s unconventional gas laterals and Class II salt water disposal injection wells. Weighted by cumulative production and waste disposal volumes to Q3-2018.
Disposal Rates
We graphed average per well (barrels) and cumulative (million barrels) disposal rates from Q3-2010 to Q3-2018 for these wells. The data shows an average increase of 24,822 barrels (+1.05 million gallons) per well, each year.
That’s a 51% per year increase (Figure 9).
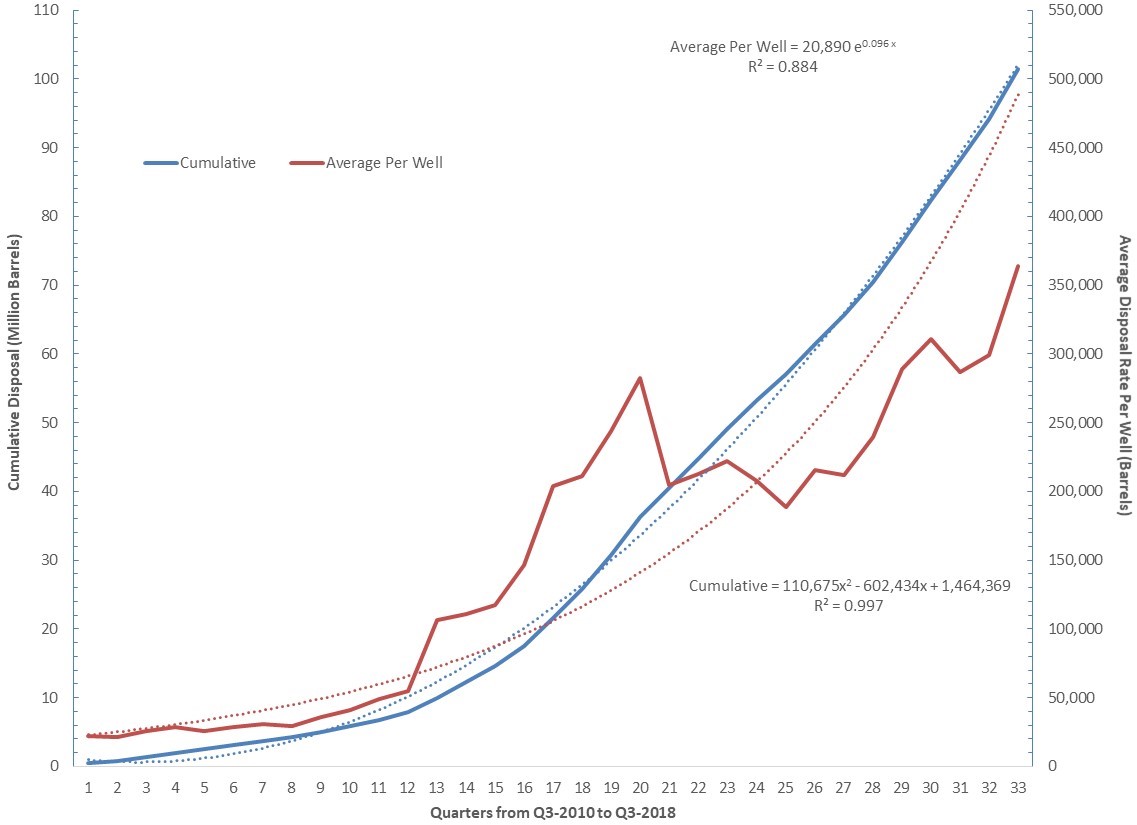
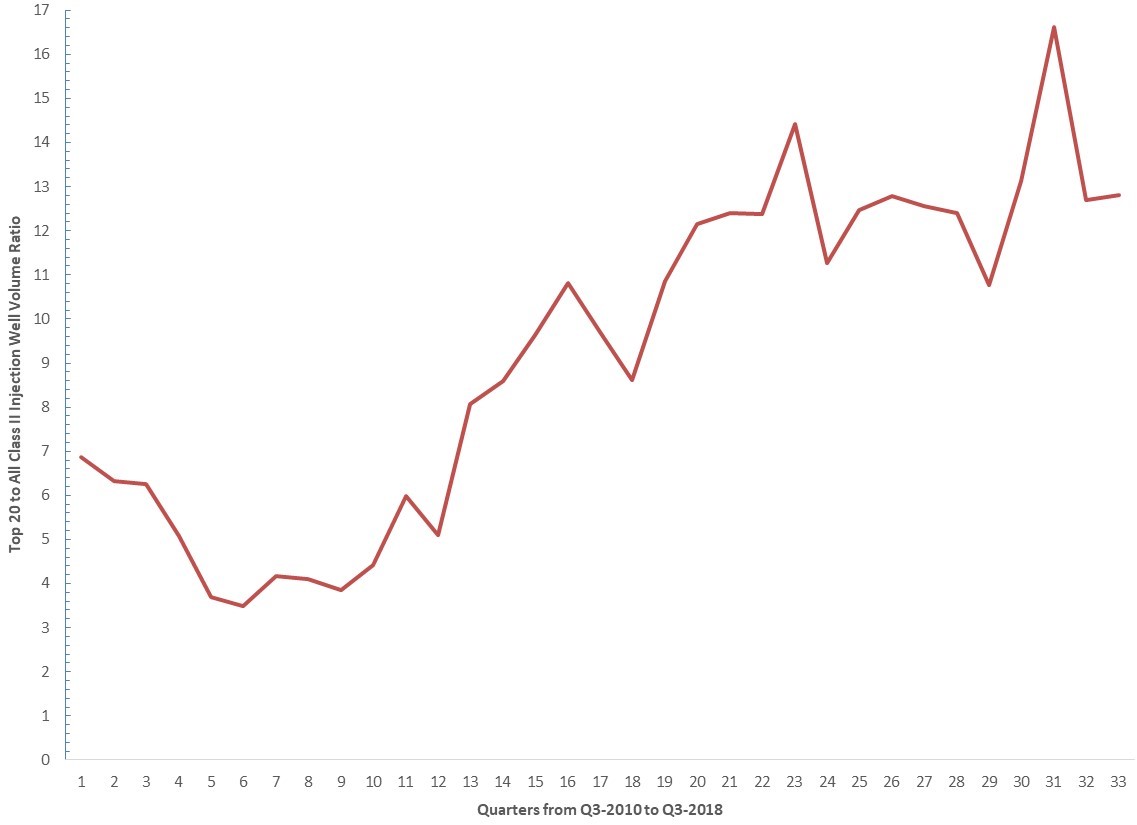
A deeper dive into the data reveals that the top 20 most active Class II wells are accepting more waste than ever before: an astounding annual per well increase of 728,811 barrels (+30.61 million gallons) or a 230% per year increase (Figure 10). This divergence resulted in the top 20 wells disposing of 4.95 times the statewide average between Q3-2010 and Q2-2013. They disposed 13.82 times the statewide average as recently as Q3-2018 (Figure 11).
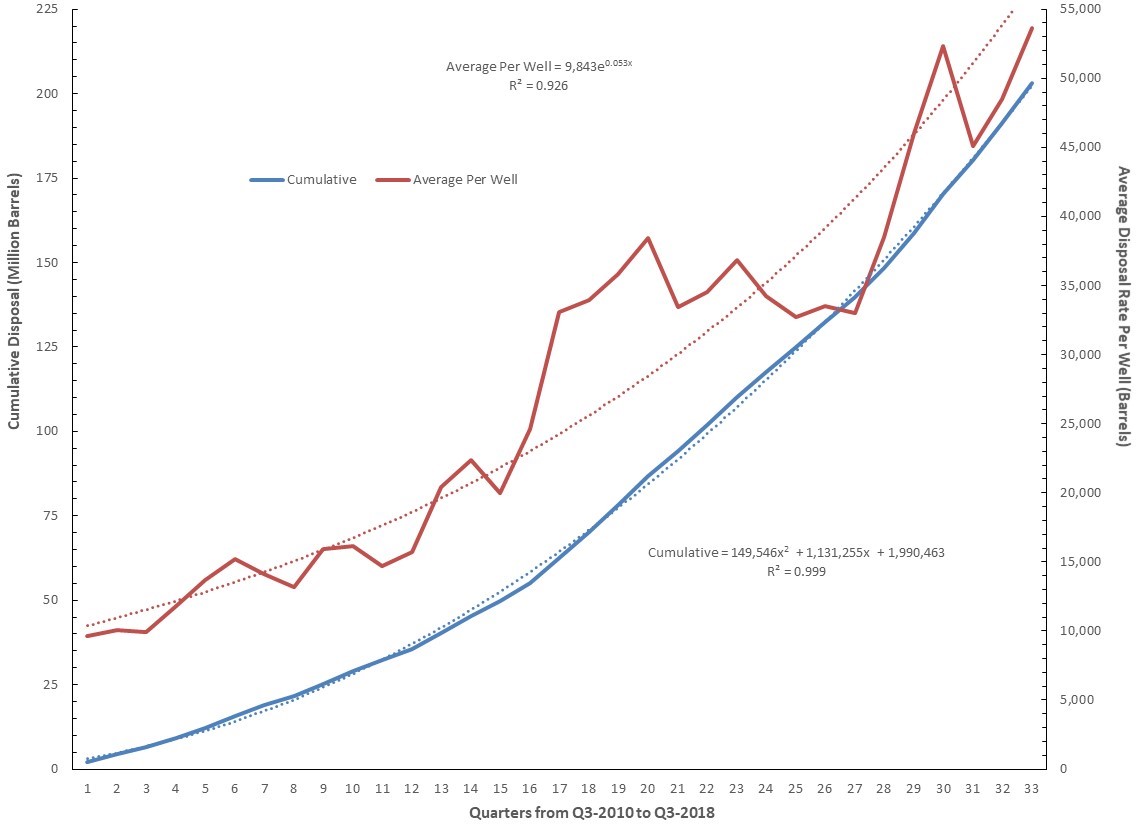
Cumulative and average well volumes for all 226 of Ohio’s Class II Salt Water Disposal wells from Q3-2010 to Q3-2018
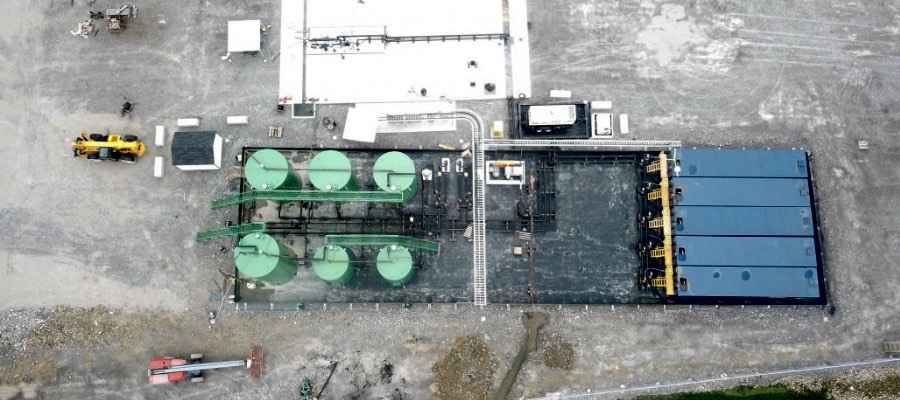
All of this means that we are putting an increasing amount of pressure on fewer and fewer wells. The trickle out, down, and up of this dynamic will foist a myriad of environmental and economic costs to areas surrounding wells. As an example, the images below are injection wells currently under construction in Brookfield, Ohio, outside Warren and minutes from the Pennsylvania border.

 Injection Well under construction, Brookfield, Ohio")
 Injection Well construction entrance, Brookfield, Ohio")
 Injection Well under construction, Brookfield, Ohio")


 Injection Well under construction, Brookfield, Ohio")
 Injection Well under construction, Brookfield, Ohio")
More concerning is the fact that areas of Ohio that are injection well hotspots, like Warren, are proposing new fracking-friendly legislation. These disturbing bills would lubricate the wheels for continued expansion of fracking waste disposal and permitting. House bills 578 and 393 and Senate Bill 165 monetize and/or commodify fracking waste by giving townships a share of the revenue. Such bills “…would only incentivize communities to encourage more waste to come into their existing inventory of Class II… wells, creating yet another race to the bottom.” Co-sponsors of the bills include Democratic Reps. Michael O’Brien, Glenn Holms, John Patterson, and Craig Riefel.
Lateral Lengths
The above trends reflect an equally disturbing trend in lateral length. Ohio’s unconventional laterals are growing at a rate of 9.1 to 15.6%, depending on whether you buy that this trend is linear or exponential (Figure 12). This author believes the trend is exponential for the foreseeable future. Furthermore, it’s likely that “super laterals” in excess of 3-3.5 miles will have a profound impact on the trend. (See The Freshwater and Liquid Waste Impact of Unconventional Oil and Gas in Ohio and West Virginia.)
This lateral length increase substantially increases water demand per lateral. It also impacts Class II well disposal rates. The increase accounts for 76% of the former and 88% of the latter when graphed against each other (Figure 13).
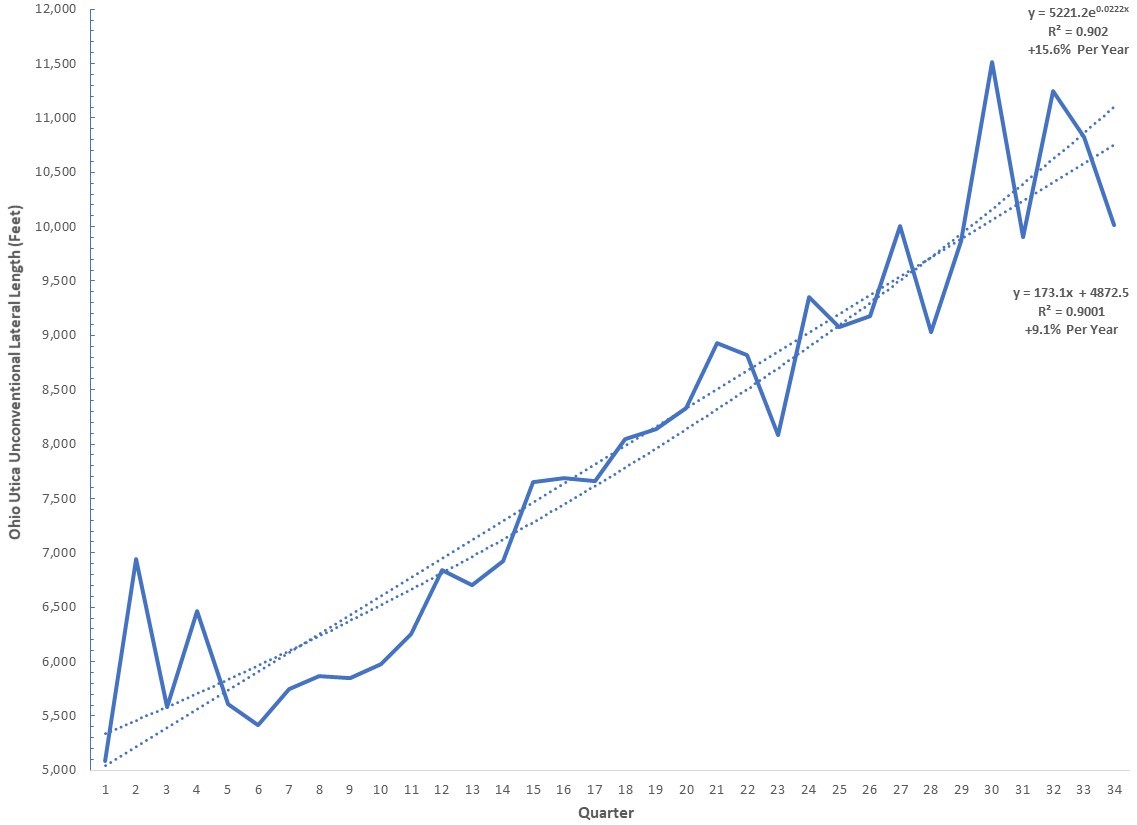
Figure 12. Ohio Utica unconventional lateral length from Q3-2010 to Q4-2018
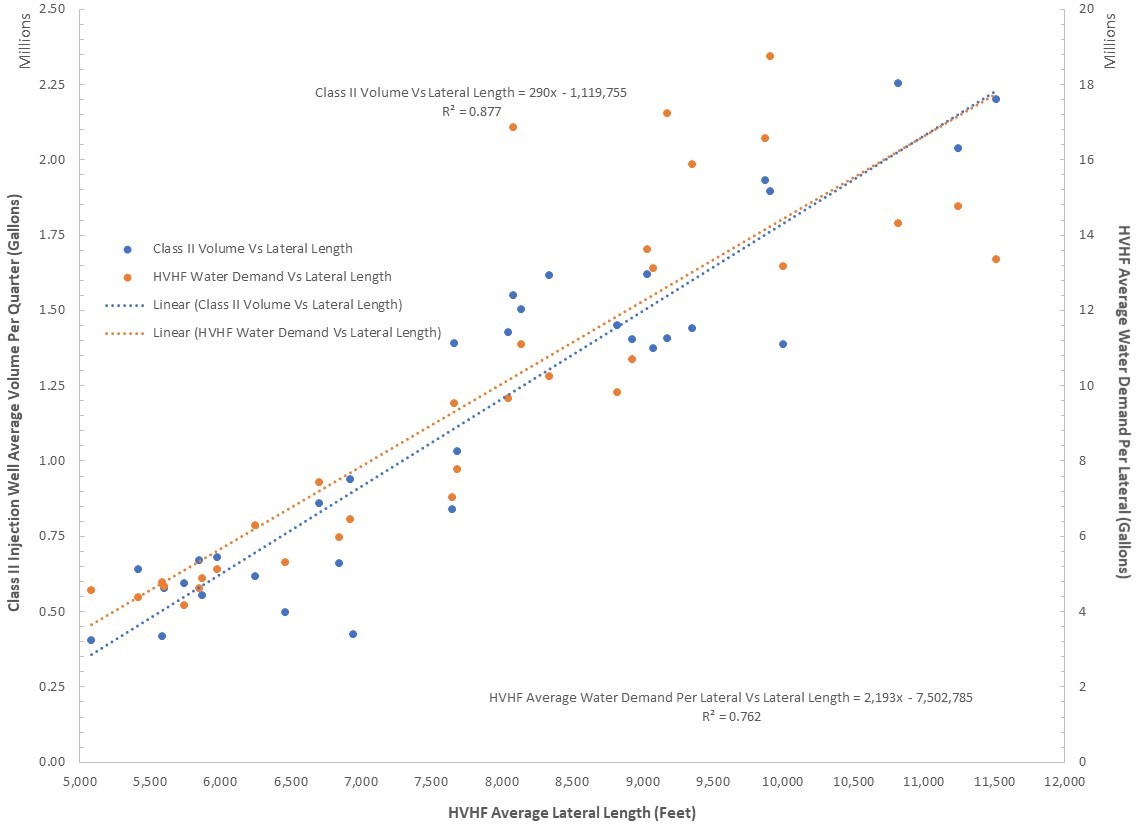
Figure 13. Ohio Utica unconventional water demand and Class II SWD injection well disposal volumes vs lateral length from Q3-2010 to Q4-2018.
Conclusion
This relationship between production, resource demand, and waste disposal rates should disturb policymakers, citizens, and the industry. One way to this problem is to more holistically price resource utilization (or stop oil and gas development entirely).
Unfortunately, states like Ohio are practically giving water away to the industry.
Politicians are constructing legislation that would unleash injection well expansion. This would allow disposal to proceed at rates that don’t address supply-side concerns. It’s startling that an industry and political landscape that puts such a premium on “market forces” is unwilling to address these trends with market mechanisms.
We will continue to monitor these trends and hope to spread these insights to states like Oklahoma and Texas in the future.
By Ted Auch, Great Lakes Program Coordinator, FracTracker Alliance – with invaluable data compilation assistance from Gary Allison
Data Downloads
FracTracker is a proponent of data transparency, and so we often share the data we use to construct our maps analyses. Click on the links below to download the data associated with the present analysis: