Pennsylvania Drilling Trends in 2018
With the new year underway, it’s an opportune moment to reflect on the state of unconventional oil and gas extraction in Pennsylvania and examine a few of the drilling trends. A logical place to start is looking at the new wells drilled in 2018.
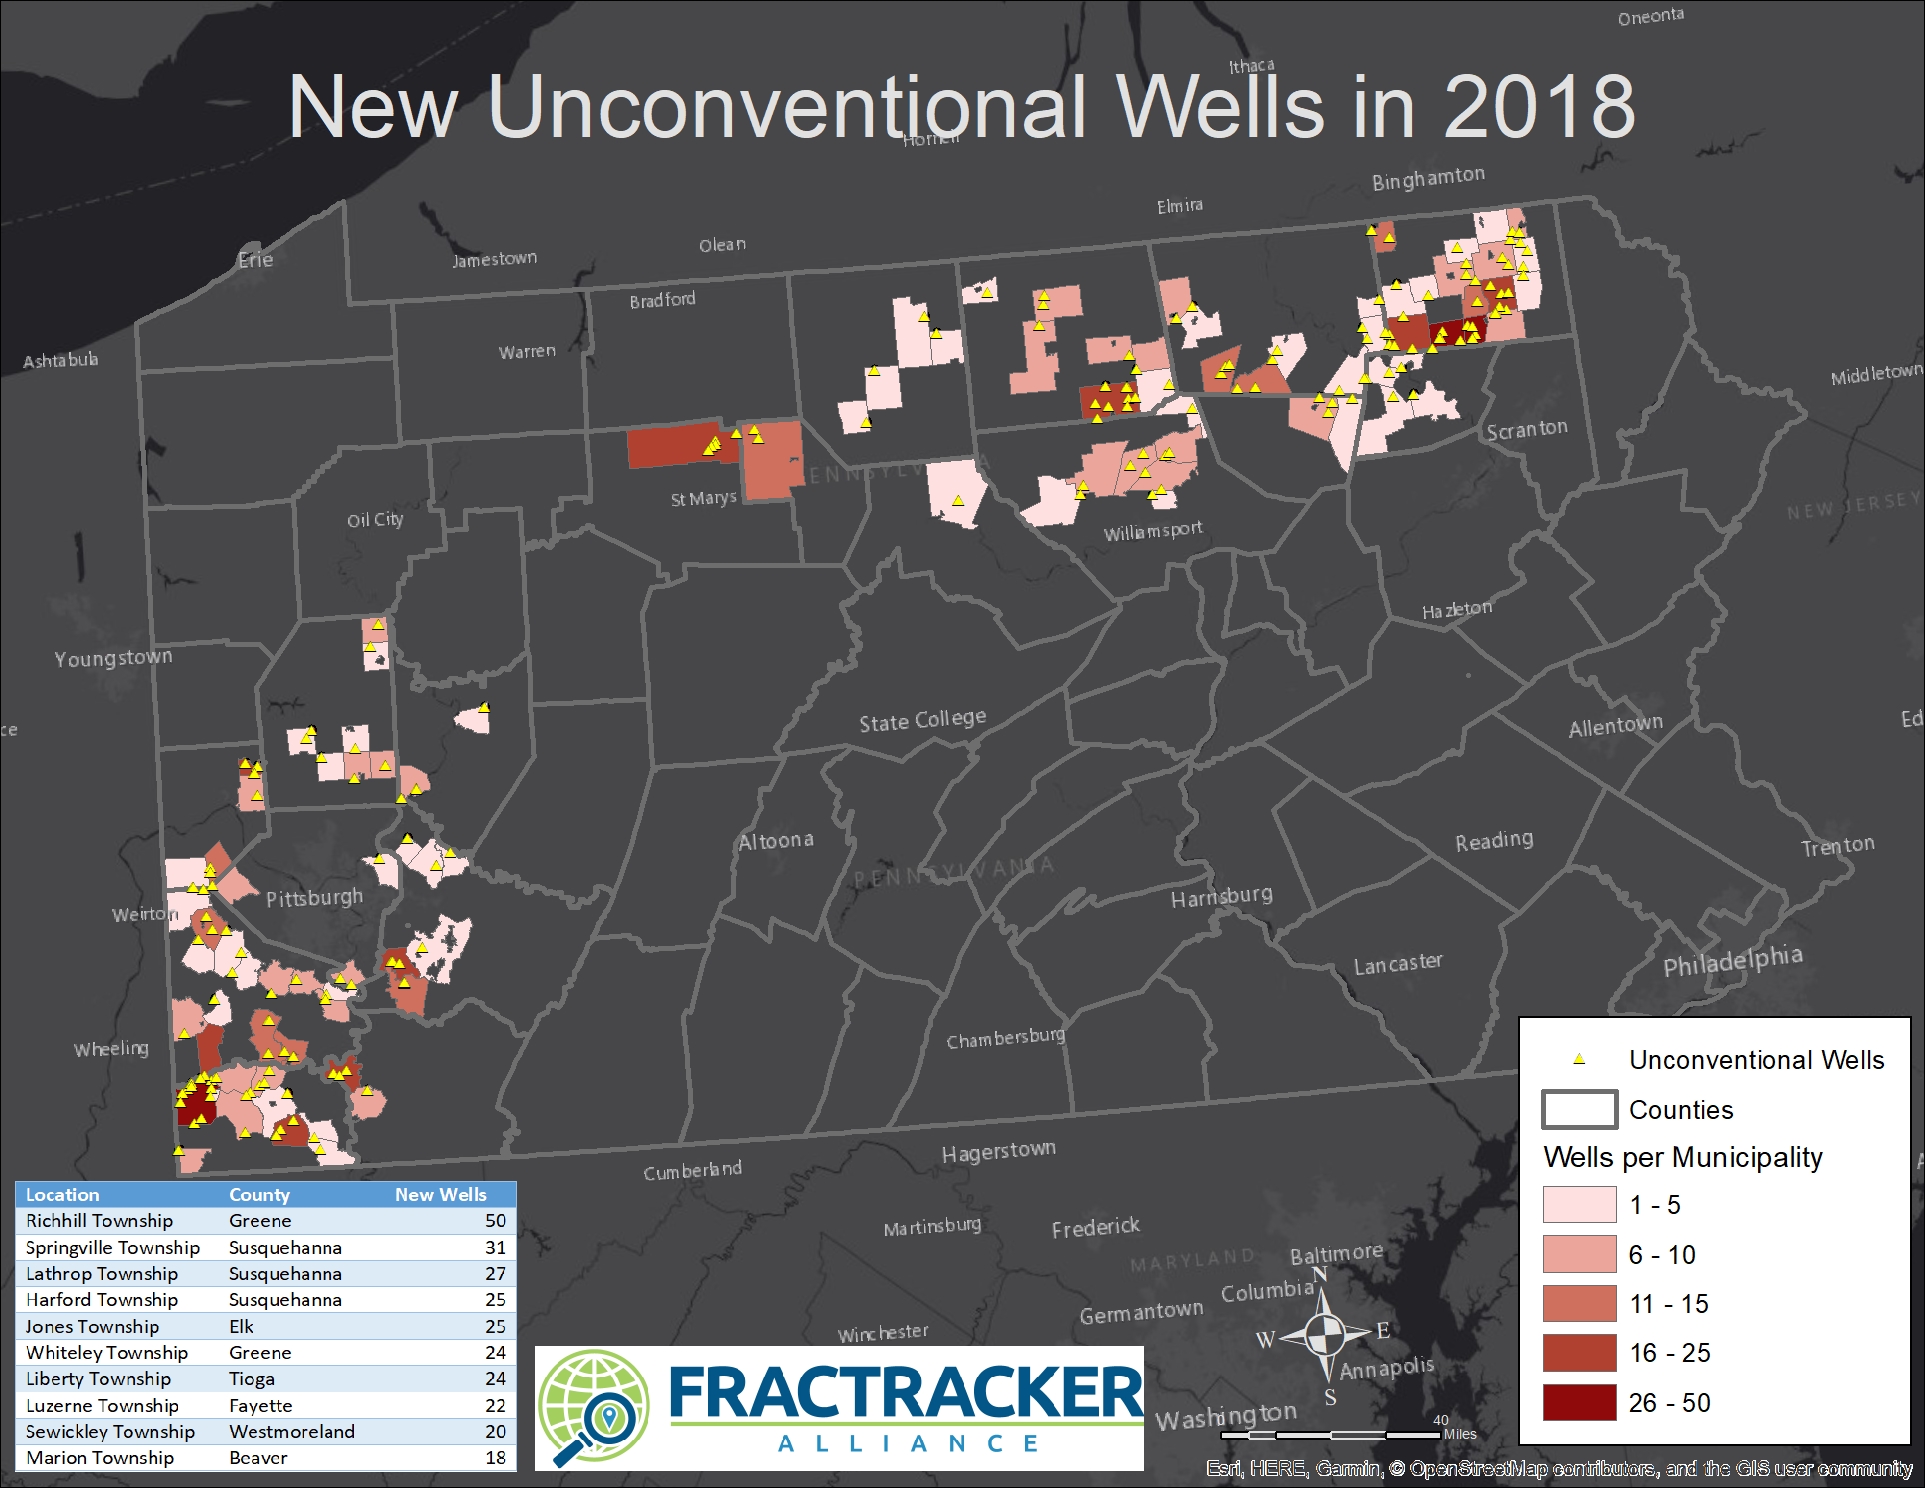
As always, but perhaps even more so than in previous years, unconventional drilling in Pennsylvania is a tale of two shale plays, with hotspots in the southwestern and northeastern corners of the state. The northeastern hotspot seems to be extending westward, including 25 new wells in Jones Township in Elk County (an area shown in dark red near the “St Marys” label on the map). In the southwestern hotspot, the industry continues to encircle Allegheny County, closing in on the City of Pittsburgh like a constrictor.
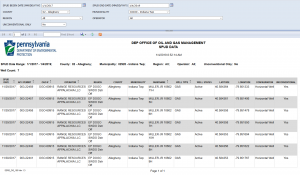
Screen shot showing spud report for Indiana Township, Allegheny County from 1/1/2017 through 1/4/2019. We suspect these spud dates of 11/29/17 and 11/30/17 are incorrect.
Data error? As Pittsburgh-area residents reflect on the past year, some of them must be wondering why a new well pad in Indiana Township, just northeast of the city isn’t shown on the map above. The answer is that the data the Department of Environmental Protection (DEP) has for these wells indicate they were drilled November 29-3o, 2017, although we believe this to be incorrect. FracTracker obtained the data from the Spud Report on January 2, 2019, which indicates seven wells spudded in that two day span on the “Miller Jr. 10602” well pad. This activity drew considerable opposition from families in the Fox Chapel School district in May of 2018, and was therefore widely reported on by the media. An article published on WESA indicates an expected drill date of July 2018, for example.
It turns out the new year is also a good time to remember that our understanding of the oil and gas industry around us is shaped, molded, and limited by the availability and quality of the data. We brought the Indiana Township data error to the attention of DEP, which only confirmed that the operator (Range Resources) entered the spud dates into the DEP’s online system. Perhaps these well were drilled in November of 2018 not 2017? There is even a possibility these wells have yet to be drilled.
Here are a few more dissections of the data, such as it is:

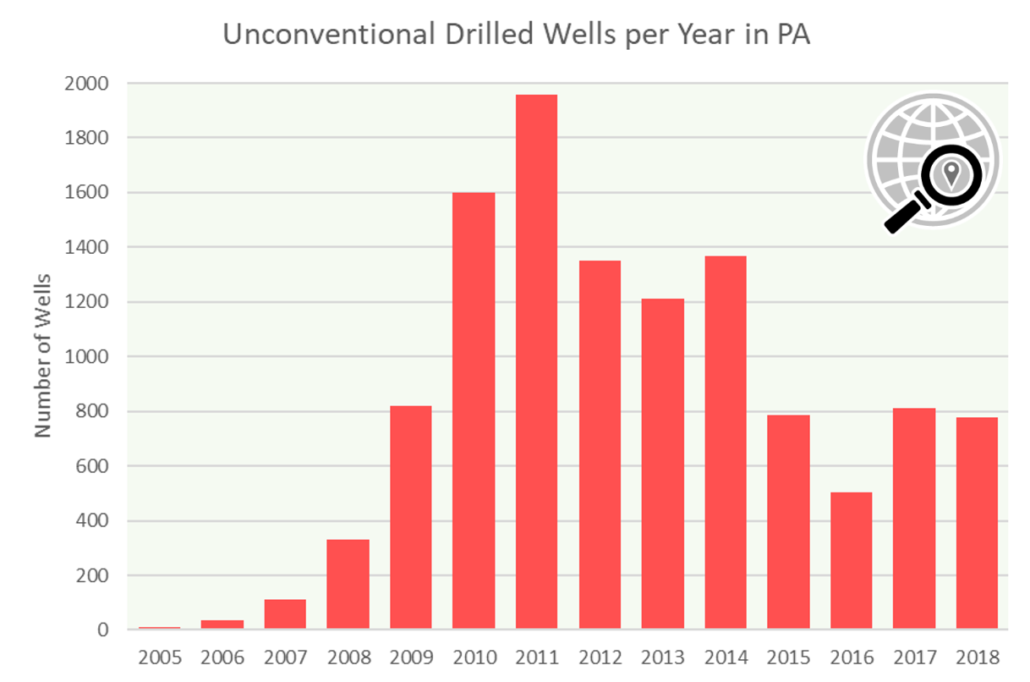
Figure 1: Unconventional wells drilled in PA by year: 2005 to 2018
Wells Drilled Over Time
Barring more widespread data issues, the status of a handful of wells in Indiana Township does not have much of an impact on the overall trend of drilling in the state. There were 779 wells on the report, representing just under 40% of the total from the peak year of 2011, when industry drilled 1,958 wells. The year 2019 was the fourth year in a row where the industry failed to drill 1,000 wells, averaging 719 per year over that span. In contrast, the five years between 2010 and 2014 saw an average of 1,497 wells per year, more than twice the more recent average. As mentioned in our Hazy Future report, projections based on very aggressive drilling patterns are already proving to be out of phase with reality, although petrochemical commodity markets might change drastically in the coming decades.
How long before wells are plugged?
We also like to periodically check to see how long these wells stay in service. In Pennsylvania, there are two relevant well statuses worth following: plugged and regulatory inactive. While there are a number of conditions that characterize regulatory inactive wells, they are essentially drilled wells that are not currently in production, but may have “future utility.” Therefore, the wells are not required to be permanently plugged at this time.
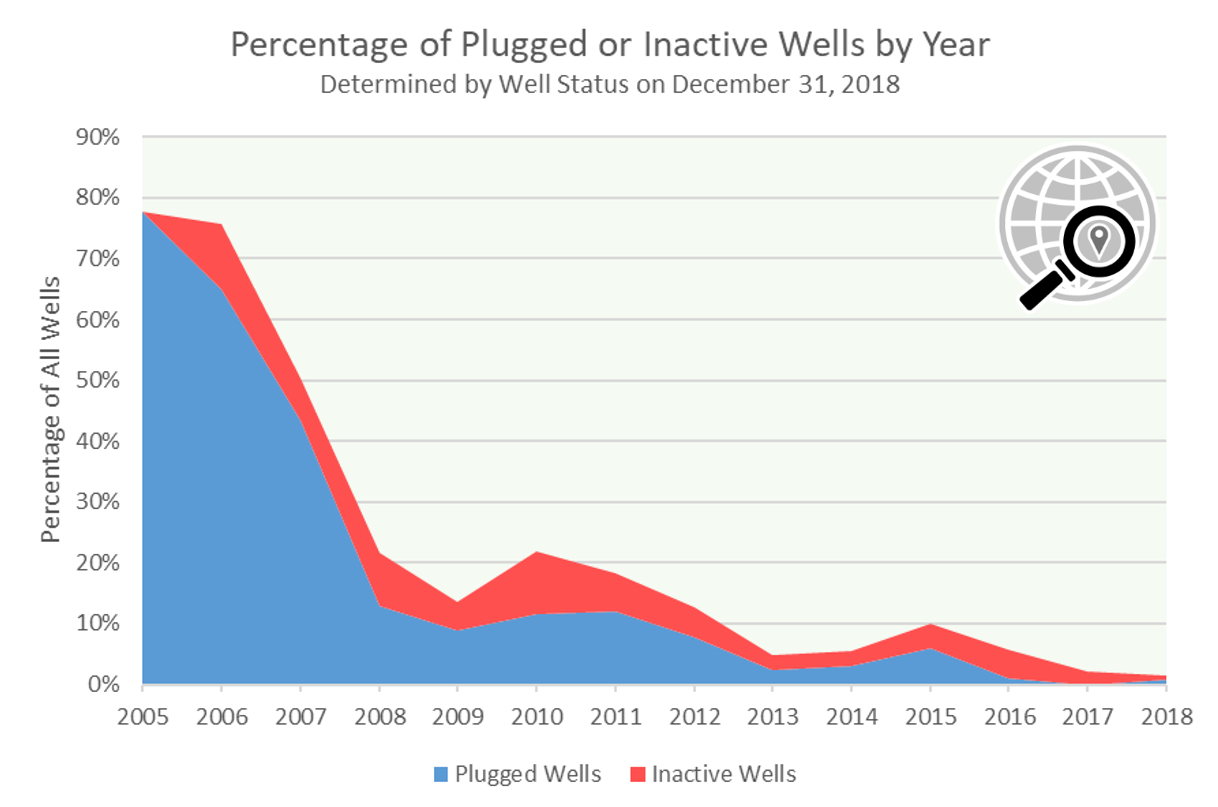
Figure 2: This chart shows the percentage of unconventional wells drilled since 2005 with a plugged or regulatory inactive status as of December 31, 2018.
In order to understand some of the finer points, it’s best to use Figure 1 (above) in conjunction with Figure 2. We can see that most of the wells drilled in the initial years of the Marcellus boom have already been plugged, although Figure 1 shows us that the sample size is fairly low for these years. In 2005, for example, 7 of the 9 (78%) unconventional wells drilled in the state that year are already plugged. The following year, 24 of the 37 (65%) wells drilled are now plugged, and an additional 4 (11%) wells have a regulatory inactive status as of the end of 2018. The following year, the combined plugged and inactive wells account for just over 50% of the 113 wells drilled that year, and this trend continues along a fairly predictable curve. An exception is the noticeable bump around the most active drilling years of 2010 and 2011, where there are slightly more wells with a plugged or inactive status than might be expected. It is interesting to note that even the most recent wells are not immune to being plugged, including 8 plugged wells and 4 inactive wells drilled in 2018 that were not able to get past their very first year in production.
Overall, of the 11,675 drilled wells accounted for on this graphic, 851 (7%) are plugged already, with an additional 572 (5%) of wells with an inactive status. Unconventional wells that are 11 years old have a roughly 50% chance of being plugged or inactive, and we would therefore expect to see the number of these wells skyrocket in the coming years before leveling off, roughly mirroring the drilling boom and subsequent slowdown of Marcellus Shale extraction in Pennsylvania.
Conclusions
Many factors contribute to fluctuations in drilling trends for the Marcellus Shale and other unconventional wells in Pennsylvania. Very cold winters result in high consumption by residential and commercial users. New gas-fired power plants can increase the demand for additional drilling. Recessions and economic conditions are known to reduce the demand for energy as well, and drillers’ heavy debt burdens can slow down operations appreciably. Additionally, other fossil fuel and renewable energy sources compete with one another, altering the market conditions even further. And finally, every oil and gas play eventually reaches a point where the expected results from new wells are not worth the money required to get the hydrocarbons to the surface, and unconventional wells are much more expensive to develop than more traditional operations.
Because of all of these variables, month to month or even year to year fluctuations are not necessarily that telling. On the other hand, a four-year period where drilling is roughly half of previous extraction is significant, and can’t be easily dismissed as a blip in the data.
By Matt Kelso, Manager of Data and Technology, FracTracker Alliance