Wicked Witch of the Waste
The Great Plains has become the unconventional oil & gas industry’s dumping ground, prompting questions about the security and resilience of the bread basket and the underlying Ogalalla Aquifer
Back in December of 2016, FracTracker analyzed the growing link between injection wells that dispose fracking waste and “induced seismicity” [1], or human-caused earthquakes. Our compiled maps from this analysis (including Figure 1 below) show seismic activity in Kansas and Oklahoma along with Class II injection well volumes up through 2015.
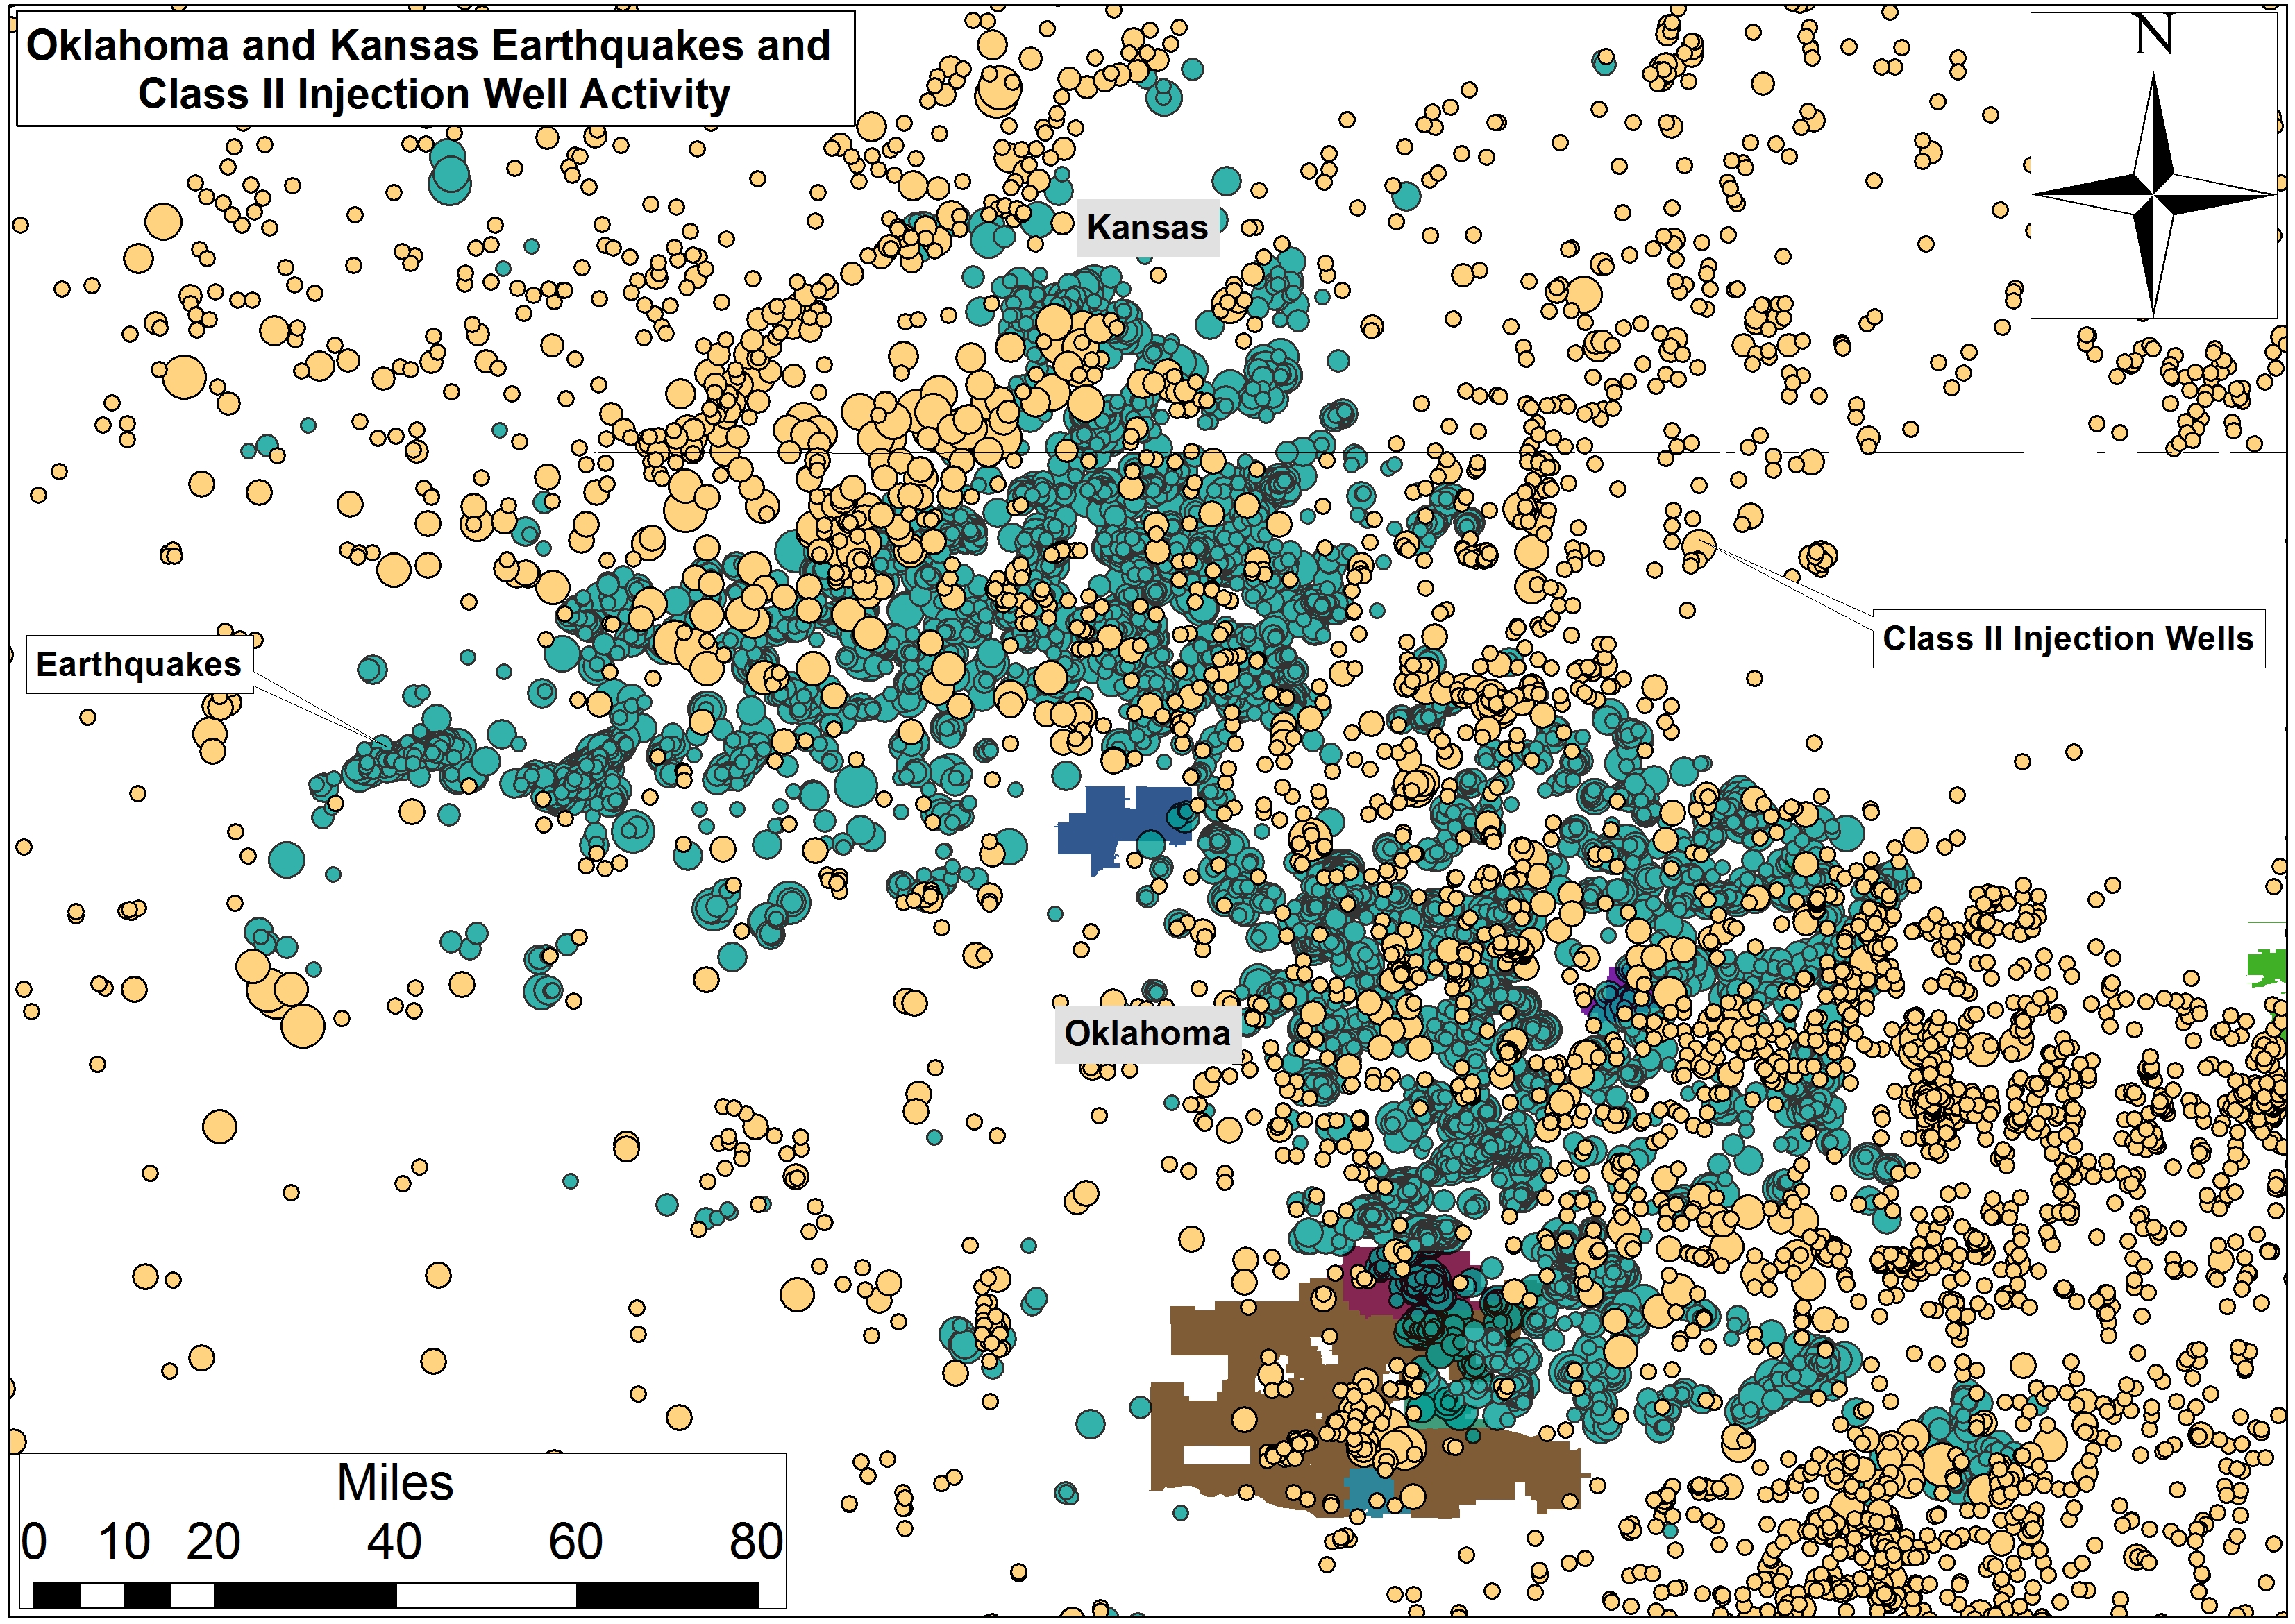
This link was given acute attention at that time as a result of the magnitude 5.8 earthquake in Pawnee, Oklahoma on September 3rd, 2016, followed closely by a 4.5 earthquake on November 1st. The industry’s increased production of waste came home to roost 5 days later when a magnitude 5.0 quake struck a mile west of the “Cushing Hub,” the largest commercial crude oil storage center in North America. The Cushing Hub is capable of storing 54 million barrels of crude – the equivalent of 2.8 times the U.S. daily oil refinery capacity and 3.1 times the daily oil refinery capacity of all of North America.
Sunflower State of Affairs
Since we published this analysis and associated maps, Class II injection wells have been in the news several times across the Great Plains. An investigation by KSN News found that the Kansas Corporation Commission (KCC) improperly permitted over 2,000 Class II injection wells. The KCC stated that public comment periods for well proposals lasted just 15 days, instead of the correct number of 30 days. This amounts to 42% and 28% of the state’s active and total inventory of oil and gas waste receiving wells approved with inaccurate public notices.
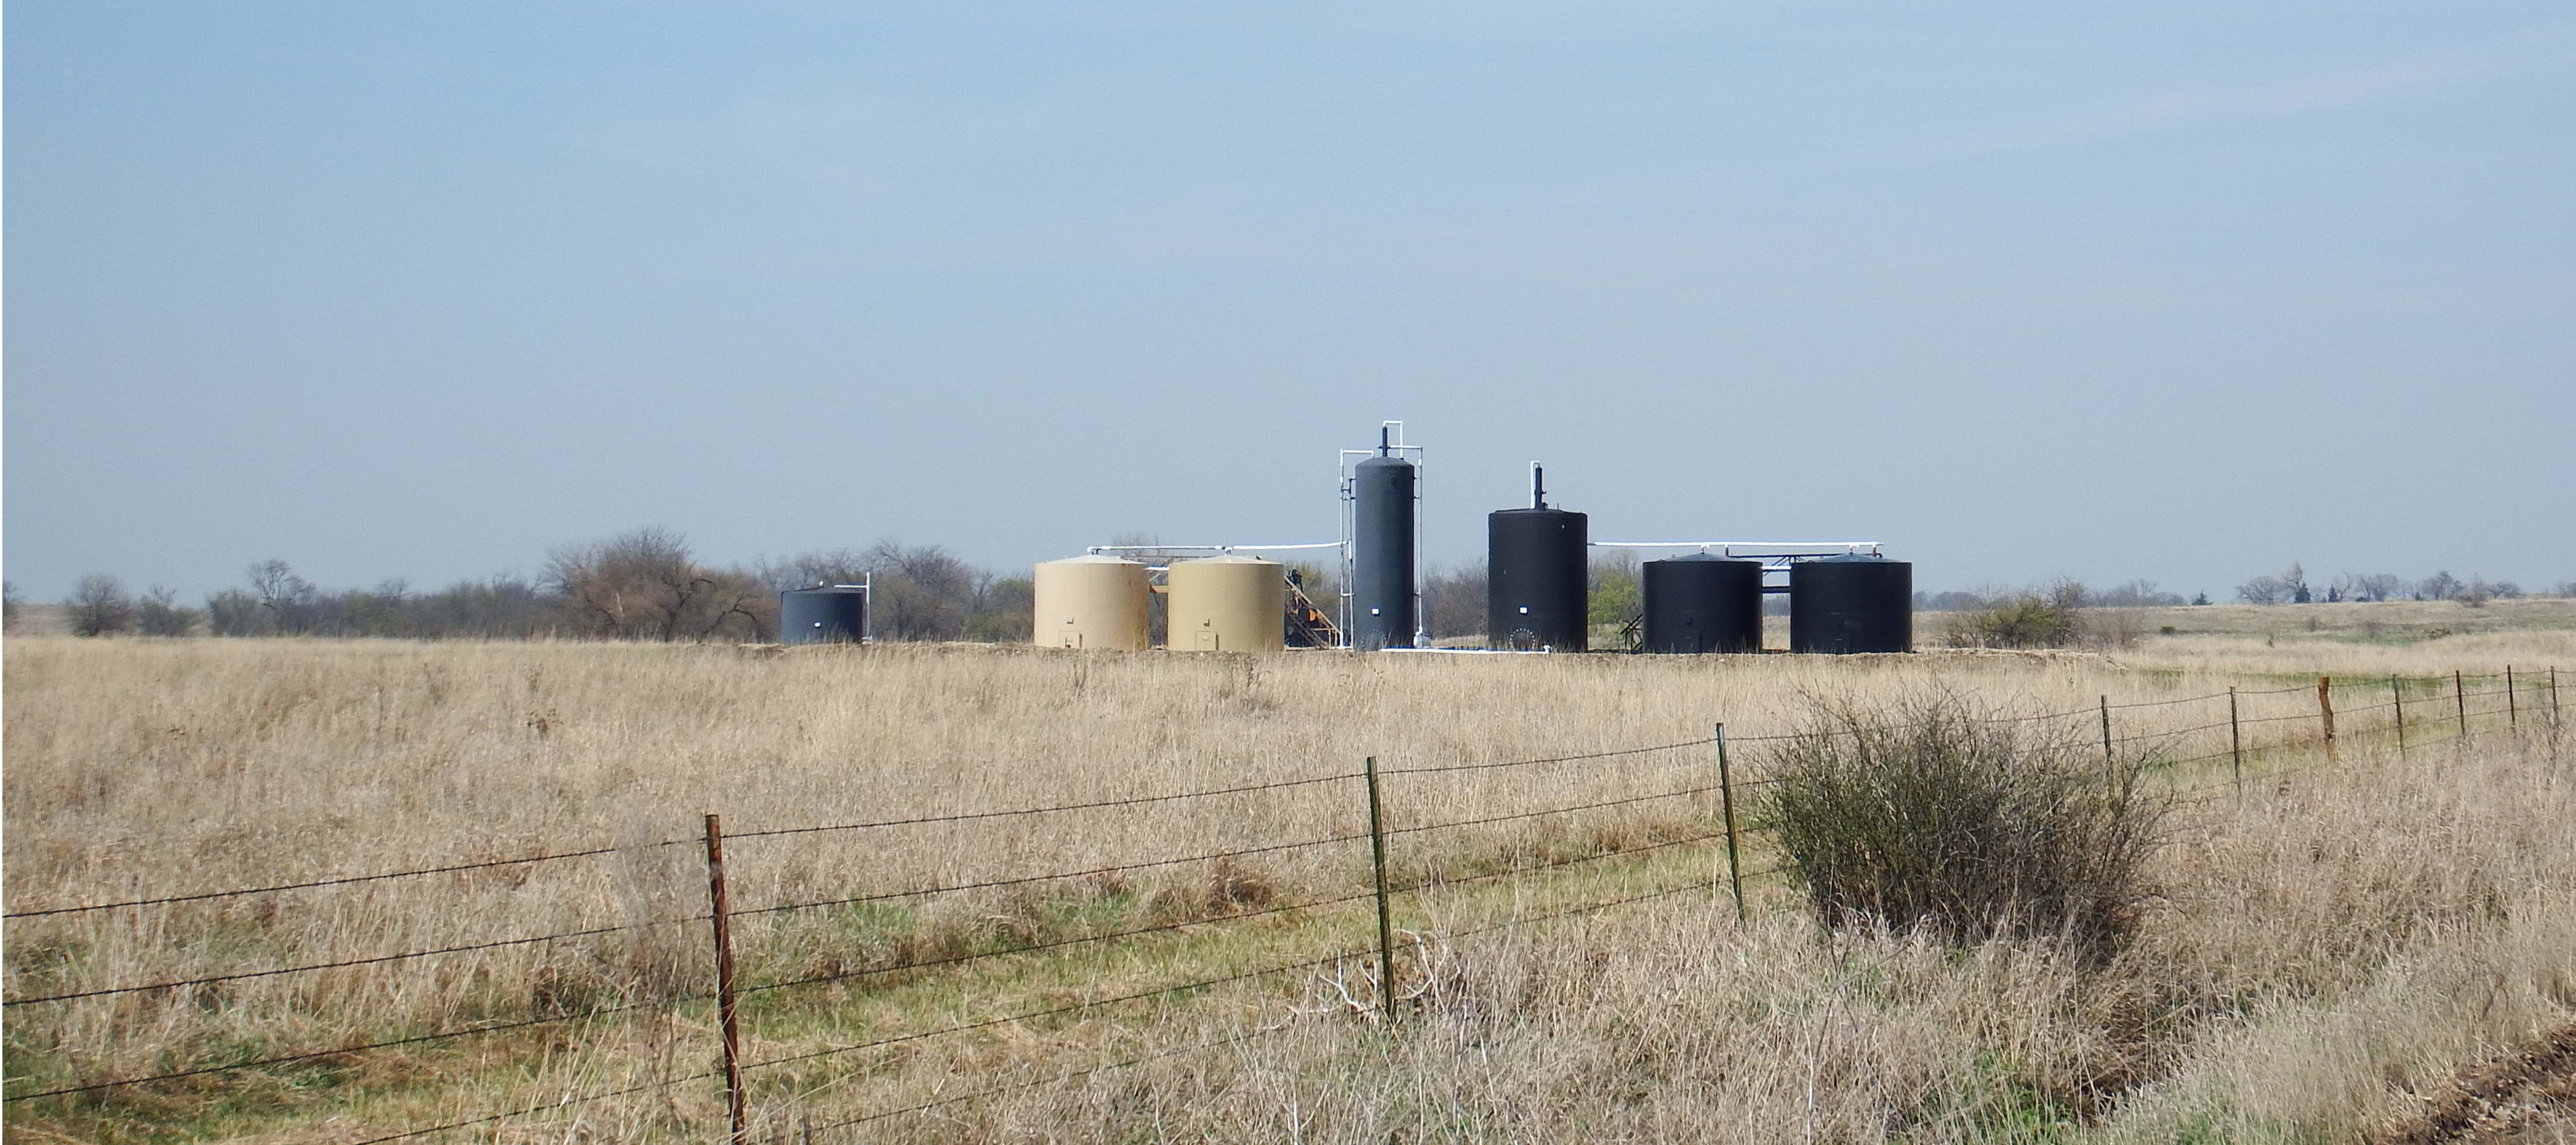
Quail Oil & Gas LC’s Class II Salt Water Disposal (SWD) well, Morris County,
KS near Diamond Creek (Photo Courtesy of Karla jo Grimmett at South 500 photography)
According to Cindy Hoedel, a freelance journalist in Kansas, “the KCC responded to the investigation findings… by ruling that no remedy was needed and closing the docket.”
Attorneys representing the Sierra Club maintain that improper permitting by the KCC continued into the Fall of 2018:
“The significance is they are choking us off in terms of giving us less and less time to try to mount a protest, to submit any kind of comment, and that’s a lot,” Cindy Hoedel, a Matfield Green resident who has complained about earthquakes in her area, said… “These notices get published in these tiny little newspapers, and sometimes it might take us 15 days before we find it”
As Ms. Hoedel wrote in an email when I asked her to comment on issues relating to Kansas’ Class II injection wells:
“The Republican controlled Kansas Legislature is trying to fend off several proposed bills that would reform the KCC (the regulatory body that oversees the permitting of Class II underground injection control wells). Citizen challenges of individual applications for disposal and EOR [enhanced oil recovery] wells continue, with the KCC moving more aggressively than in the past to dismiss protestants before a hearing is held. Some of these dismissals are being challenged in appellate court. The activists’ view is that EPA, the SWDA [Safe Water Drinking Act] and Congress clearly intend for the public to be able to participate in the regulatory process; instead, KCC has written regulations that are effectively barriers to participation… Activists have questions about the large number of EOR wells being applied for in Kansas and what their true purpose is, given the insignificant amounts of oil being produced compared to high volumes of injected fluids. Another concern is that the injection well earthquakes in Oklahoma and Kansas continue, yet KCC refuses to add regs that would address seismic risk in permit applications. There is also a problem with harassment of citizens exercising their right to protest – Scott Yeargain and I were both turned in to the Kansas AG’s office by a KCC staffer on the bogus claim that we were practicing law without a license because we helped explain the convoluted process to other protesters.”
Grapes of Wrath
Meanwhile, across the border, Oklahoma City and its surrounding suburbs have become the San Francisco of the Great Plains, with regular earthquake swarms (including many that exceed magnitude 4.0). According to Think Progress reporter Samantha Page, despite the damages and lawsuits caused by these earthquakes, “for years, the state was slow to respond, while Gov. Mary Fallin (R) and others questioned the link to human activity.”
Eventually, by the end of 2016, the Oklahoma Corporation Commission responded by implementing a ‘traffic light’ protocol, in which operations are paused or stopped altogether following earthquakes of certain magnitudes. For a time, the EPA demanded a moratorium on disposal across Class II wells injecting into the Arbuckle formation in “high seismically active focus areas.”
Chad Warmington, president of the Oklahoma Oil and Gas Association, said that this response by the EPA is “a stellar example of the inefficiency of the federal government…It’s akin to a newspaper telling us today the football scores from games played 15 months ago.”
In reporting on the industry’s response, journalist Paul Monies, buried the lead when he pointed out the following in his second to last paragraph:
“Wastewater recycling remains an expensive option compared to the low costs of disposal wells in Oklahoma. While operators can inject wastewater into formations other than the Arbuckle, Hatfield said other formations don’t accept water as easily and are at shallower depths.”
The Map
Our second stab at mapping the scale and scope of Class II injection wells across the Great Plains is slightly different than our first effort in a few ways:
- This iteration includes Class II Salt Water Disposal (SWD) Injection Wells in Nebraska, Oklahoma, and Kansas on one map. Clicking on a well reveals its location, well name, operator, and the volume of wastewater disposed. Volumes are presented annually for Nebraska and monthly for 2011 to 2017 for Oklahoma and Kansas. We also present annual sums for Oklahoma from 2006 to 2010.
- The map shows Arkansas and Platte River Basin boundaries, which contain the entire inventory of OK, NE, and KS Class II wells.
- We’ve included Hydrologic Unit Codes, which when zoomed in to the map, identify sub-watersheds, and the Ogalalla Aquifer boundary, courtesy of the USGS’s Sharon Qi.
- Finally, we’ve includedUS Forest Service Robert G. Bailey’s Ecoregions to give a sense for the types of ecosystems threatened by the O&G industry’s demand for suitable waste disposal sites

View Map Full Screen | To view the legend on this map, click the “layers” icon on the top left of the screen
Table 1, below, breaks down the volumes of oil and gas wastewater disposed in Oklahoma, Kansas and Nebraska. Volumes are measured in million barrels, with one barrel equivalent to 42 gallons. The number of Class II SWD (salt water disposal) injection wells in these states is separated to show the total number of wells permitted verse the number of wells that were active (receiving waste).
Table 1. Class II injection well volumes in 2017

In total, 3,385,700,000 barrels of wastewater were disposed in 5,975 injection wells in these three states in 2017. The volume of wastewater disposed has increased in recent years (Table 2).
Table 2. Cumulative Class II injection well volumes to 2017, annual percent changes, and likely 2018 and 2027 volumes

In Table 2, the theoretical annual volumes for 2018 and 2027 are predictions based on the average of linear, exponential, and polynomial models.
The Kansas-Oklahoma Border
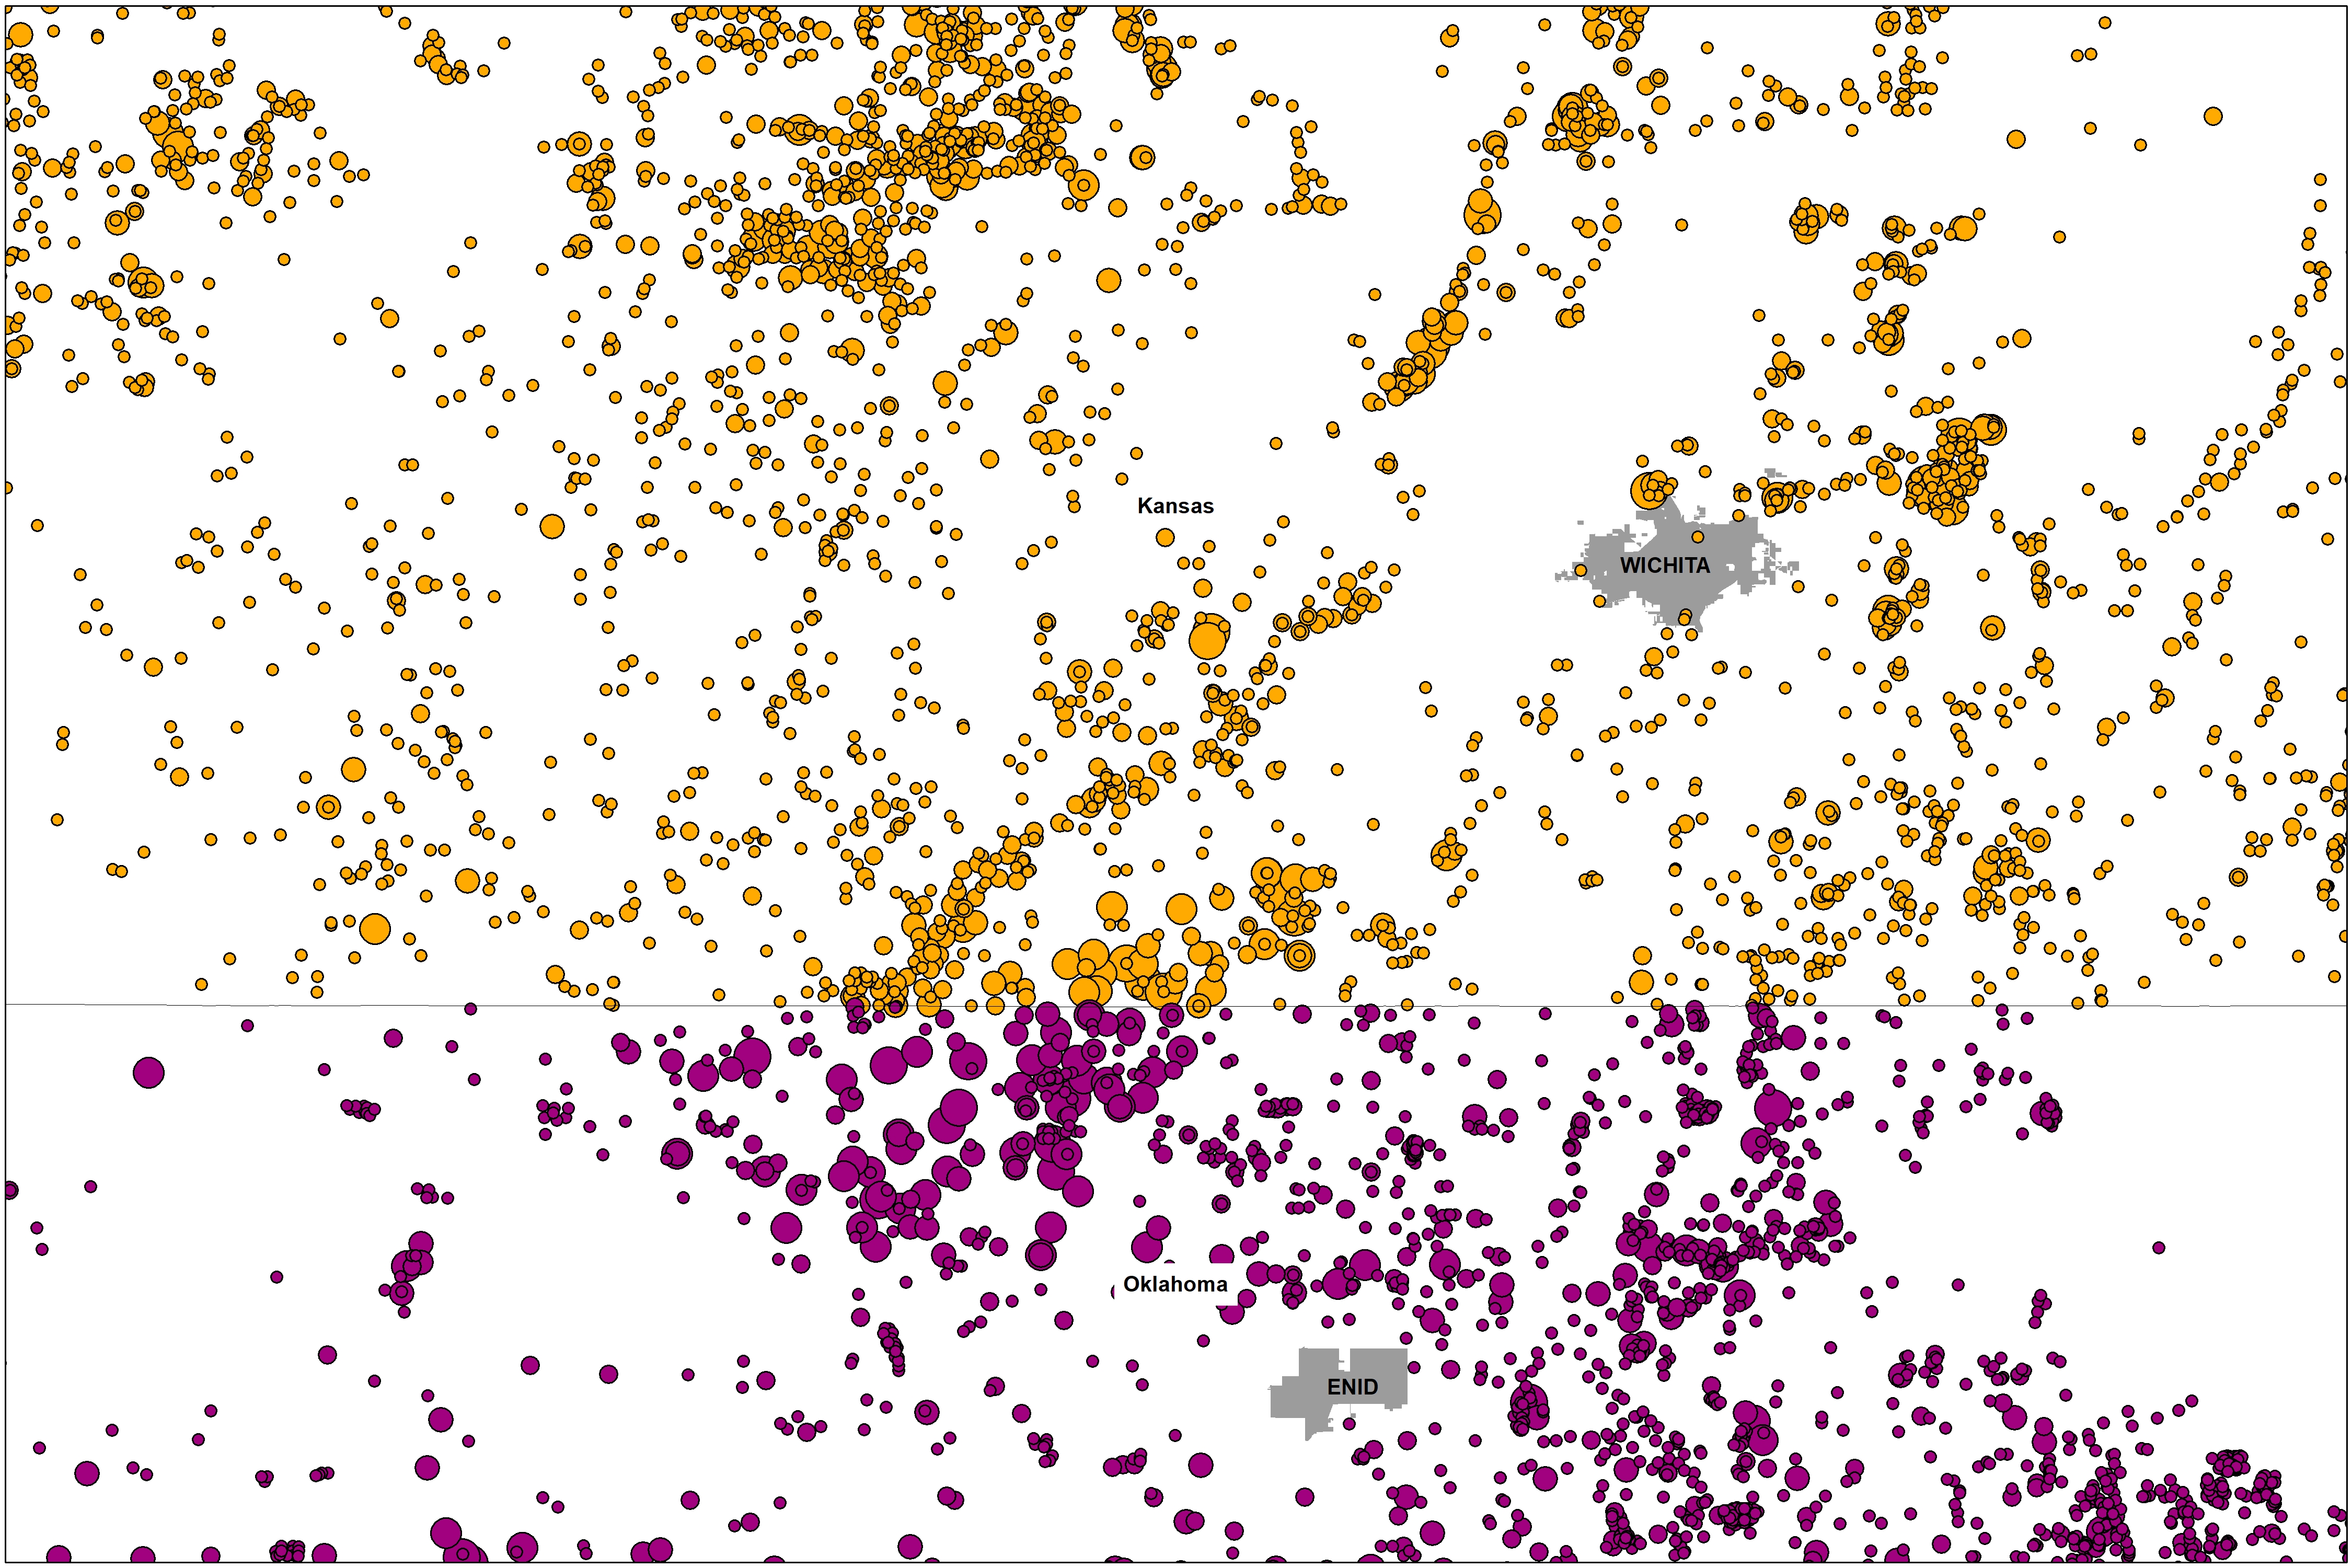
It is critical that we analyze the Great Plains fracking waste ecosystem across state lines. There are several reasons for this, including the proximity of Kansas’ most active Class II wells to the Oklahoma border (Figure 2) and the potential for the KCC to use enhanced oil recovery wells in Kansas to dispose of Oklahoma’s fracking waste.
Collaboration between front line communities, non-profits like FracTracker Alliance, and groups like the Kansas Water Advocacy Team (WAT) will be crucial to understanding the impacts of waste disposal writ large. It seems like the “food vs energy” nexus has come to a head in the heart of the U.S. Bread Basket. We’ll continue to highlight and map the issues associated with this topic in the coming months and years.
Data Download Links
The following links contain the data used in the above tables and map, for use in excel and with Geographic Information Systems (GIS).
[1] To learn more about Induced Seismicity, read an exclusive FracTracker two-part series from former researcher with Virginia Tech Department of Geosciences, Ariel Conn: Part I and Part II.
Additionally, the USGS has created an Induced Earthquakes landing page as part of their Earthquake Hazards Program.
