Surface mining to obtain sand that is perfectly sized for use in the hydraulic fracturing process has been increasing in recent years. Over the summer, FracTracker had the opportunity to document a number of sand mining activities occurring in Michigan, Minnesota, and Wisconsin that supply frac sand to the oil and gas industry. Explore a selection of this imagery below:
Explore these and other frac sand mining photos and videos in our online album. The most recent imagery can be found at the bottom of the album. Additional videos are also available on this YouTube channel.
View All Albums
All of these frac sand photos, and more, can also be found on our Energy Imagery page, organized by topic and also location.
If you have photos or videos that you would like to contribute to this growing collection of publicly available information, just email us at info@fractracker.org, along with where and when the imagery was taken, and by whom.
https://fractracker.org/wp-content/uploads/2017/09/Frac-sand-mining-Aug2017-Feature.jpg400900FracTracker Alliancehttps://fractracker.org/wp-content/uploads/2025/09/2025-Wordmark-Logo.pngFracTracker Alliance2017-09-12 20:48:512021-04-15 15:02:34New frac sand mining photos and videos are now available via FracTracker
In 4th grade, every Wisconsin student learns about their state. Topics pertaining to Wisconsin’s economy, geography, and history along with ethnicity and traditions are introduced and explored. State facts and anecdotes are discussed and naturally memorized. The one that stood out to me the most was how Wisconsin became known as the “Badger State.”
The origin of the badger nickname is from mining. The 4th grade story I remember was that miners were too busy to build houses so they moved into abandoned mineshafts and/or dug their own burrows. These men became known as “badgers.” The 4th grade version of myself thought that was real impressive. I pictured strong, hard working men fiercely toiling away in the earth like mythical creatures, helping make Wisconsin what it is today.
It made for a great story.
Back to Reality
The reality and documentation of the times suggests something different. Most miners lived in cabins or other structures above ground. There most certainly were a few outliers on the fringe of mining society who burrowed their own holes or lived in abandoned underground mines, but the adult version of myself has a hard time imagining that the term used to describe such men – badgers – was used as a compliment.
Either way, the result is the same. Word spread and eventually Wisconsin became known as the Badger State. The state may be known worldwide for its cheese and agriculture, but there was mining in Wisconsin long before the first dairy cow. While the state was earning its nickname, mining was a prominent reason for the early success of the region.
Dairy Farming in WI
The 700 acre Jereczek Homestead Dairy in Dodge Township, Trempealeau County, Wisconsin first established in 1873 and now being operated by the 6th generation of Jereczeks.
Our farm is in Trempealeau County, Wisconsin – a driftless area – meaning the land was not covered by glaciers during the last ice age. The terrain is hilly and uneven, with tree-topped bluffs and hills overlooking valleys. The valleys, ranging from deep and narrow to wide and shallow, bump and flow into each other. Over the years, our farm has received its fair share of breaker rock, crushed rock, and gravel from the prevalent rock quarries. Sandstone deposits are huge and close to the surface. As a kid, there was a ledge in the cow pasture, where I hunted through chunks of sandstone for fossils.
As with everything else in the world, dairy farming continues to change. Most barns sit derelict and hold only memories of cows as they fade into the landscape. Small farms that clung to the valley walls have been sold to bigger operations, sit vacant, or have been built over. A lot of once prime farmland has been converted into houses with ridiculously large lawns. In 1990, Wisconsin had over 34,000 licensed dairy herds. Now there are just over 9,000.
We are the last dairy farm in our valley. Parallel to the trend, my childhood herd of 40 cows has turned to 200, which is about an average-sized herd. Margins are tighter than ever. Consistent help is hard to find. Milk prices are a terrible rollercoaster ride – it seems to take forever for them to go up, but when they fall, it’s fast and sickening. In the dairy business world, survival is a measure of success.
Frac Sand Mining Perceptions
Wisconsin Frac Sand Mines, Processing Facilities, and Related Operations
The term frac sand is relatively new to me. I always assumed sand was sand and had given the word sand a negative connotation. Sand’s large particles don’t hold moisture or nutrients well, so sandy fields tend to perform poorly. But what if that sand has value for something else? What if there is a market for this sand much like a market for corn or soybeans?
Farmers tend to be resourceful. Every asset is scrutinized and employed to the fullest. Every acre is pushed. But what about what may lie beneath the soil? Sand mining has been going on in Wisconsin for well over a hundred years, but the recent surge in fracking has created an enormous demand for frac sand – and there are many people and companies set to take advantage of the boom.
Top U.S. Destinations for Wisconsin’s Frac Sands Estimated from Superior Silica Sands’ 2015 SEC 10Ks
Trempealeau County has zoning and planning ordinances to protect its industries and way of life. These aggressive ordinances allow more citizen input than other county’s ordinances. Public hearings are required, and orderly processes are enforced. With the economics involved with frac sand mining, citizens got educated very quickly. Much like abortion or immigration, frac sand has become a polarizing subject. Strong emotions built up by personal ideologies have pushed this topic to a boiling point. The for and against groups trade barbs without much convincing being done on either side. Frac sand mining editorials are common in local papers with those against appearing to be the most vocal and emotional.
New Player, New Approach
One such editorial detailed the approach a sand company took to obtaining a property. A local farmer had a sand mine company representative approach him with an oversized check written out to him for a sizable amount of money for his land. It was as though the sand rep was taking a page out of the Publishers Clearing House’s playbook. The farmer turned down the check. The sand rep left and returned a short time later with a significantly larger offer. The farmer was equally surprised and insulted. He found out later a few neighbors turned down similar proposals.
So what’s the deal with such a brazen approach? Intentions from this company may well have been good. Many people believed the sand mines were a win-win opportunity. Companies were selling hype – there was no way for anything but success. Extreme optimism. Sand mines were going to increase the tax base, fund schools and roads. Concerns were minimized, and residents were told what they wanted to hear. Such talk produced plenty of skeptics.
Environmental Costs of Frac Sand Mining
With both dairying and fracking, there is an environmental cost. Whether you milk 10, 100, or 1,000 cows – there are environmental pressures. With sand mining, the environmental effects are well documented. It is important, if not just practical, to measure these with the fiscal rewards. And where does this money go and who benefits the most? But, most importantly, who must deal with the consequences?
The risks of sand mines can be mitigated if proper regulations are taken seriously. With the extra scrutiny, a magnifying glass was placed over the sand mines, and what was found only proved the skeptics right. Trapping or pooling storm water seemed to be a learning process for sand mine companies; reported in 2012, every operating sand mine in Trempealeau County had storm water runoff violations. In 2014, over half of the sand mines in all of Wisconsin had violated environmental regulations imposed by the Department of Natural Resources. Add to this loss of surrounding property values, damage to roads, and a damper on quality of life – and you’ll create a substantial amount of public backlash.
As was mentioned earlier, mining Is not new to the state. There are many multi-generational mining companies who have the experience, tradition, and financial network to abide by current standards and environmental regulations. Nobody likes to be told what to do. No industry is out there begging for more regulations. Often, the rules are in place to protect – not hinder – those that use environmentally safe and humane practices. Dairying has its own unique regulations – some are good, some not so much, and some downright stupid. Yet, overall it can be argued that these regulations protect the industry and the environment.
One heated topic in the dairy industry involves the sale of raw (unpasteurized) milk. It is illegal for any dairy in the state to sell raw milk. I have been drinking raw milk straight from the bulk tank since before I can remember. Our whole family did. Now, I still drink it and so do all my children from the age of a year and a half on up. None of us has ever had trouble with it. However, I am in complete agreement that the sale of raw milk should be illegal. All it takes is for one child to get terribly sick (which most certainly would happen) and for that kid lying on a hospital bed being blasted by every news network in the nation. These images create strong negative emotions that reverberate throughout society. The potential costs far outweigh the economic benefits from such a sale. Sure, some people are upset, but the greater good is maintained by taking away a risky practice.
The same principle works for mining. Rules and regulations get negative press and reaction, but who stands to lose the most from environmental catastrophes related to mining – the company in business 90-some years or the startup mining ventures trying to capture lightning in a bottle? Some companies have built years of trust and compatibility and support for their local communities. These are businesses that will remain after the sand rush has fizzled.
Booms and Busts, Ups and Downs
The frac sand industry is going through the same economic cycle as the dairy industry. The sand companies are getting better at what they do and increase their production capacity. Like milk, sand is a commodity. As the price of sand decreased, production increased to maintain profits. The dairy industry does the same thing, by expanding and improving efficiency to get more milk to catch those dollars slipping away. However, when the market is flush with milk or bombed with sand, they’re just doing more damage to themselves. This is a simplified take on the industry, as there are many global factors that come into play, but the overall pattern tends to remain. As the dairy industry can attest, this fluctuating cycle is not sustainable for all producers.
Primary and Secondary US Silica Sand Geologies and Existing Frac Sand Mines
Worse yet for the sand industry, this cycle has occurred in hyper speed. At first, just the small mines cut production. Outcompeted by larger operations, production at smaller mines was no longer profitable. Soon, the larger mines cut production due to the weakening demand. Many mines in the permit or early production phases never got started. Unlike the dairy industry, there was no rollercoaster effect because prices have yet to return to prior levels. The bubble, it seems, had popped.
With any kind of new mine developed comes the environmental impacts. Yet, I find the fervent negative reaction to such practices directly related to the end result. Fracking. Fracking isn’t magic. They’re not just mixing water with this sand and forcing oil and gas out of the ground. Harmful chemicals are being added to the mix. Worst yet, the quantity and potency of such chemicals is kept secret, closely guarded from the public. Harmful chemicals are being legally pumped into the ground. All the short-term gains will have long-term consequences. This is where I believe a significant backlash for new mines comes from. The end result. Can you imagine what the public’s perception of dairy farms would be if milk was mixed with chemicals and pumped into the ground?
The Future of Dairy Farming in Wisconsin
The 2016 presidential election has breathed some life into the frac sand industry. The new president promises to cut regulations interfering with business, and thus far has kept those promises. The environment will not be a detriment to his goals. Sand companies are returning with ads in the local papers, looking for qualified applicants and offering great salaries. In contrast, the dairy industry is stuck in a rollercoaster spiral. Milk prices have been too low for far too long. The dairy dispersal continues with some very good cows being sold and very good dairymen and women calling it quits. Naturally, some land will be sold. To what end remains to be seen. But it is a safe bet, the frac sand mining ride has not ended.
https://fractracker.org/wp-content/uploads/2017/04/Frac-sand-mine-WI-Feature.jpg400900Guest Authorhttps://fractracker.org/wp-content/uploads/2025/09/2025-Wordmark-Logo.pngGuest Author2017-04-19 16:22:422021-04-15 15:03:09Fracking in Dairy Country
By Dave Dister, Consulting Ecologist, Ludington, MI
One of the prime reasons I moved to the Ludington, Michigan area in 2008 was the aesthetic and biological diversity evident at Ludington State Park (LSP). As a field biologist nearing the end of his formal career, I was eager to conduct a study of the vascular plants within the 5,300-acre park. That study consumed six years of exploring all habitats and ecosystems, and documenting (by vouchers) the flora I encountered. Although the unfortunate presence of the Sargent Sand Company operation was obvious as it cut through the south end of the park, it was not until the fracking boom a few years ago that I took special notice as a residential neighbor.
Above is a dynamic map of silica sands and frac sand mines, drying facilities, and other related facilities. Zoom and click on the map to explore various aspects of frac sand mining infrastructure. Click here to view the map full screen along with its legend.
Expanding Sand Mining
That “sleepy” sand mining operation suddenly turned into a 24-hour, seven-days-a-week operation, with associated noise that irritated a very light-sleeping biologist. Hamlin Township officials were only partially effective in addressing residential impacts “after hours,” and had no interest in developing reasonable ordinances upon a commercial operation. Although increased noise and truck traffic were a tangible nuisance, only when a renewal of the company’s sand mining permit was announced did it become clear that biological resources within the 372-acre private in-holding were afforded virtually no protection at all. And the more research I did into the regulatory permitting process, the more incredulous the situation appeared.
Above – Photos of Sargent Sands frac sand mining operations taken by Ted Auch, FracTracker Alliance
1979 Environmental Impact Report
My expertise as a wetlands biologist and botanist were well suited to scrutinizing the 1979 Environmental Impact Report (EIR), which was a hastily-compiled poorly-researched 24-page document.
From my perspective, there was a poor level of protection afforded to the Federal and State Threatened Pitcher’s Thistle (Cirsium pitcheri). As far as is known, Sargent Sand has no records of relocating this plant in proposed or active mining cells in its 100-year history of mining, although the Michigan Department of Natural Resources (MDNR) has known about plants on the property for more than 20 years. The MDNR and US Fish and Wildlife Service (USFWS) have been complicit in not adequately protecting this species, which has had minimal research into the success (or not) of transplanting individual plants. Young plants appear to transplant well, but long-term studies are not available. Older plants are much less likely to survive transplanting, as they depend on numerous minute root hairs to absorb moisture in a xeric habitat, and removal from a dune would strip-off most such root hairs. It requires about seven years for these plants to mature, so reproductive rates are slow.
Yep, it’s a fact of life – plants simply are not nearly as charismatic as animals, and consequently are treated as “second-class organisms” in the world of environmental protection. Sadly, the Michigan Department of Environmental Quality (MDEQ) just renewed the sand mining permit that allows Sargent Sand to “self-monitor” for this threatened species, and to “move plants” encountered in areas proposed for development. Does anyone really think a mining company will give two hoots about a thistle plant?!
Great Lakes Barrens Ecosystem
The rarity and value of Great Lakes Barrens (GLB) was not addressed when the 1979 EIR was written, though such ecosystems are clearly visible on aerial photographs of Sargent Sand Company property and surrounding LSP. These natural communities are known to be imperiled ecosystems at both the state and global levels. The Michigan Natural Features Inventory classifies “Great Lakes Barrens” – that include jack pine stands with associated xeric-loving shrubs and forbs – as S2 natural communities:
Imperiled in the state because of rarity due to very restricted range, very few occurrences, steep declines, or other factors making it very vulnerable to extirpation from the state. – Michigan Natural Features Inventory
Globally, Great Lakes Barrens have a similar designation. Consequently, mitigation measures must be strengthened and avoidance of impacts considered. Any Restoration Plan of such habitats must include high quality GLB plants such as buffaloberry (Shepherdia canadensis), bearberry (Arctostaphylos uva-ursi), ground juniper (Juniperus communis), sand cherry (Prunus pumila), sand-dune willow (Salix cordata), blueleaf willow (Salix myricoides), beach-heath (Hudsonia tomentosa), harebell (Campanula rotundifolia), white camas (Anticlea elegans), and wild wormwood (Artemisia campestris), among others.
Again, unfortunately the MDNR has not enforced strong protections against the destruction of Great Lakes Barrens. The “reclamation” of destroyed dunes and jack pine barrens for a mere “one-year period at 80 percent vegetative cover” comes nowhere close to a viable mitigation plan, as trees and shrubs impacted in such areas take decades to recover.
Furthermore, other state-listed plants, such as ram’s head lady-slipper orchid (Cypripedium arietinum) are known to be adjacent to Sargent Sand property but are not legally protected as they are only “Special Concern” species. Lastly, the Lake Huron locust (Trimerotropsis huroniana) is a state Threatened insect known to occur within Ludington State Park, and suitable “sparsely vegetated dune” habitat is common within Sargent Sand’s property. If you thought rare plants get little respect, try to protect a threatened grasshopper!
Great Lakes Barrens often include seasonal wetlands that are protected under Section 404 of the Clean Water Act of 1972, but which often lack surface waters much of the year. Not surprisingly, the 1979 EIR does not mention “wetlands” at all. At best, there is a comment that “There are three or four very small swamp areas on the property…” However, a review of recent aerial photography indicates many Interdunal Wetlands remain within the northern half of Sargent Sand property. The largest of these appears to be at least 0.5 acre in size, and it is likely that several acres of such wetlands exist on the property.
Consequently, a formal Wetland Delineation is needed to determine the exact location and amount of Jurisdictional Wetlands on Sargent Sand property. Any impact to such wetlands requires mitigation measures that include avoidance, minimization, and/or wetland creation elsewhere within the watershed. Additionally, Interdunal Wetlands are ranked S2 Natural Communities by the State of Michigan, and have a rank of G2 globally. Both of these designations indicate these areas are “Imperiled,” so mitigation ratios should be high (e.g., 10:1 or 20:1).
Current Political Climate in Ludington
The current political leadership in Michigan, as well as the nation, has presented a formidable challenge for environmentalists and scientists. Additionally, the system certainly appears rigged when the agency – the MDEQ – that issues permits and permit renewals is also a lobbyist for the oil, gas, and minerals industry. Nevertheless, the battle to protect this natural heritage is a noble and vital one that will persist. As with every other sensitive and rare environmental resource, if no one scrutinizes the lax protection of our natural heritage, before you know it, it will be gone.
https://fractracker.org/wp-content/uploads/2017/02/Ludington-Sand-Mantis-Feature.jpg400900Guest Authorhttps://fractracker.org/wp-content/uploads/2025/09/2025-Wordmark-Logo.pngGuest Author2017-02-20 10:57:312021-04-15 15:03:43World Class Dunes and Great Lakes Barrens at Risk at Ludington
We’ve added several new frac sand resources for visitors to our website this month, including a map of frac sand mines, as well as geolocated data you can download. Explore these resources using the map and links below:
On the map above you can view silica sands/frac sand mines, drying facilities, and value-added facilities in North America. Click view map fullscreen to see the legend, an address search bar, and other tools available on our maps.
Additional data shown on this map include addresses and facility polygons. Wisconsin provides sand production data for 24 facilities, so that information has been included on this map. The remaining Wisconsin and other state facilities do not have production or acreage data associated with them. (Most states lack disclosure requirements for releasing this kind of data. Additionally the USGS maintains a confidentiality agreement with all firms, preventing us from obtaining production data.)
The sandstone/silica geology polygons (areas on the map) include a breakdown of how much land is currently made up of agriculture, urban/suburban, temperate deciduous forest, and conifer forests. At the present time we only have this information for the primary frac-sand-producing state: Wisconsin. We should have details for Ohio and Minnesota soon.
Data Downloads
Click on the links below to download various geolocated datasets (zipped shape files) related to the frac sand industry:
With the advent of hydraulic fracturing to increase production of oil and gas from tight geologic formations, such as shale, the demand for fracking sand (frac sand, or frack sand) has increased drastically in recent years. What does this process look like, you might ask. To help you understand this subsidiary of the oil and gas industry, we’ve compiled all of our frac sand photos into three albums on the topic.
Frac Sand Mining Photo Album
This album contains all of the photos we have amassed of frac sand mining and transportation operations – both from the ground and the sky.
All of these frac sand photos, and more, can also be found on our Energy Imagery page, organized by topic and also location.
If you have photos or videos that you would like to contribute to this growing collection of publicly available information, just email us at info@fractracker.org, along with where and when the imagery was taken, and by whom.
https://fractracker.org/wp-content/uploads/2016/09/SandMining-Feature.jpg400900FracTracker Alliancehttps://fractracker.org/wp-content/uploads/2025/09/2025-Wordmark-Logo.pngFracTracker Alliance2016-09-20 16:33:572021-04-15 15:04:26Frac Sand Photos Available on FracTracker.org
An Ottawa, IL resident’s letter to U.S. Silica regarding how the firm’s “frac” sand mines adjacent to Starved Rock State Park will alter the local economy.
Starved Rock State Park
As is so often the case, we find that those things we have taken most for granted are usually the things we miss most when they are gone. The list of what our nation has lost to industrial and commercial concerns couldn’t possibly be compiled in a single article. The short-sighted habits of economic progress have often led to long-term loss and ecologic disaster. That is why it took a man like Abraham Lincoln, a man of long-term vision and wisdom, to sign into existence our first national park, preserving for antiquity what surely would have been lost to our American penchant for development and overuse.
With that in mind, I have always found it amazing how the gears of our own local and state governments have continually chosen the economic path of least resistance and allowed the areas surrounding Starved Rock State Park to be ravaged and destroyed for what is, ultimately, minimal gain. I am no expert but I suspect it could be argued that a full 1/3 of LaSalle County’s economic engine is funded by the simple existence of Starved Rock State Park. Beyond the 2 million plus visitors to the park each year, it cannot be forgotten that nearly every municipality in LaSalle County has directly or indirectly benefited from the countless number of businesses that prosper from the magnetism of the park’s tranquil canyons.
As the 4-year battle with Mississippi Sand over development of the Ernat property has proved, there are many rational souls who truly acknowledge the importance of maintaining a healthy and productive park environment. With the recent sale of the Ernat property to U.S. Silica, we are again confronted with the prospect of irrational development of the eastern boundaries of Starved Rock State Park.
Given the gravity of these decisions, I would like to share a letter recently sent on behalf of many of those who have fought so hard and so long for preservation of that same eastern boundary. This letter was sent to Brian Shinn, CEO of U.S. Silica Holdings, INC. (SLCA) in Frederick, Maryland nearly a month ago, and we have yet to receive a response. In sharing this information on FracTracker’s website, I hope this letter will contribute to further discussion among our local representatives over a far more long-term vision of what LaSalle County wishes to be and what qualities, both environmental and economic, that it wishes to maintain and protect:
Letter to US Silica
Dear Mr. Shinn,
I am writing this letter on behalf of dozens of LaSalle County, Illinois residents who have, for the past several years, been intimately involved in the active pursuit of rational use and conservation of our local natural environment. As I am sure you are aware, the debate over use of the Ernat property as a functional sand mining operation has been a long and hard-fought battle. Years of litigation by the Sierra Club and other local environmental groups helped stall it’s development by Mississippi Sand, and have now led to the sale of the Ernat acreage to U.S. Silica. As irrational as the previous proposals were, the sale putting that acreage under your control has not lessened our concerns over the damaging use of that property as it relates to historic Highway 71 and the entire Starved Rock State Park area.
Obviously, sand mining operations have been a long-standing component of LaSalle County economics. Decades of mining under U.S. Silica supervision have not substantially reduced the quality of life for county residents or the natural environment as a whole. However, as can be specified by many local experts, the development and spoilage of the Ernat property will most certainly have longstanding and drastic impacts on both the ecology of Starved Rock State Park and the economic engine that it sustains. Starved Rock State Park attracts over 2 million visitors each year, with an estimated half million visitors using the Hwy. 71 entrance paralleling the Ernat farm as their main gateway into the park. The Ernat property’s river frontage has long been the tranquil eastern entry into the Illinois Canyon area, as well as an active nesting site for countless birds amidst bountiful wetlands and flat, open prairies. The Ernat property’s shared access to Horseshoe Creek has also made it essential to the entire Illinois Canyon ecosystem within the park. In short, any development of this property will most certainly have long-term negative impacts on both the economics and ecology of the Illinois River Basin.
In writing this letter, we are hoping that U.S. Silica, under your guidance, may consider the opportunity to preserve this indispensable parcel of land and examine ways in which U.S. Silica might make this land available as a gift or negotiated property to the state of Illinois. It would certainly be an important addition to the entire Starved Rock State Park area. I have included the signatures of many of our own local coalition. We hope you will consider the long-term impacts that this development would have to one of Illinois premier natural areas. Thank you.
Inspiring Action
I hope those who have signed this letter will be inspired to further action, and those who have not will reconsider their years of inaction. The natural heritage and local economies of our entire Illinois River Basin are depending on it.
Sincerely,
Paul Wheeler
Only when the last tree has died… and the last river been poisoned… and the last fish been caught… will we realize we cannot eat money.
https://fractracker.org/wp-content/uploads/2016/08/StarvedRock-McCray-Feature.jpg400900Guest Authorhttps://fractracker.org/wp-content/uploads/2025/09/2025-Wordmark-Logo.pngGuest Author2016-08-29 16:47:202020-03-11 16:46:26How Frac Sand Mining is Altering an Economy Dependent on Starved Rock State Park, IL
By Brook Lenker, Executive Director, FracTracker Alliance
Frac sand mining is a growing threat to the agricultural landscapes of the upper Midwest and a health risk to those who live near the mines. With a general slowdown in the oil and gas industry, sand mining may seem a lessening concern in the universe of extraction impacts, but a recent visit to Wisconsin during Earth Week suggested otherwise.
Frac Sand Mining Presentations
Dr. Auch presenting in Wisconsin on frac sand mining issues
I joined my colleague, Dr. Ted Auch, on an informative cross-state tour that started in Milwaukee. We were presenters at the Great Lakes Water Conservation Conference where representatives from breweries around the region and across the country came together to discuss their most precious commodity: clean and abundant water. Extraction affects both the quantity and quality of water – and our insights opened many eyes. Businesses like microbreweries with a focus on sustainability and a strong environmental ethic recognize the urgency and benefit of the renewable energy transformation.
From Milwaukee, we headed west to Madison and the University of Wisconsin where Caitlin Williamson of the Wisconsin Chapter of the Society for Conservation Biology organized the first of two forums entitled “Sifting the Future: The Ecological, Agricultural, and Health Effects of Frac Sand Mining in Wisconsin.” We were joined by Kimberlee Wright of Midwest Environmental Advocates to address an engaged audience of 35 people from the campus and greater community. Thanks to Wisconsin Eye, a public affairs network, the entire program was videotaped.
Brook Lenker presenting at Sifting the Future event in Wisconsin
A long drive to Eau Claire revealed rolling farmland, wooded hills, and prodigious wetlands home to waterfowl and the largest cranberry industry in the nation. At the Plaza Hotel, we met Cheryl Miller of the Save the Hills Alliance, the grantor enabling us to study the regional footprint of sand mining, and Pat Popple, advocate extraordinaire and our host for the second “Sifting the Future” event. The good folks at Public Lab were also in town to facilitate citizen monitoring of silica dust from the mining process, including a free workshop and training that weekend.
The evening program attracted 50 people from as far away as Iowa and Minnesota. Their interest in and knowledge of sand mining issues was impressive, and many were heavily involved in fighting local mines. Dr. Crispin Pierce spoke of his research about airborne particulates around frac sand operations, complementing both FracTracker presentations – mine emphasizing the broad array of environmental and public health perils related to oil and gas extraction and Ted’s examining the scale and scope of sand mining, demand for proppant, and the toll of the industry on agricultural productivity, forests and the carbon cycle.
Mining Photos
During the five day trip, sand mines were visited and documented, their incongruent and expanding presence marring the countryside. Some of them can be seen in this photo gallery:
On Earth Day, while driving east to return to Milwaukee, Sandhill cranes, a timeless symbol of the Wisconsin wild, poked the rich prairie soils searching for food. Joined by Autumn Sabo, a botanist and researcher who assisted our Wisconsin work, we detoured to the nearby Aldo Leopold Center visiting the simple shack that inspired Mr. Leopold to write Sand County Almanac. Considering the reason for my travel, the irony was thick. Ecological consciousness has come a long way, but more evangelism is sorely needed.
Aldo Leopold Center, Wisconsin
https://fractracker.org/wp-content/uploads/2016/05/WITour-Feature.jpg400900Guest Authorhttps://fractracker.org/wp-content/uploads/2025/09/2025-Wordmark-Logo.pngGuest Author2016-05-05 15:36:252020-03-11 17:07:10Earth Week in Wisconsin
Ludington State Park, Sargent Sand’s Mine, and US Silica and Sylvania Minerals By Ted Auch, Great Lakes Program Coordinator
When it comes to high-volume hydraulic fracturing (HVHF), frac sand mining may be the most neglected aspect of the industry’s footprint. (HVHF demand on a per-well basis is increasing by 8% per year.)
To help fill this gap I decided to head out on the road to visit, photograph, and listen to the residents of this country’s primary frac sand communities. This multimedia perspective is part of our ongoing effort to map and quantify the effects of silica sand mining on communities, agriculture, wildlife, ecosystem services, and watersheds more broadly. Below is my follow up attempt to give The FracTracker Alliance community a sense of what residents are hearing, seeing, and saying about the silica sand mining industry writ large, through a tour of 7 sand mining communities – part 2. Read part 1.
Monroe County, MI
Monroe County, Michigan is approximately 22 miles south on I-75 from downtown Detroit with similar demographic differences to the Chicago-LaSalle County, IL comparison we made during the first part of this series. South Rockwood lies along the Northeastern edge of Monroe County and the Monroe-Wayne County border, and is consequently at the intersection of Detroit’s sprawl and rural Michigan.
Monroe County and nearly all of South Rockwood is underlain by one of the purest sandstone formations in North America. The Sylvanian Sandstone formation lies beneath 20% of Monroe County stretching from the aforementioned Wayne County border south-southwest to Lucas County, OH (Fig. 1). It is this formation that mining stalwarts such as US Silica and the appropriately named Sylvanian Minerals are mining for frac sands. Not only is the silica pure, but it is also extremely close to the surface. The region, conveniently, is situated at the crossroads of numerous rail lines capable of transporting the sand to shale plays in the east and North Dakota alike.
US Silica and Sylvanian Minerals are neighbors at the corner of Ready and Armstrong Roads in South Rockwood, with the former adjacent to I-75’s southbound lanes (Fig. 2). As of fall 2011, Sylvanian Minerals hadn’t even broken ground on its initial stab at mining frac sands. Presently the two firms have altered nearly 650 acres, or 40% of the community, with the potential to mine an additional 494 acres. These plans suggest that these two companies could collectively alter 72% of the community’s topography.
This domination of the landscape and commerce concerns many South Rockwood citizens including Sylvanian’s immediate neighbor Doug Wood, who has been the industry’s primary citizen watchdog over the last couple years (photo below).
Mr. Wood was generous enough to let us climb to the top of his barn to snap some photos of the mine. Mr. Wood witnessed the foundation of his home become compromised by the numerous blasting events down in Sylvanian’s mine, and only recently found out that the collective activity at the mines is going to force exit 26 off I-75 to be rerouted to Ready Road, converting this sleepy road into the primary entrance/exit for mine-related traffic. In addition, with the approval of Michigan’s Governor Rick Snyder, US Silica’s Telegraph Road Mine proposal has Mr. Wood and his neighbors worried about the safety of their families, the air pollution they inhale from the dust and potentially airborne silica, and the truck traffic related noise, which will all undoubtedly influence their health and quality of life.
The primary take-home message from this stop on my tour was that we have only seen the tip of the iceberg with respect to the potential of frac sand mining to literally and figuratively alter communities. Other affected areas such as South Rockwood could learn quite a bit from the likes of LaSalle County, IL residents Anna Mattes, Tom Skomski, and Ashley Williams.
On to the dunes of Western Michigan and Ludington State Park!
Ludington State Park and Sargent Sand’s Mine
After several days in Grand Rapids, I traveled to Ludington State Park in Michigan (see Fig 4 below), along with documentarian/drone pilot Tom Gunnels and Kent County Water Conservation’s Stephanie Mabie. Our destination was the camp of Linda and Ron Daul, the residents spearheading an effort to make Sargent Sand more accountable and transparent in its mining operations. There camp is also located within and adjacent to one of the most sensitive ecosystems in North America.
This is a documentary produced by Tom Gunnels and his Hive•Mind team that incorporated interviews and drone footage from our Ludington/Sargent Sand mine tour August, 2015.
Ms. Daul was kind enough to organize a tour of the mine, Ludington State Park, and northern hardwood forest for us, as well as journalist Aaron Selbig, who produced a piece on the tour for Interlochen Public Radio. The scenery sans the sand mining infrastructure, noise, and related truck traffic was beautiful in this little corner of Michigan roughly half way between Grand Rapids and Traverse City.
Michigan’s unique and threatened dune ecosystems – and associated Jack Pine (Pinus banksiana) “plains” or “barrens” ecosystem1 – comprise of 116 square miles of coastline along Lake Michigan. Unfortunately, they are simultaneously deprived of the fire regimes they require to regenerate, and are targets for the production of frac sands with Ludington State Park being the primary example. This makes the feasibility of reclaiming original plant communities dubious at best. (There have been mixed results associated with reclamation efforts, for example, at the former Rosy Mound Standard Sand Corporation’s mine 80 miles due south in Grand Haven, see Fig. 5.)
The largest obstacle to reclamation of sand mines along Lake Michigan is the inability of practitioners to document and replicate the many “microenvironments,” which as Peterson and Dersch pointed out:
…are the small environments created by differences in temperature, moisture, and light intensity within the sand dune ecosystem. Examination of these small environments is essential to a clear understanding of the ‘whole’ ecosystem. The diversity of organisms in sand dune areas is made possible by the variety of habitats found in relatively small areas. Any alteration of the dune which homogenizes the ecosystem will allow less diversity of plants and animals.
The Great Lakes dune complex requires perennial vegetation, wind, and sand for continued formation and stabilization with a complex – and specifically adapted – mosaic of lichens, fungi, mosses, grasses, wildflowers, shrubs, and trees arranged in a complicated and multi-layered manner across much of Western Michigan’s lakeshore. As Michigan’s DNR put it:
Without sand dune plants, the integrity and preservation of a stable dune complex cannot exist.
In combination with the Michigan Supreme Court’s constant fiddling of the intent and letter of mineral extraction law, namely the “very serious consequences” clause in House Bill 4746 (2011), you have the makings of a scenario that could eliminate upwards of 16 square miles of Michigan’s critical dunes in the coming years or 9-14% of the entire complex.2
In addition to Pitcher’s Thistle, systems – like those found along the western edge of Michigan – are home to more than 15 endemic, or nearly so, plant species such as:
Wormwood (Artemisia campestris, aka the source of Absinthe),
The early colonizer sea-rocket (Cakile edentula),
Clustered Broom-Rape (Orobanche fasciculata),
Harebell (Cakile edentula, at the edge of Sargent Sand’s Ludington mine), and
Hoary Puccoon (Lithospermum canescens), and the species most responsible for dune stabilization Marram Grass (Ammophila sp.).
Additionally, these dunes are critical to the life-cycles of more than 10 different species of birds, reptiles, and herbivores including the Eastern Hog-nosed Snake, Eastern Box Turtle, American Goldfinch, and everybody’s favorite, the White-Tailed Deer.
Table 1. Number of Threatened, Endangered, and Rare Plant Species within Western Michigan’s Dune Complex
Criteria
# of Species within Michigan’s Dune Complex
Michigan Threatened Species List
72
Michigan Endangered Species List
7
Michigan Rare Species List
3
Extinct
4
US Endangered Species List
1
US Threatened Species List
11
Modified from State of Michigan Department of Natural Resources, Geological Survey Division, 1979.
Finally, it is of importance to mention the final stage of dune succession are the beech-maple forests, which take an estimated 1,000 years to be achieved according to Jerry Olson (1958). With that said let’s take a look at some of the pictures and testimonial I gathered during my trip to The Great Lake(s) State…
The Photos
A. Sylvanian Minerals and US Silica, South Rockwood, Monroe County, MI from Doug Wood’s barn
Location where below photos were taken, showing the Sylvanian Minerals and US Silica Mine Complex, South Rockwood, Monroe County, MI
B. Ludington State Park and Sargent Sand’s Silica Sand Mine, Ludington, Mason County, MI
Ecosystems and Native Plants of Ludington State Park, Mason County, MI (16 images, 11 species)
Sargent Sand and Ludington State Park photography point-of-view and Tom Gunnel’s drone flight path
The cards are definitely stacked against you when there is a silica quarry right next door to your dream home/property. We toiled for years to green it up with trees and grass, a labor of love for our “place in the country”. I mean, what’s not to love about semi-truck traffic, air pollution, house tremors not to mention plummeting property values! Since South Rockwood village annexed the quarry in 2010, placing a quarry wall literally 300 feet from my home, we deal with noise of crushers, loaders, drilling for blasting, and blasting. All the while we are left to wonder what kind of garbage we are inhaling since there seems to be NO REGULATIONS, AIR MONITORING OR DUST CONTROL MEASURES AT ANY TIME!! And if that isn’t enough, the village wants to relocate the freeway ramps to our road for the quarry’s trucking convenience.
Al (Chip) Henning, Ludington, MI
Sargent Sand Company has owned this site since the 1920s. The Big Sable Dune Complex is roughly twice the size of Sleeping Bear Dunes National Lakeshore, and includes the Nordhouse Federal Wilderness. If Sargent completes their mining as projected over the next 30-40 years, the Ludington Dunes (about 40% of the Complex) will be 60-70% destroyed/mined/removed, sent primarily to Pennsylvania for hydraulic fracturing in the Marcellus Shale formation. Sargent has removed 10-15% of the Ludington Dunes, to date, and faces permit renewal in January 2016. My family owns several properties which abut Ludington State Park, whose lands surround the Sargent property narrowly on three sides. Our property lies 1200 feet from the Sargent operations at closest approach; aside from the unsustainable removal of the sands, the noise from Sargent’s 24-7-365 operations is frequently intolerable.
Linda Bergles Daul, Ludington, MI
Fracking sand is mined from ancient geological sand deposits, extremely rare across the globe. In Michigan, the Sargent Sand – Ludington (State Park) Site, on the west coastline of Lake Michigan, enjoys a controversial, grandfathered permit to mine irreplaceable sand in critical dunes for horizontal fracking application. When the Sargent Sand mine is operating, the peaceful retreat of Hamlin Lake might as well be a downtown Chicago construction site, sharing heavy truck traffic, air pollution and mine numbing noise with our Pure Michigan visitors. The beauty and majesty of Ludington State Park has enriched my life. The critical dunes are one of Michigan and LSP’s most spectacular natural features – they also are one of our most fragile! The dunes are a phenomenon unique to the State of Michigan and yet we allow permitted critical sand dune mining right next to LSP. Sargent sand expansion towards LSP resulting in the removal of 200 year-old stabilizing trees, dredging to create artificial lakes, disregard for wildlife and the critical dune ecosystem, should be addressed within LSP master plans. I would like to see a world-class, university associated educational program established at Ludington State Park, addressing dune ecosystems. The LSP master plan should deliberately study the impact of Sargent Sand Mining operation and propose a broader vision that will consolidate the park in a way that preserves its beauty for future generations. [Furthermore] The State of Michigan Sec. 35302 The legislature finds that: (a) The critical dune areas of this state are a unique, irreplaceable, economic, scientific, geological, scenic, botanical, educational, agricultural, and ecological benefits to the people of this state and to people from other states and countries who visit this resource. EXCEPT if the activity is involved in sand dune mining as defined in part 637.
Sargent Sands sand mining has been viewed as mainly negative in the Ludington-Mason County community. This company was “dormant” until hydraulic fracturing became somewhat popular. Most citizens and visitors do not like to see the dunes removed in this area so close to the Ludington State Park. Destruction of critical dune area and possible endangered plants are the main concerns. Other impacts to this community include the immense noise created by the mining for families with homes by the mine and all the trucks going through town to the freight trains. Another issue is the wear on the roads. Also mentioned to me was the time spent waiting at the train crossings because of the sand being transported to other areas via trains. I really haven’t heard any positive comments. My guess would be that the mining creates jobs for the truckers, train workers, and of course the employees of the company. As far as in the future there are rumors that Sargent Sands will continue to mine and then make the area a destination place with condos around the lake they created. This is turn will bring more traffic to the dunes, not a sustainable idea!
I really do “get it” in understanding that jobs are critically important for our State. Mouths are fed, bills are paid, colleges are attended. But the damage to Ludington left in Sargent Sands’ wake when it is done here someday will be permanent scars from the removal of Sand Dunes so rare and so beautiful, that I’m certain that we will all regret what we allowed to happen while on “our watch”. I believe that Ludington’s precious Sand Dunes are not really “ours”…to destroy or allow to be taken. They are timeless natural resources that we have simply been granted stewardship over by our own forefathers and mothers. Allow our children and great grandchildren the privilege of seeing and enjoying what we ourselves have been lucky enough to have seen and touched. “As a native Michigander and 13 year resident of Ludington, I can confidently tell anybody willing to listen that Sargent Sands is (at this very moment) irreversibly destroying one of Michigan’s last remaining precious and timeless natural resources. We… OWE IT to generations that follow us, the right to marvel at and enjoy what is one of this Country’s uniquely beautiful natural treasures… Ludington’s sand dunes. I ignorantly believed, at first, when Sargent Sands began mining sand again here that it would be something akin to raking one’s yard of leaves. When I had an opportunity to hike their mining operation’s perimeter, I witnessed what looks like strip-mining devastation. It’s saddens me that I was complicit (when I myself purchased some sand for my backyard from Sargent’s) but I am more frightened that our own DEQ (who should have known better) would have ever approved such disfiguring and permanent alteration to something so rarely seen in nature. I myself have marveled…at something that I believe only a few places on Earth possess…sand dunes so unique, so beautiful and so rarely seen (and…FREE to hike and to look at !) along a freshwater lake that happens to be what is increasingly being recognized as our Country’s lifeblood. In the Winter here when it snows, I often wonder how many people in other countries can even imagine what snow blowing in sand dunes looks like…the beautiful swirling mixture of sandy snow wrapping around dune grasses that stretch as far as the eyes can see –but now being trucked away. I ask our State, especially in light of Flint’s man made devastation, PLEASE do not allow this to continue when Sargent Sands’ permit expires in December of 2016. This sand mining destruction cannot be undone.
Additional Readings
Buckler, W.R., 1978. Dune Type Inventory and Barrier Dune Classification Study of Michigan’s Lake Michigan Shore, in: Resources, M.D.o.N. (Ed.). Michigan Department of Natural Resources, Lansing, MI.
Cowles, H.C., 1899. The Ecological Relationship of the Vegetation on the Sand Dunes of Lake Michigan. Botanical Gazette 27, 95-117, 167-202, 281-308, 361-391.
Cressey, G.B., 1928. The Indian sand Dunes and Shore Lines of the Lake Michigan Basin, The Geographic Society of Chicago Bulletin. The University of Chicago Press, Chicago, IL.
Daniel, G., 1977. Dune Country A Guide For Hikers and Naturalists. The Shallow Press Inc., Chicago, IL.
Dorr, J.A., Eschman, D.F., 1970. The Geology of Michigan. University of Michigan Press, Ann Arbor, MI.
Kelley, R.W., 1962. Sand Dunes, A Geologic Sketch, in: Conservation, M.D.o. (Ed.). Michigan Department of Natural Resources, Lansing, MI.
Koske, R.E., Sutton, J.C., Sheppard, B.R., Ecology of Endogone in Lake Huron Sand Dunes. Canadian Journal of Botany 53, 87-93.
Olson, J.S., 1958. Rates of succession and soil changes on Southern Lake Michigan sand dunes. Botanical Gazette 119, 125-170.
Peterson, J.M., Dersch, E., 1981. A Guide To Sand Dune and Coastal Ecosystem Functional Relationships, in: Service, M.C.E. (Ed.). Michigan Cooperative Extension Service, Lansing, MI.
Ranwell, D.S., 1972. Ecology of Salt Marshes and Sand Dunes. Chapman and Hall, London, UK.
Reinking, R.L., Gephart, D.G., 1978. Pattern of Revegetation of a Shoreline Dune Area, Allegan County, Michigan. The Michigan Academician 11.
Thompson, P.W., 1967. Vegetation and Common Plants of Sleeping Bear. Cranbrook Institute of Science, Bloomfield Hills, MI.
Footnotes for 7 Sand Mining Communities, 3 States, 5 Months – Part 2
Michigan’s DNR describes this ecosystem as having “always contained few large trees and little or no old growth. A forest where soils are dry and the vegetation sparse, it is called a barrens. A forest periodically swept by raging fires, only to spring back, fresh and revitalized. A forest which is amazingly productive and biologically diverse, providing homes for numerous plants and animals, many of them [endemic]. Today [we are]…seeking to extract its resources, enjoy its beauty, explore its secrets, and preserve its life. The jack pine forests can exist, only if we care.”
As Michigan State researchers pointed out the Michigan coastal dune ecosystem exists in small fragments along the Atlantic Coastal Plain but nowhere else in the world
An Exploration of Sand Mining Impacts: Lasalle County, IL by way of Chicago’s South Side By Ted Auch, Great Lakes Program Coordinator
When it comes to high-volume hydraulic fracturing (HVHF), frac sand mining may be the most neglected aspect of the industry’s footprint. (HVHF demand on a per-well basis is increasing by 8% per year.)
To capture how this industry is changing several sand mining communities, I recently took a road trip to visit, photograph, and listen to the residents of this country’s primary frac sand areas. In total, I visited 7 sand mining communities in Illinois, Indiana, and Michigan.
This multimedia perspective is part of our ongoing effort to map and quantify the effects of silica sand mining on people, agriculture, wildlife, ecosystem services, and watersheds more broadly. Below is my attempt to give the FracTracker community a sense of what residents are hearing, seeing, and saying about the silica sand mining industry writ large.
Chicago’s South Side
Before heading to Illinois’ frac sand epicenter of Lasalle County, I couldn’t help but catch the South Shore Line out of Millennium Station. This station can be seen as you head south to the Hegewisch neighborhood on Chicago’s impoverished South Side, an area of greater Chicago-Gary, Indiana that has largely been forgotten by politicians in both states.
Figure 1. Average income per capita and Hardship Index (0-100 with 100 being the worst) for Chicago’s neighborhoods with Hegewisch highlighted in the city’s southeast corner.
This situation is a shame because collectively Hegewisch and the city of Whiting, IN are home to one of the largest – and getting larger – collections of oil refineries and oil sands infrastructure in the United States.
For an estimation of how difficult it is to live in various Chicago neighborhoods, see Figure 1, left.
This proliferation has not been without its dangers, including a compressor station explosion at BP PLC’s massive1 Whiting Refinery in August 2014. Unfortunately, that incident was just the latest in a long line of mishaps at this facility. The “operational incident,” as BP called it, rocked already stressed neighborhoods like MarkTown, IN – the aborted company town planned for steel maker Clayton Mark. MarkTown is on the National Register of Historic Places and is an example of a community that is being erased from the face of the earth in the name of Hydrocarbon Industrial Complex expansion. For those interested in architecture preservation, MarkTown’s rapid erasure is being conducted by BP itself and in the process we are losing an example of Conservatively Radical architect Howard Van Doren Shaw’s distinct English-style Tudor homes and urban planning. Residents speculate BP “may be buying up the properties because of concerns about liability.” The company counters they are just trying to create additional green space for residents.
Figure 2. Average daily oil refinery production per day across North America’s 152 Oil Refineries along with North American ports.
Luckily for everyone, operations following the aforementioned recent explosion were only “minimally impacted as a result of the incident and the refinery continue[d] to produce products for customers.” However, the more chronic concern is the tight supply-demand relationship between BP’s refinery and their Koch KCBX neighbor. Koch has made repeated headlines – and many neighbors turned enemies including the Southeast Environmental Task Force and its fearless leader Peggy Salazar – with its handling of the refinery’s annual production of 600,000 tons of petcoke a development Chicago Magazine called Mountains of Trouble. Petcoke is a byproduct of the refinery’s increased acceptance and processing of tar sands from Alberta Canada. Levels of production are likely to increase given BP’s completion in November 2014 of a “$4-billion revamp…to boost its intake of Canadian crude oil from 85,000 bpd to 350,000 bpd.”
Given how interconnected the hydrocarbon industry is, I thought it would be worth collecting some photos of the aforementioned infrastructure. When I saw that Koch KCBX’s terminal was also storing large amounts of silica sand, however, the connection between my next target(s) in LaSalle County was made even more obvious.
Lasalle County, Illinois is situated approximately 50-60 miles south-southwest of Chicago. When you try to compare demographics and commerce, however, it is worlds away.
Chicagoland encompasses nearly 10,900 square miles – 9.5 times the area of Lasalle County. While Chicago’s population is expanding by 95,681 people per year, LaSalle’s is shrinking by 2,734 per year (Table 1). Chicagoans, though not South Siders, are making more than two times that of LaSalle County residents (with the latter actually falling nearly $4,700 below the state average). Predictably the demographics of Chicago reflect more and more those of the US, while LaSalle is typical of rural America with a population that is 93% white and only 3.3% foreign born. Thirty-five percent of Chicagoans are likely to achieve a bachelor’s degree, while only 16% of LaSalle County residents are likely to do so. Rates of poverty and more specifically child poverty, on the other hand, are significantly higher in Chicago. Finally, LaSalle is one of the country’s preeminent farming counties; it ranks #4 in the state and #126 nationally thanks to the value of agricultural commodities produced amounting to $448.5 million net of farm subsidies. See Table 1.
Figure 3. La Salle County, IL Silica Sand Mines & St. Peter Sandstone Geology
The above contrast was made crystal clear as I traveled down Interstate 80 westbound towards exit 90 and LaSalle’s County seat Ottawa (pop. 18,562). Upon arriving in Ottawa I drove west on Madison Street to the first target of our expedition: U.S. Silica Company’s mine and processing facility at the corner of Madison Boyce Memorial Drive. Upon arriving, however, it became clear that I would not find a suitable location to photograph the company’s mine; the perimeter had been fenced off and mounded up to the tune of 10-15 feet. So I got back in our rental car and drove to the mine’s southern perimeter adjacent to the Bear Den Bar and Grill and the Vine St.-Fern St.-15th Ave. neighborhood where there was clear line of site. It was here that I got some of the best photos of the mine’s scale and scope with respect to land-use, reclamation, and hydrology.
Below is a sample of some of those images as well as several I took further down Route 34 between U.S. Silica’s active mine and a “reclaimed” Ottawa Silica Co. mine on the banks of the Illinois River.
After snapping several hundred shots of these two mines I headed to the I & M Canal State Trail between Utica and Ottawa emanating out of Buffalo Rock State Park and hiked east towards the Northern edge of U.S. Silica’s mine alongside a CSX railroad and recently constructed spur feeding into the mine’s loading terminal. The hope was that I would get a closer look at the mine but it turned out the angle was different but not better.
From the back of U.S. Silica’s Ottawa mine I traveled approximately 7 miles west to Unimin’s North Utica mine and a short dirt road off of 2803rd Road on the northern edge of the mine.
It was here that I photographed the mine’s reclamation plots, active mine pits, and developing water transport mechanisms. However, more importantly it was from here that I noticed off in the distance a bright red silica sand grain-size separator.
Curiously I did not – but do now – have this nascent and relatively small mine posted on our Frac Sands Mines and Related Facilities map at the time. Upon arriving at this site I found that the mine was owned and operated by a company called Northern White Sand a small mom & pop operation out of Utica, IL.
The photos I took of this mine were primarily from atop a vegetated berm to the southwest of the mine’s primary footprint. This vantage point allowed us to get some great shots of the types of infrastructure/equipment typical of this sized mine including the aforementioned modular grain-size separator, conveyor belts, retention ponds, and the pyramid-like piles of powdery white silica sand so desired by the HVHF industry.
Our final stop on the LaSalle County silica sand mine tour landed us in Troy Grove 13 miles north of North Utica by way of Interstate 39. It was here that I visited several vantage points around Technisand’s MBI Manley Bros. silica mine. The expanse included the site’s mixture of old and new processing infrastructure, what appeared to be an alluvial fan derived from sand waste and associated wetland, and the mine’s far reaches alongside a Chicago and North Western Transportation Company (CNW) railroad.
So now that I have outlined my tour of La Salle County I thought it would be helpful to share some of the stories residents told me during my travels and later by way of email.
Anna Mattes – La Salle County, IL
I live in LaSalle County, Illinois where I have prime farmland and Starved Rock State Park… the crown jewel of Illinois. I already have a fine farming industry and plenty of tourism as Starved Rock is visited by two million people annually. LaSalle County already has forty two quarries, gravel pits and sand mines. If I allow anymore the county will look as though it has been bombed. Empty sand pits will never produce food ever again. No amount of reclamation will restore this land to be productive…Each mine uses one million gallons of water daily. The LaSalle County Board has enlisted the USGS to do a hydrology study to determine how much water I have in our aquifer for municipalities and farming. Presently I have a moratorium in place on sand mines thru July 2016 and I hope forever. As a woman, wife and mother I am charged with the continuity of life. It is my job, profession, to raise healthy children, make a healthy breakfast and pack a nutritious lunch for my husband so he can do his job, and it generally falls to women to care for the elderly in families. With out clean air, pure water, healthy food what is the quality of life? Fracking is a dangerous business and I need to take better care of Planet Earth. Please do your part, I’m a Master Gardener and I’m doing my part.
Thomas Skomski – Wedron, IL
I am a resident of Wedron who has been severely impacted by Wedron Silica; and I want to report that there are many more problems associated with the influx of sand mines in LaSalle Co. than named in your recent article. In order to be fair to other residents who will be negatively affected by proximity to any sand mine I believe it is important to inform them and all concerned on the unmentioned problems associated with living near a sand mine. For example: the mountains of sand that are produced migrate everywhere the wind takes the particles. As I all know the winds are frequently fierce in this part of the country. One neighbor describes how in the morning when he sets his coffee cup down on his front porch and goes into his house to get the newspaper that he returns to find a layer of white sand covering his coffee. Another neighbor vacuums the sand off her living room rugs weekly while her husband regularly has to clean out sand-filled gutters. I do know that enabling pollutants on private property is technically criminal trespass. At the last EPA hearing in Wedron a retired mine employee admitted that Wedron Silica uses 100 million gallons of water per hour in sand processing. Some of this water is recycled. Since I have not confirmed those statistics, I prefer sticking to the fact that the mine has reversed the flow of the ground water. Who knows what the unseen consequences of that reversal might be? The toxic plume that Wedron Silica is in part responsible for creating migrates wherever the ground water moves. As a result of the threat of my well being poisoned my land, 23 acres has been devalued by the county to $1.00. All my five buildings are worth 40% of what they were before nine wells were poisoned in Wedron. Those wells were so toxic with benzene that water came out of the faucet orange and you could not breath it let alone use it to wash anything. Wedron Silica has begun buying homes in Wedron which will allow them to pursue their wealth with no concerns- BUT what about the water which I all know is in limited supply and susceptible to being polluted? So in summary, please include the human costs involved in a mine opening near you. My wife and I moved to the country to enjoy the solitude and quiet of living on a farm in our retirement years. The quality of our lives has been diminished, in addition the noise is disturbing; trains come in at all hours incessantly blowing their horns and the semi traffic is constant. Finally, I have heard a lot of what I consider negative criticism about the EPA. Having experienced this monumental problem directly it is perfectly clear to me that without the resources of a pro-environment organization I would be hard pressed to stand up to a corporation with multi billions in assets.
Ashley Williams – LaSalle County, IL
The nickname the “Silica Sand Capital of the World” has quickly transformed into a curse rather than a blessing for the citizens of LaSalle County, IL. Here, the frac sand industry continues to proliferate, endangering the health and safety of the people and local environment. Our precious life vessels: our air, water, and soil are under siege by a nexus of power that seeks to intimidate us into quiet submission, but I’ll be damned if I’m going to sit by and let that happen.
Stay Tuned
In Part 2 of this series, I will cover our frac sand tour in Michigan’s Monroe and Mason counties, where the aforementioned U.S. Silica along with Sargent Sand and Sylvania Minerals are making their presence felt in more ways than one.
Footnote
This facility alone processes nearly 2% of all oil in North America on a daily basis. This facility is the seventh-largest refinery in the United States and the largest outside of the Gulf Coast.
By Ted Auch, Great Lakes Program Coordinator, and Elliott Kurtz, GIS Intern
The Great Lakes may see a major increase in the number of sand mines developed in the name of fracking. What impacts has the area already seen, and does future development mean for the region’s ecosystem and land use?
Wisconsin’s 125+ silica sand mines and processing facilities are spread out across 15,739 square miles of the state’s West Central region, adjacent to the Minnesota border in the Northern Mississippi Valley. These mines have dramatically altered the landscape while generating proppant for the shale gas industry; approximately 2.5 million tons of sand are extracted per mine. The length of the average shale gas lateral well grows by > 50 feet per quarter, so we expect silica sand usage will grow from 5,500 tons to > 8,000 tons per lateral. To meet this increase in demand, additional mines are being proposed near the Great Lakes.
Migration of the sand industry from the Southwest to the Great Lakes in search of this silica sand has had a large impact on regional ecosystem productivity and watershed resilience[1]. The land in the Great Lakes region is more productive, from a soil and biomass perspective; much of the Southwest sandstone geology is dominated by scrublands that have accrue plant biomass at much slower rates, while the Great Lakes host productive forests and agricultural land. Great Lakes ecosystems produce 1.92 times more soil organic matter and 1.46 times more perennial biomass than Southwestern ecosystems.
Effects on the Great Lakes
Quantifying what the landscape looks like now will serve as a baseline for understanding how the silica sand industry will have altered the overall landscape, much like Appalachia is doing today in the aftermath of strip-mining and Mountaintop Removal Mining[2]. West Central Wisconsin (WCW) has a chance to learn from the admittedly short-cited and myopic mistakes of their brethren across the coalfields of Appalachia.
Herein we aim to present numbers speaking to the diversity and distribution of WCW’s “working landscape” across eight types of land-cover. We will then present numbers speaking to how the silica mining industry has altered the region to date and what these numbers mean for reclamation. The folks at UC Berkeley’s Department of Environmental Science, Policy , and Management describe “Working Landscapes” as follows:
a broad term that expresses the goal of fostering landscapes where production of market goods and ecosystem services is mutually reinforcing. It means working with people as partners to create landscapes and ecosystems that benefit humanity and the planet… A goal is finding management and policy synergies—practices and policies that enhance production of multiple ecosystem services as well as goods for the market…Collaborative management processes can help discover synergies and create better decisions and policy. Incentives can help private landowners support management that benefits society.
Methods
We used the 1993 WISCLAND satellite imagery to determine how WCW’s landscape is partitioned and then we applied these data to an updated inventory of silica sand mine boundaries to determine what existed within their boundaries prior to mining. The point locations of Wisconsin’s current inventory of silica sand mines was determined using the “Geocode Address” function in ArcMap 10.2 using the Composite_US Address Locator. Addresses were drawn from mine inventory information originally maintained by the West Central WI Regional Planning Commission (WCWRPC) and now managed by the WI Department of Natural Resources’ Mines, pits and quarries division. Meanwhile current mine extent boundary polygons were determined using one of three satellite data-sets:
Fig 1. Square mileage of various land cover types replaced by silica sand mining in WCW
Thirty-nine percent of the WCW landscape is currently allocated to forests, 43% to agriculture broadly speaking, and 13% is occupied by various types of wetlands. Open waters occupy 2.6% of the landscape with tertiary uses including barren lands (1.3%), golf courses (0.03%), high and low-density urban areas (0.9%), and miscellaneous shrublands (0.6%) (See Figure 1).
Effects by Land Cover Type
Fig 2. Forest Cover in WCW
Fig 3. Agricultural Cover
Fig 4. Open Water & Wetland Cover
Fig 5. Forested Wetland Cover
Fig 6. Lowland Shrub Wetlands
Fig 7. Miscellaneous Cover
Figure 2. The wood in these forests has a current stumpage value of $253-936 million and by way of photosynthesis accumulates 63 to 131 million tons of CO2 and has accumulated 4.8-9.8 billion tons of CO2 if we assumed that on average forests in this region are 65-85 years old. Putting a finer point on WCW forest cover and associated quantifiables is difficult because most of these tracts (2.7 million acres) fall within a catchall category called “Mixed Forest”. Pine (2.3% of the region), Aspen (4.7%), and Oak (3.8%) most of the remaining 1.2 million forested acres with much less sugar (Acer saccharum) and soft (Acer rubrum) maple acreage than we expected scattered in a horseshoe fashion across the Northeastern portion of the study area.
Figure 3. Seven different agricultural land-uses occupy 4.3 million WCW acres with forage crops and grasslands constituting 29% of the region followed by 1.4 million acres of row crops and miscellaneous agricultural activities. Additionally, 2% of WI’s 19,700 cranberry bog acres are within the study area generating $4.02 million worth of cranberries per year. The larger agricultural categories generate $3.2 billion worth of commodities.
Figure 4. Nearly 16% of WCW is characterized by open waters or various types of wetlands with a total area of 2,396 square miles clustered primarily in two Northeast and one Southeast segment. Open waters occupy 398 square miles with forested wetlands – possibly vernal pool-type systems – amounting to 5.4% of the region or 841 square miles. Lowland shrub and emergent/wet meadows occupy 540 and 618 square miles, respectively.
Figure 5. Of the nine types of wetlands present in this region the forested broad-leaved deciduous and emergent/wet meadow variety constitute the largest fraction of the region at 1,107 square miles (7.1% of region). Some percentage of the former would likely be defined by Wisconsin DNR as vernal pools, which do the following according to their Ephemeral Pond program. The WI DNR doesn’t include silica sand mining in its list of 14 threats to vernal pools or potential conservation actions, however.
These ponds are depressions with impeded drainage (usually in forest landscapes), that hold water for a period of time following snowmelt and spring rains but typically dry out by mid-summer…They flourish with productivity during their brief existence and provide critical breeding habitat for certain invertebrates, as well as for many amphibians such as wood frogs and salamanders. They also provide feeding, resting and breeding habitat for songbirds and a source of food for many mammals. Ephemeral ponds contribute in many ways to the biodiversity of a woodlot, forest stand and the larger landscape…they all broadly fit into a community context by the following attributes: their placement in woodlands, isolation, small size, hydrology, length of time they hold water, and composition of the biological community (lacking fish as permanent predators).
Figure 6. Broad-leaved evergreen lowland shrub wetlands constitute ≈2.1% of the region or 319 square miles with most occurring around the Legacy Boggs silica mines and several cranberry operations turned silica mines in Jackson County. Meanwhile broad-leaved deciduous and needle-leaved lowland shrub wetlands are largely outside the current extent of silica sand mining in the region occupying 1.9% of the region with 293 square miles spread out within the northeastern 1/5th of the study area.
Figure 7. Finally, miscellaneous land-covers include 200 square miles of barren land, 145 square miles of low/high intensity urban areas including the cities of Eau Claire (Pop. 67,545) and Stevens Point (Pop. 26,670) as well as towns like Marshfield, Wisconsin Rapids, Merrill, and Rib Mountain-Weston. WCW also hosts 3,204 acres (0.03% of region) worth of golf courses which amounts to roughly 21 courses assuming the average course is 157 acres. Shrublands broadly defined occur throughout 0.6% of the region scattered throughout the southeast corner and north-central sixth of the region, with the both amalgamations poised to experience significant replacement or alteration as they are adjacent to two large silica mine groupings.
Producing Mine Land-Use/Land-Cover Change
To date we have established the current extent of land-use/land-cover change associated with 25 producing silica mines occupying 12 square miles of WCW. These mines have displaced 3 square miles of forests and 7 square miles of agricultural land-cover. These forested tracts accumulated 31,446-64,610 tons of CO2 per year or 2.4-4.9 million tons over the average lifespan of a typical Wisconsin forest. These values equate to the emissions of 144,401-295,956 Wisconsinites or 2.5-5.1% of the state’s population. The annual wood that was once generated on these parcels would have had a market value of $126,097-197,084 per year. Meanwhile the above agricultural lands would be generating roughly $1.5-3.3 million in commodities if they had not been displaced.
However, putting aside measurable market valuations it turns out the most concerning result of this analysis is that these mines have displaces 871 acres of wetlands which equals 11% of all mined lands. This alteration includes 158 acres of formerly forested wetlands, 352 acres of lowland shrub wetlands, and 361 acres of emergent/wet meadows. As we mentioned previously, the chance that these wetlands will be reconstituted to support their original plant and animal assemblages is doubtful.
We know that the St. Peter Sandstone formation is the primary target of the silica sand industry with respect to providing proppant for the shale gas industry. We also know that this formation extend across seven states and approximately 8,884 square miles, with all 91 square miles overlain by wetlands in Wisconsin. To this end carbon-rich grasslands soils or Mollisols, which we discussed earlier, sit atop 36% of the St. Peter Sandstone and given that these soils are alread endangered from past agricultural practices as well as current O&G exploration this is just another example of how soils stand to be dramatically altered by the full extent of the North American Hydrocarbon Industrial Complex. The following IFs would undoubtedly have a dramatic effect on the ability of the ecosystems overlying the St. Peter Sandstone to capture and store CO2 to the extent that they are today not to mention dramatically alter the landscape’s ability to capture, store, and purify precipitation inputs.
IF silica sand mining continues at the rate it is on currently
IF reclamation continues to result in “very poor stand of grass with some woody plants of very poor quality and little value on the whole for wildlife. Some areas may be reclaimed as crop land, however it is our opinion that substantial inputs such as commercial fertilizer as well as irrigation will be required in most if not all cases in order to produce an average crop.”
IF the highly productive temperate forests described above are not reassembled on similar acreage to their extent prior to mining and reclamation is largely to the very poor stands of grass mentione above
For example: Great Lakes forests like the ones sitting atop the St. Peter Sandstone capture 20.9 tons of CO2 per acre per year Vs their likely grass/scrublands replacement which capture 10.6-12.8 tons of CO2 per acre per year… You do the math!
“None two sites are capable of supporting the growing of food. They grow trees and some cover grass, but that is all. General scientific research says that the reclaimed soils lose up to 75% of their agricultural productivity.”
Quote from a concerned citizen:
I often wonder what it was like before the boom, before fortunes were built on castles of sand and resultant moonscapes stretched as far as the eye could see. In the past few years alone, the nickname the “Silica Sand Capital of the World” has become a curse rather than a blessing for the citizens of LaSalle County, Illinois. Here, the frac sand industry continues to proliferate and threaten thewellbeing of our people and rural ecosystem.
The US Forest Service defined Watershed Resilience as “Over time, all watersheds experience a variety of disturbance events such as fires and floods [and mining]. Resilient watersheds have the ability to recover promptly from such events and even be renewed by them. Much as treating forests can make them more resilient to wildfire, watershed restoration projects can improve watershed resilience to both natural and human disturbances.”
https://fractracker.org/wp-content/uploads/2015/07/SandMine-WI-Feature.jpg400900Ted Auch, PhDhttps://fractracker.org/wp-content/uploads/2025/09/2025-Wordmark-Logo.pngTed Auch, PhD2015-07-16 14:24:562020-03-12 14:05:24West Central Wisconsin’s Landscape and What Silica Sand Mining Has Done to It


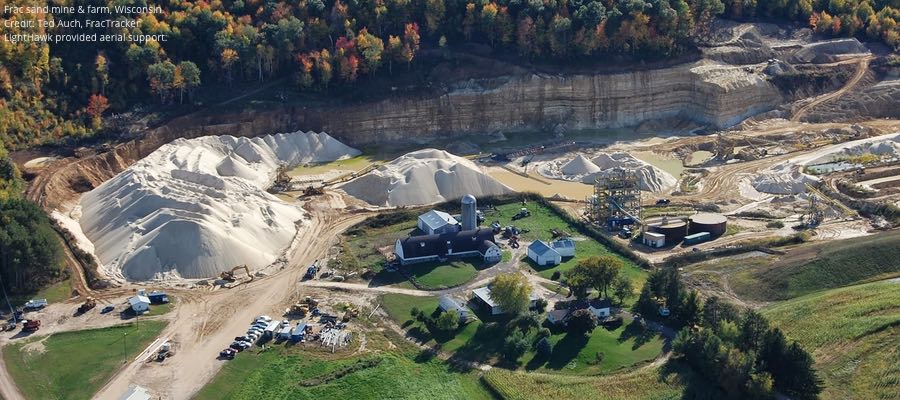
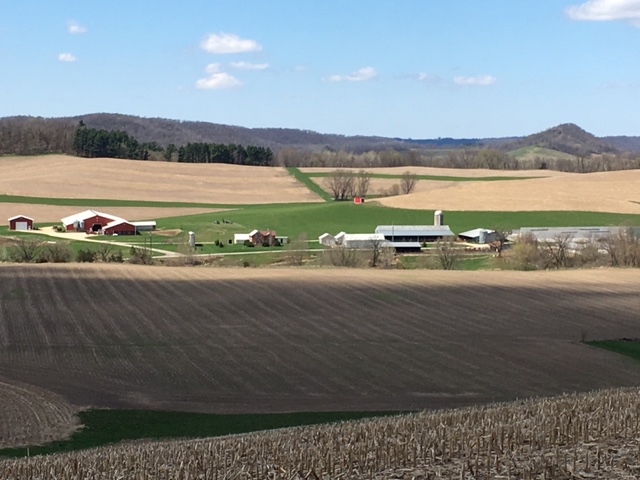
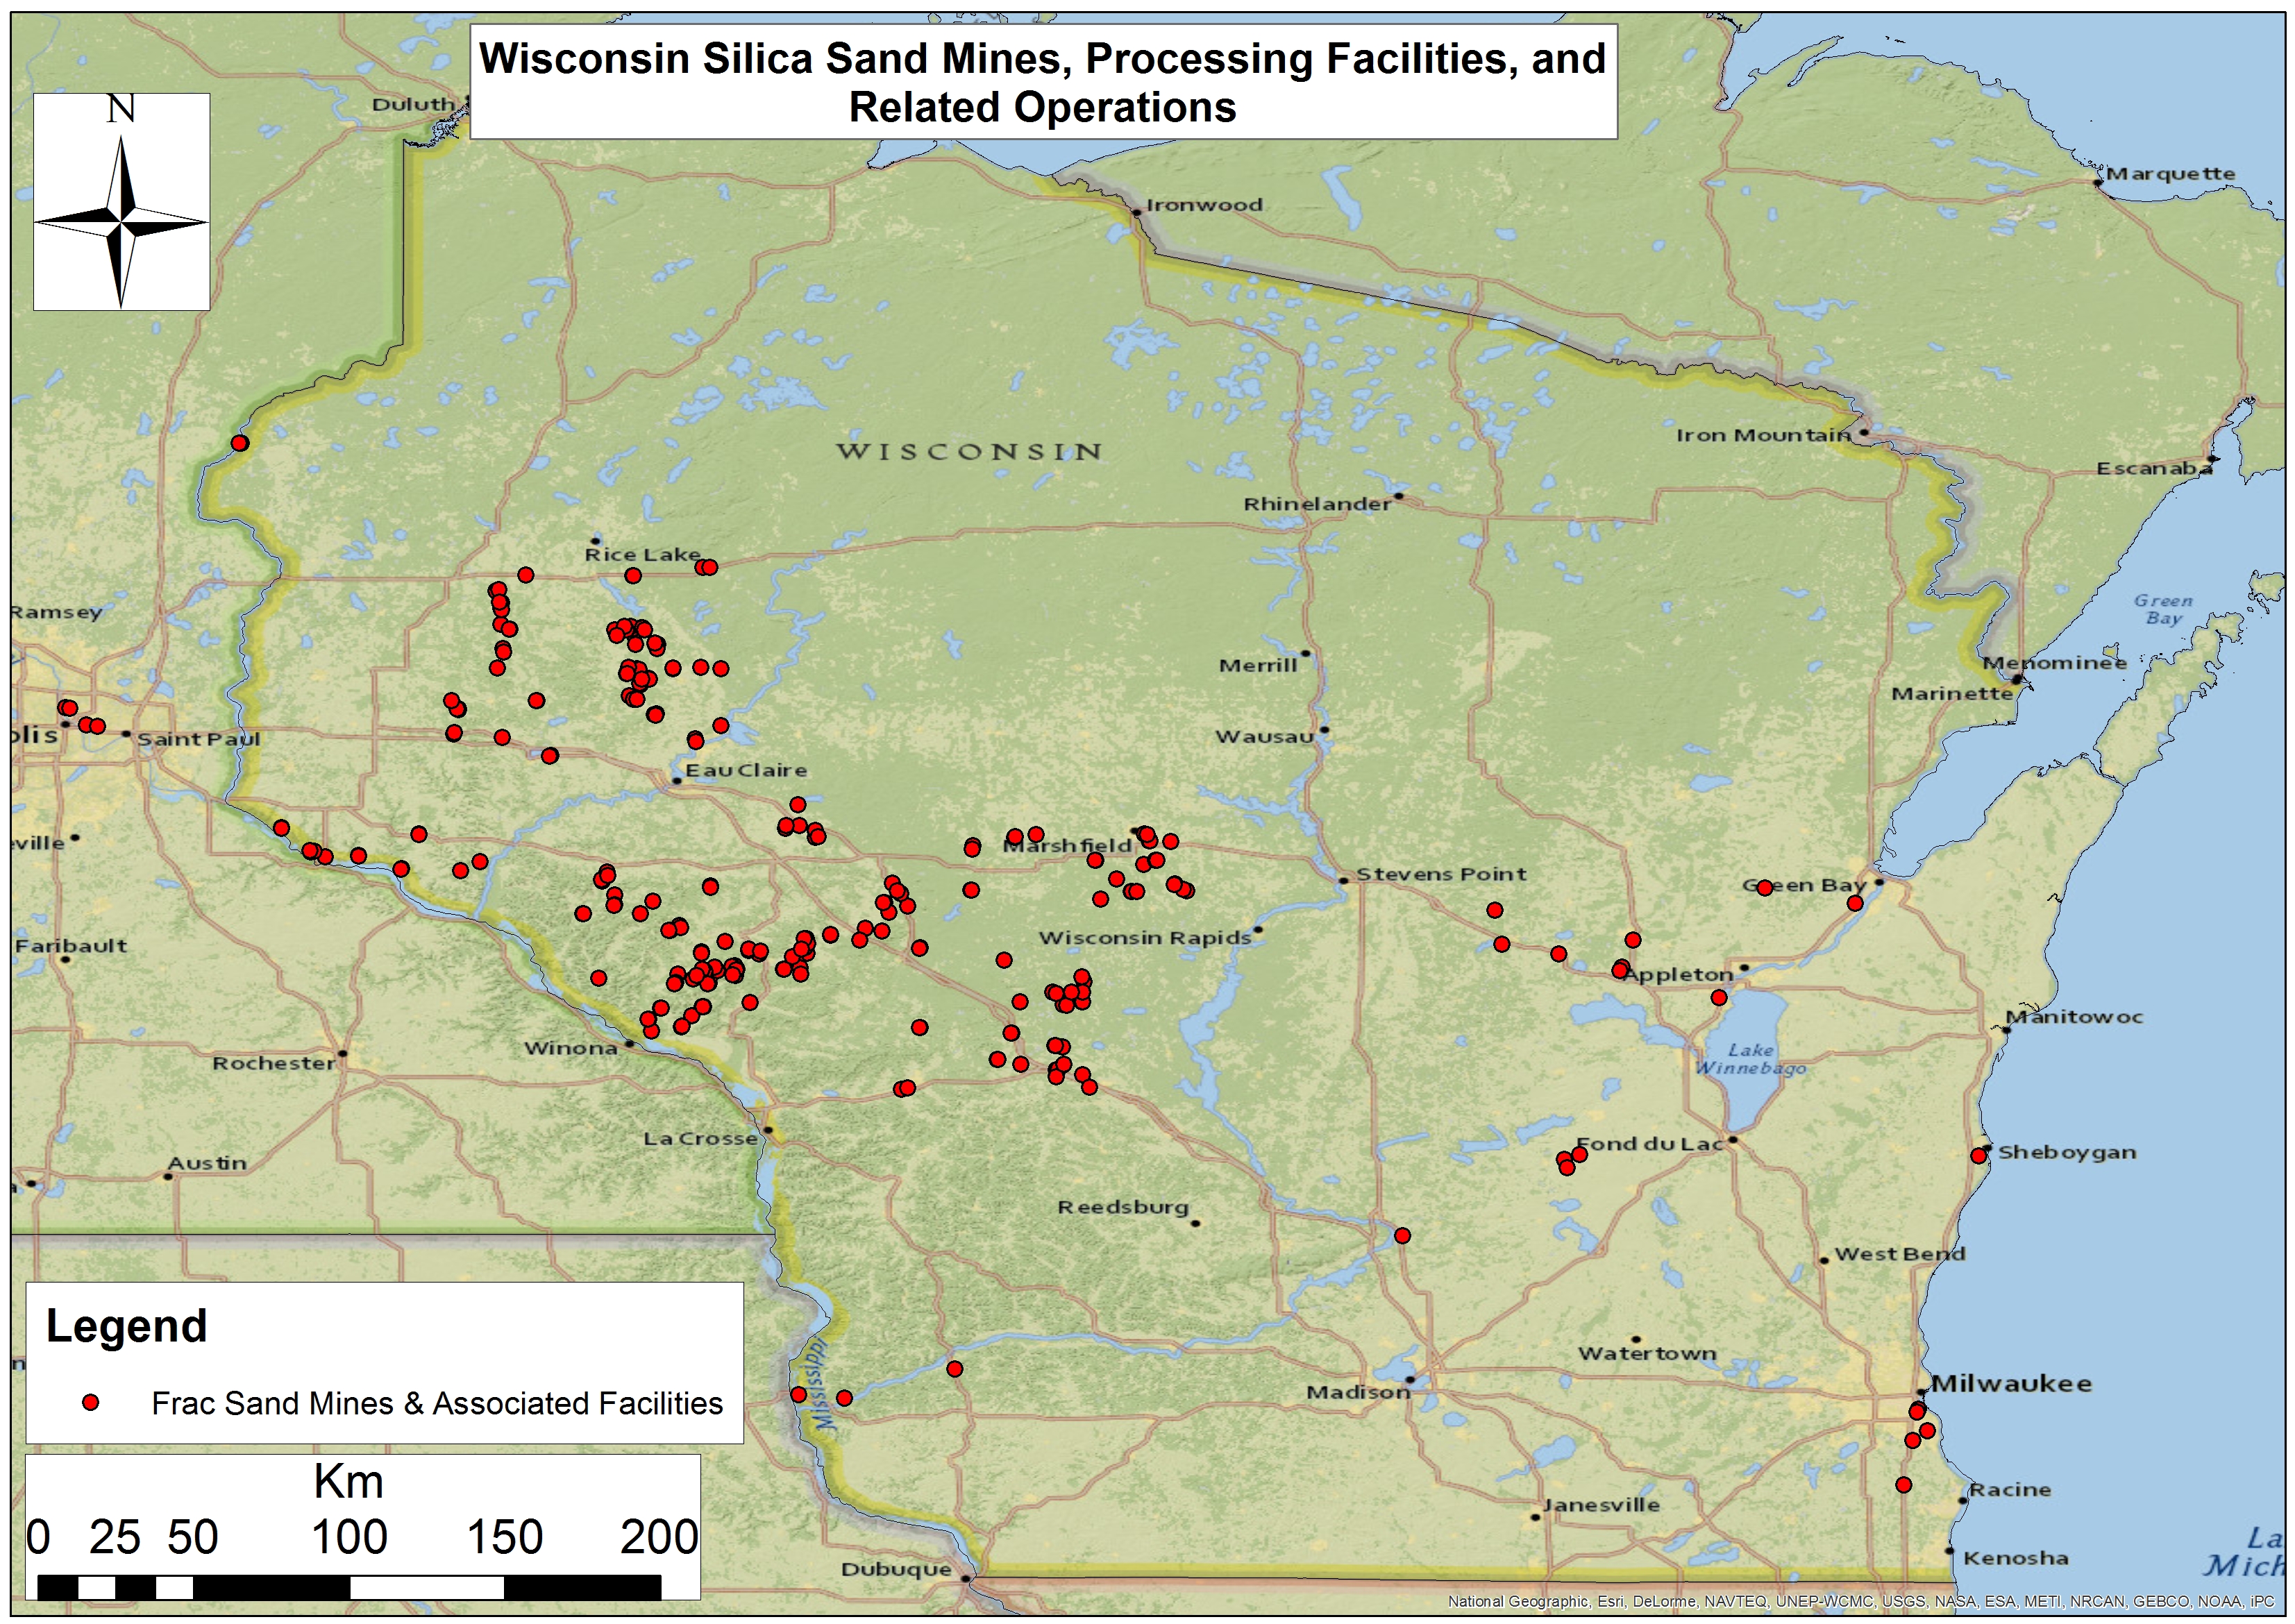
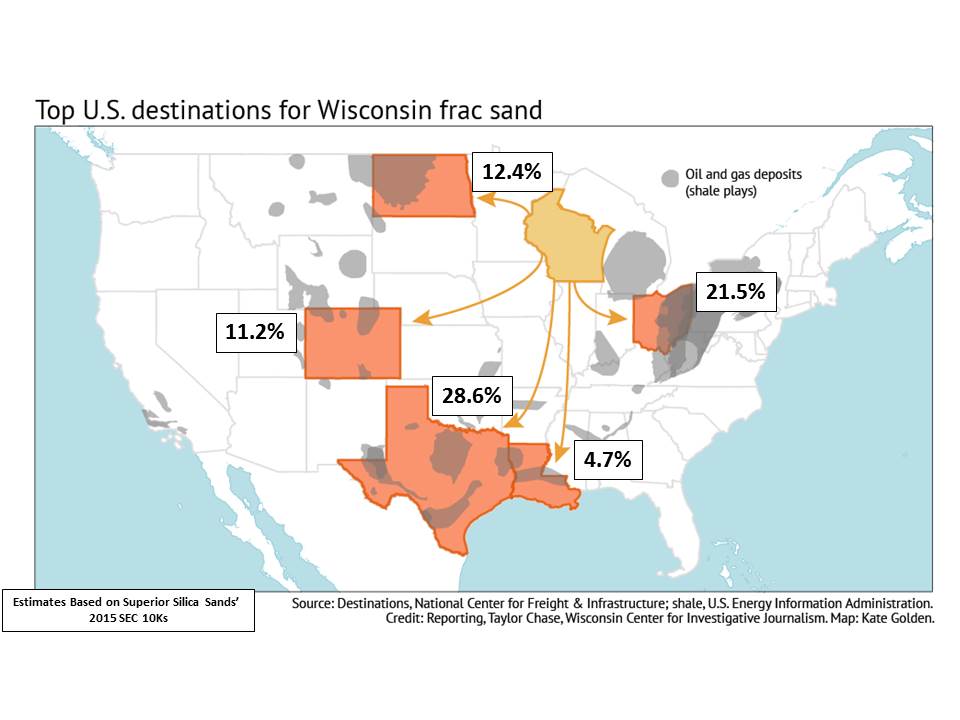
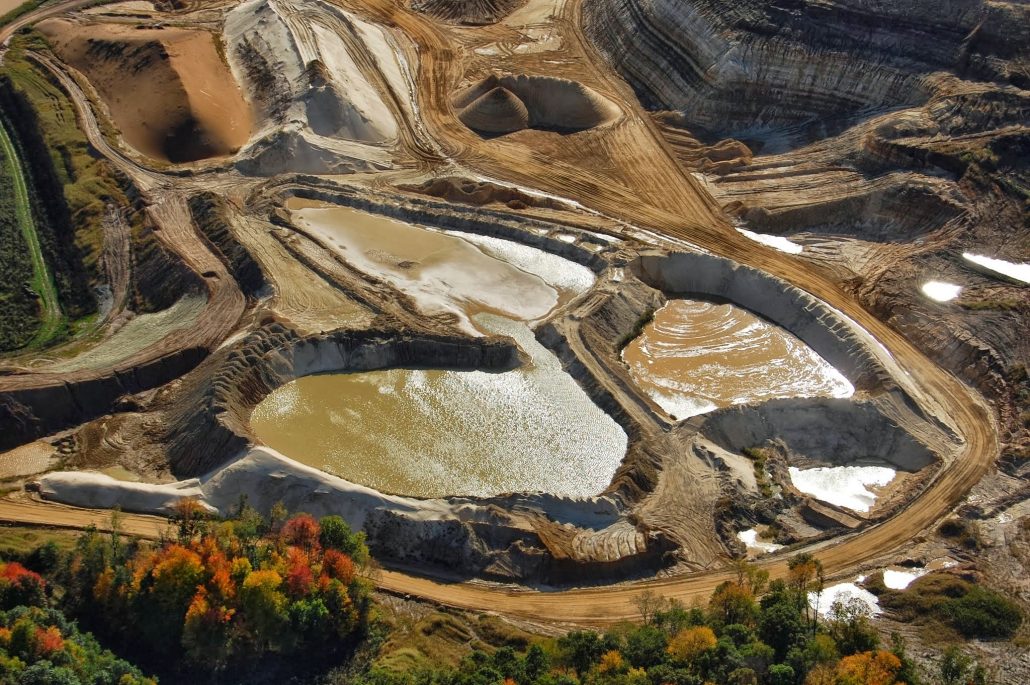
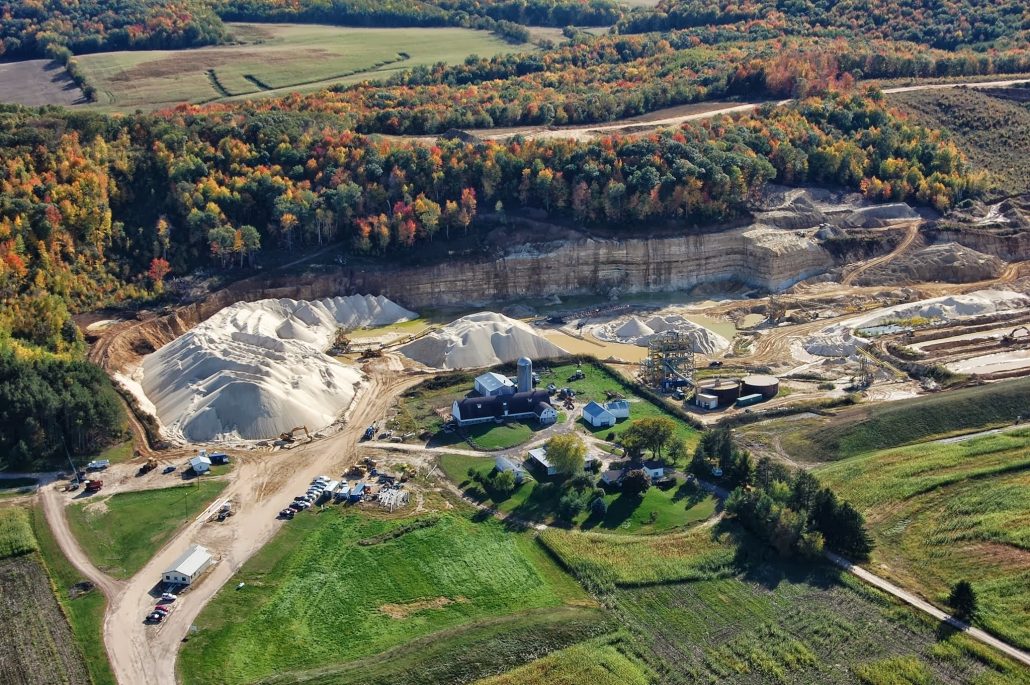

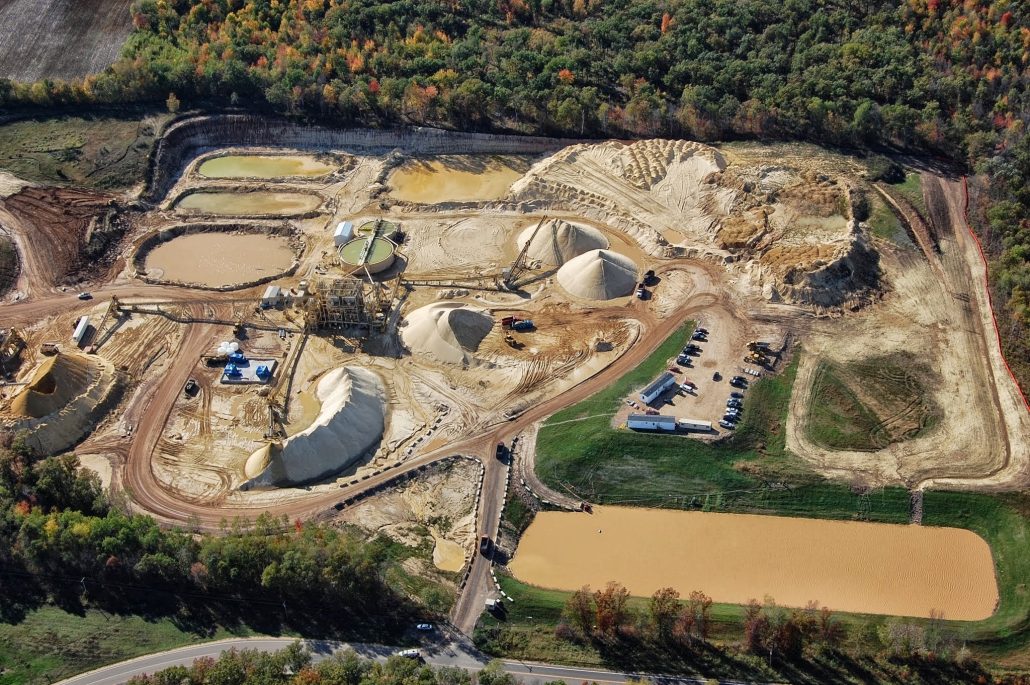
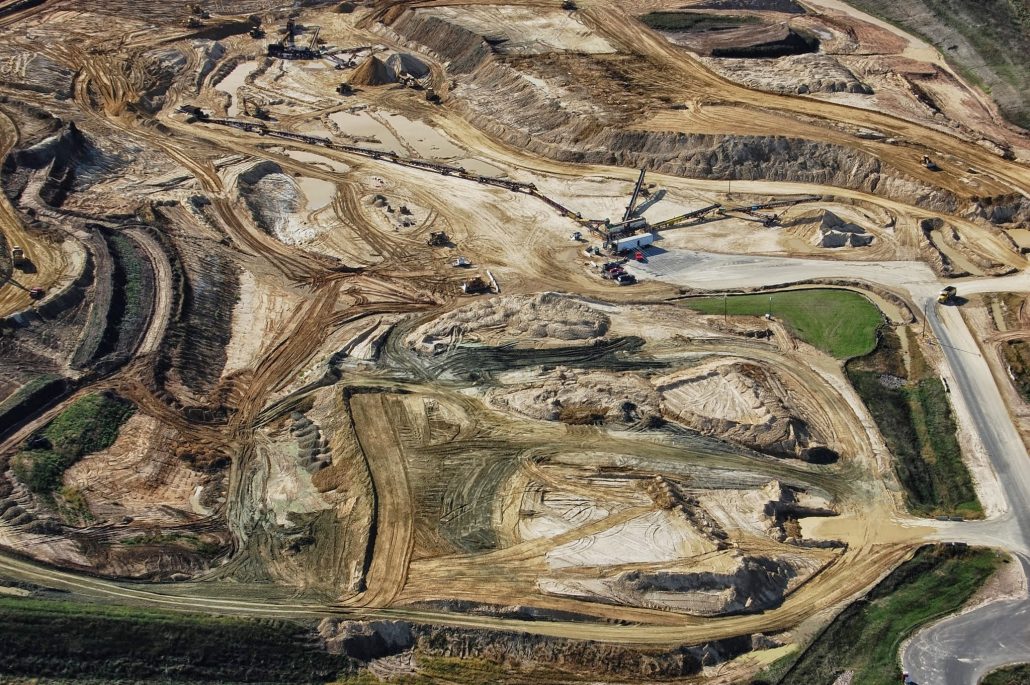
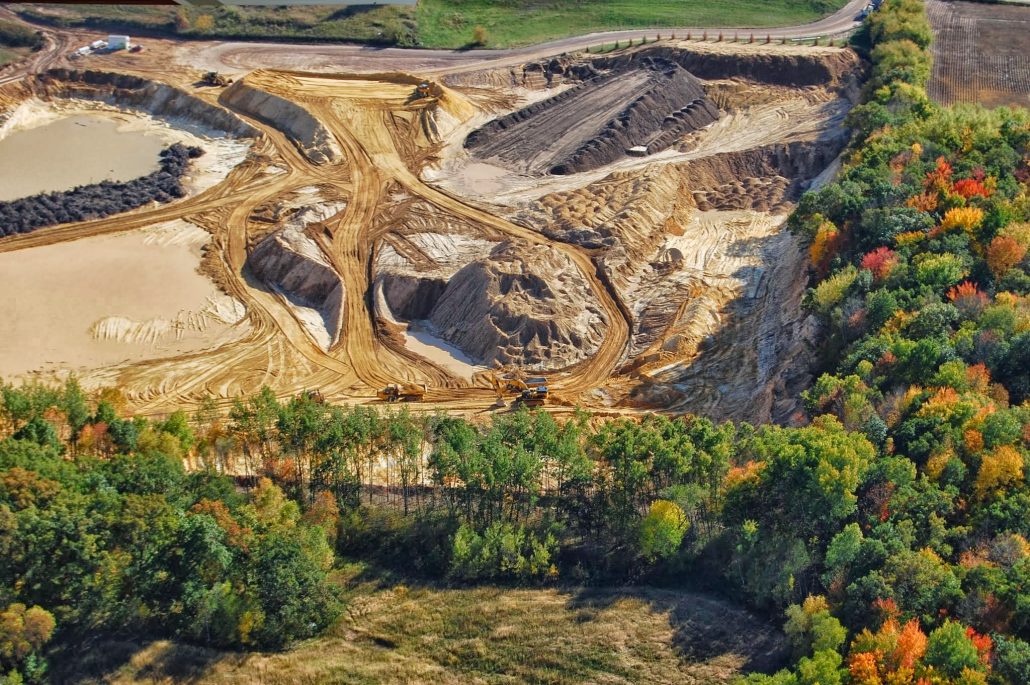
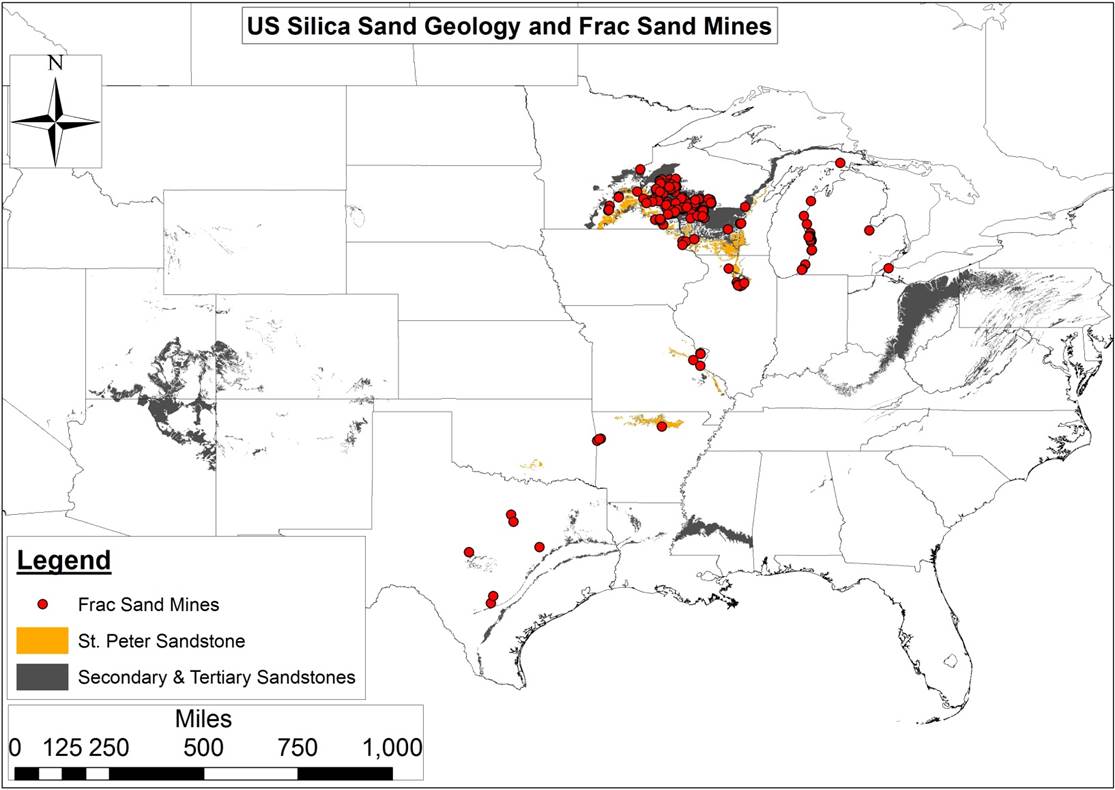
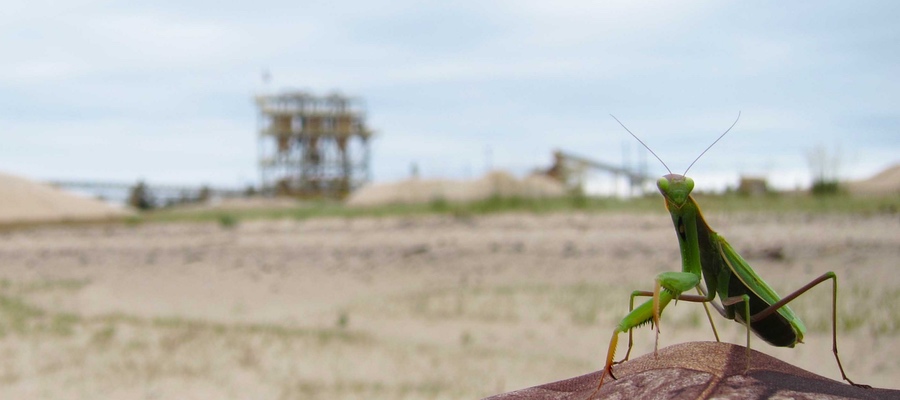


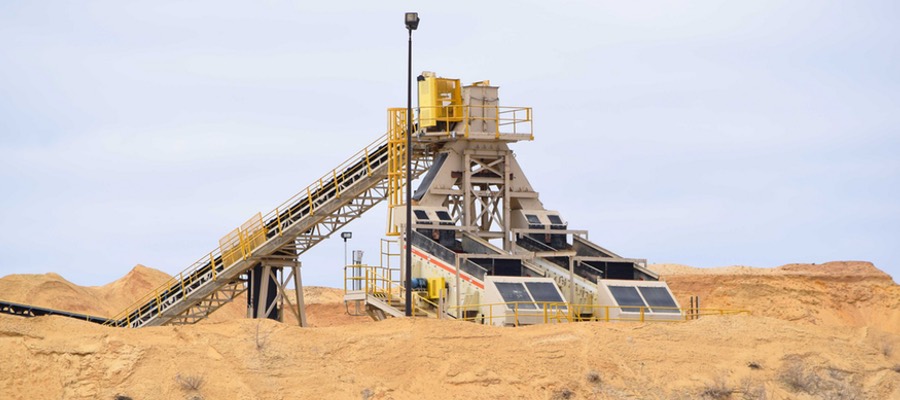


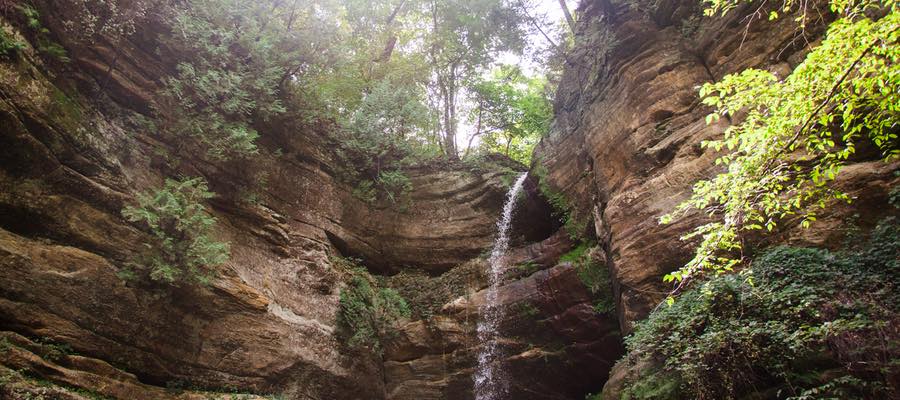


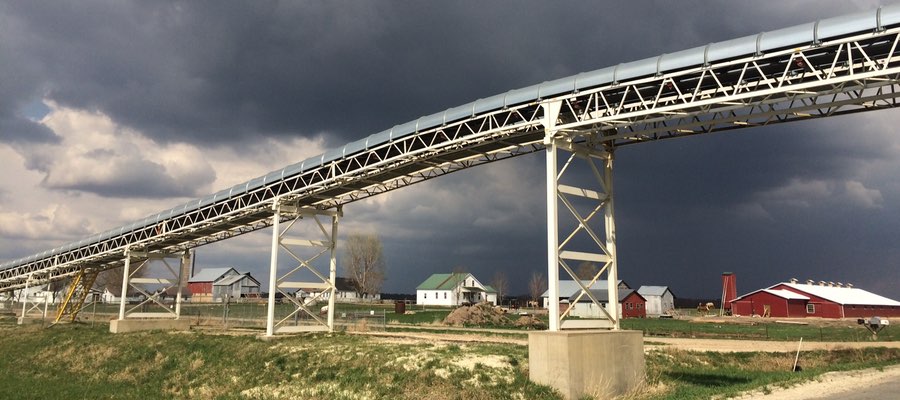

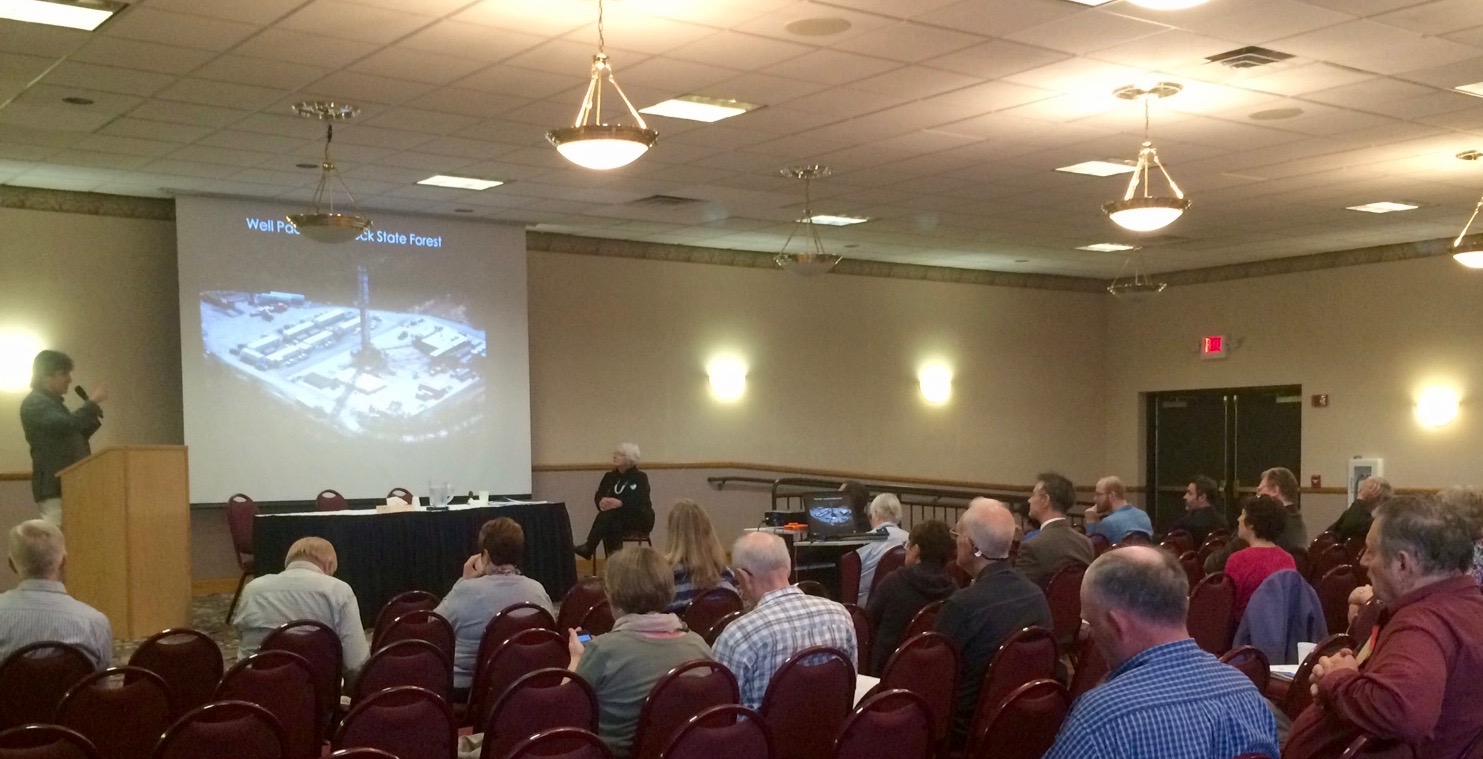


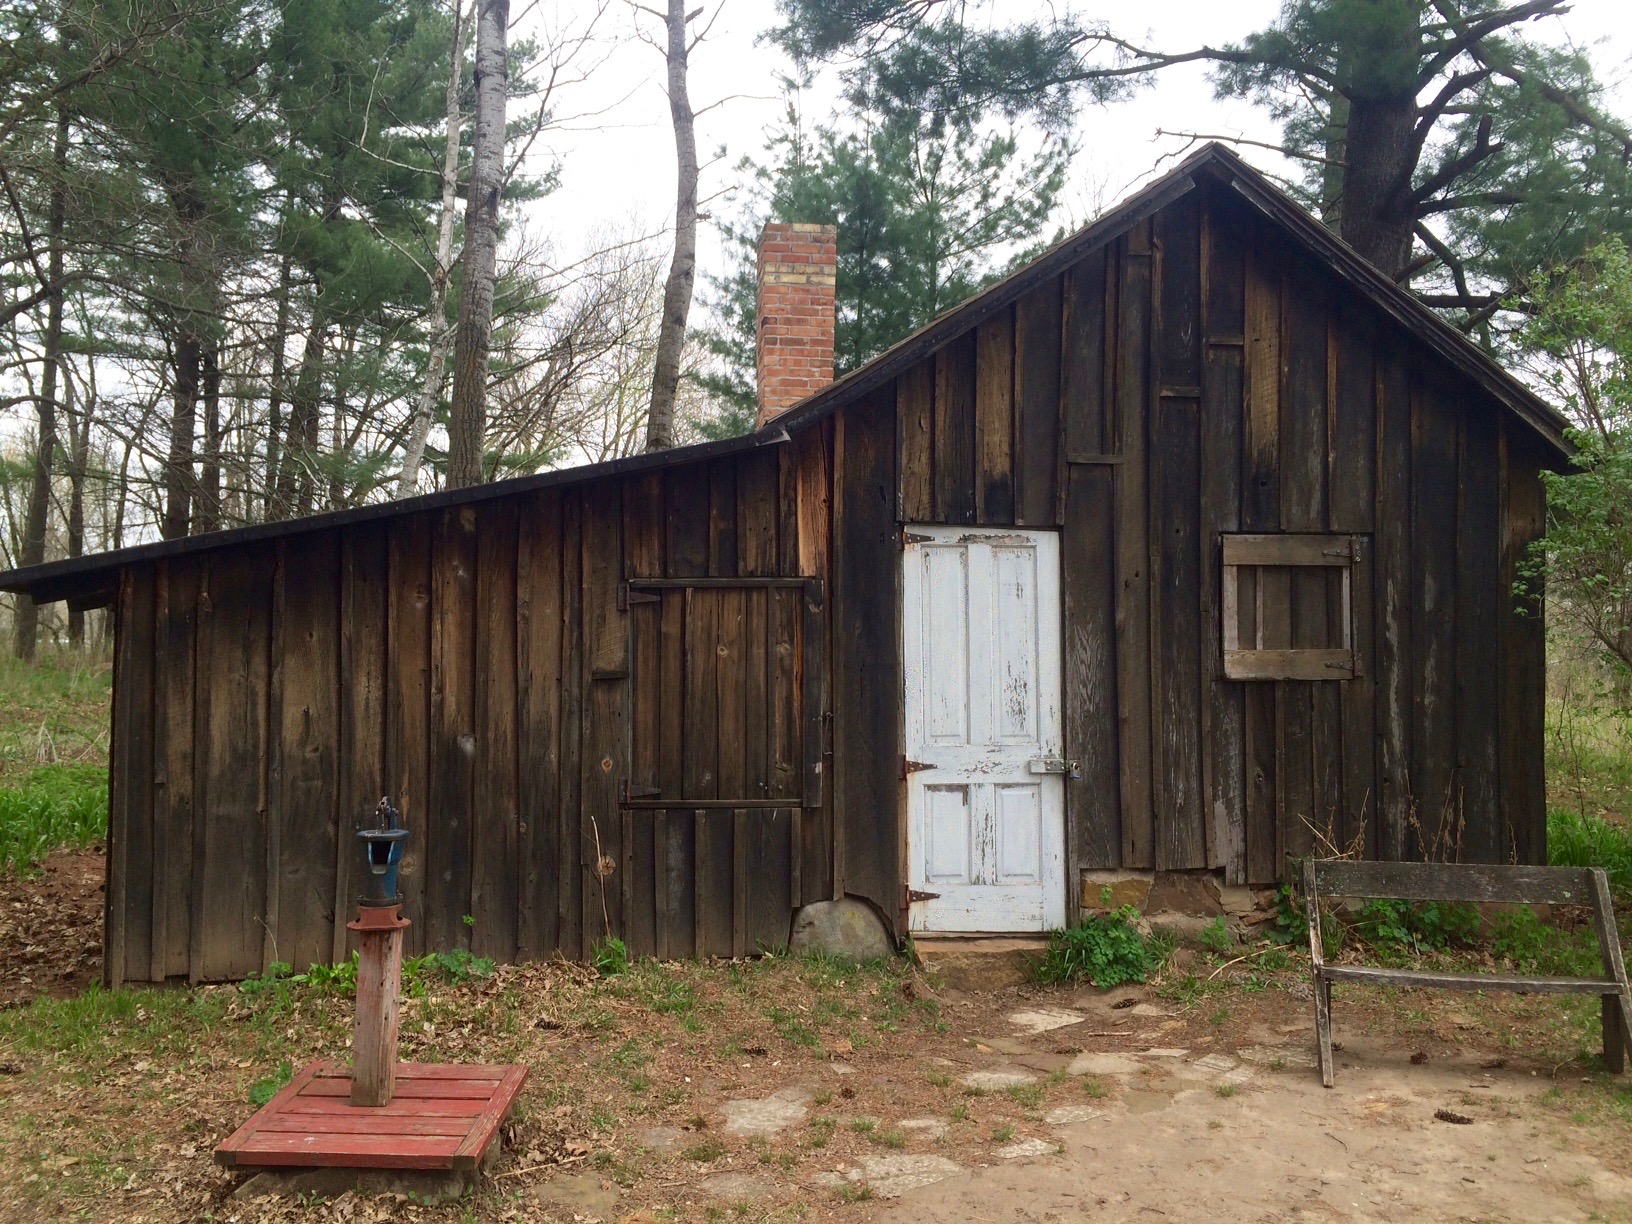
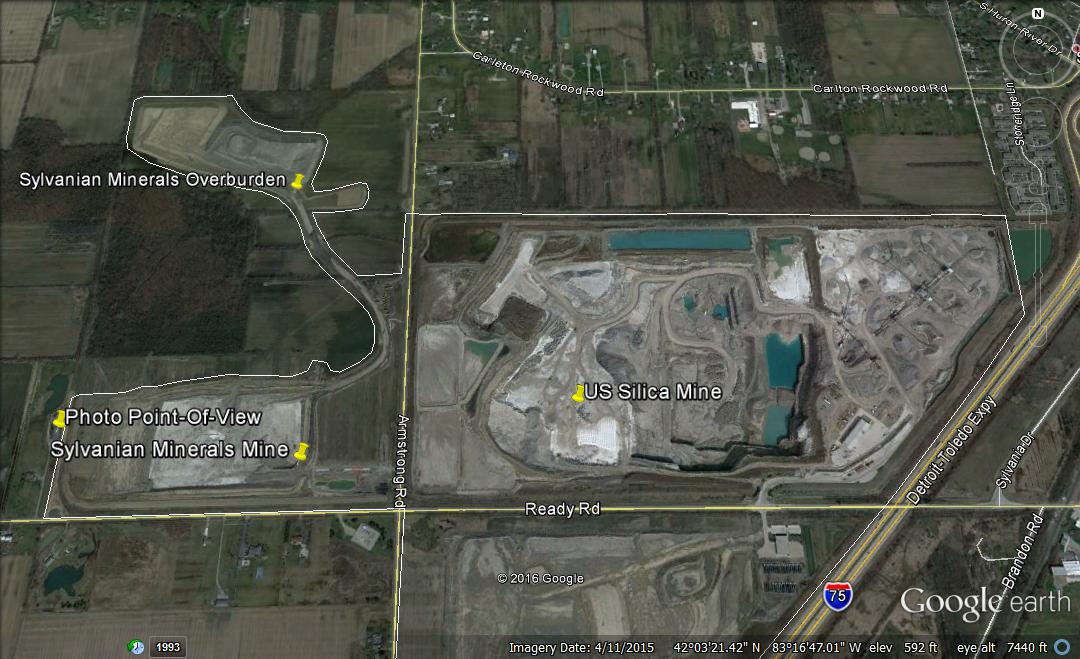
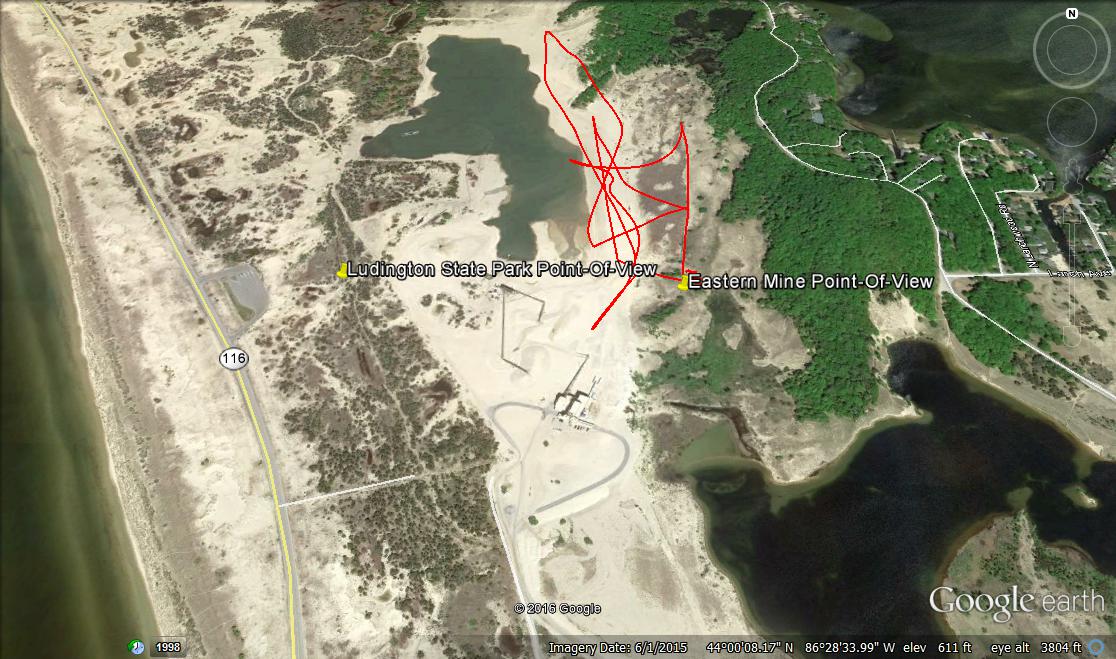
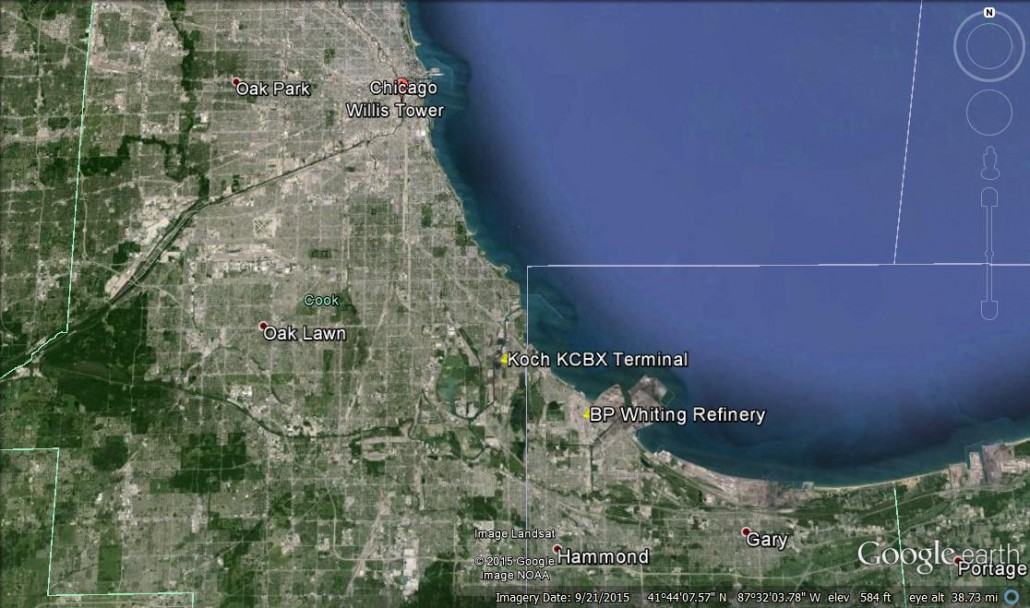


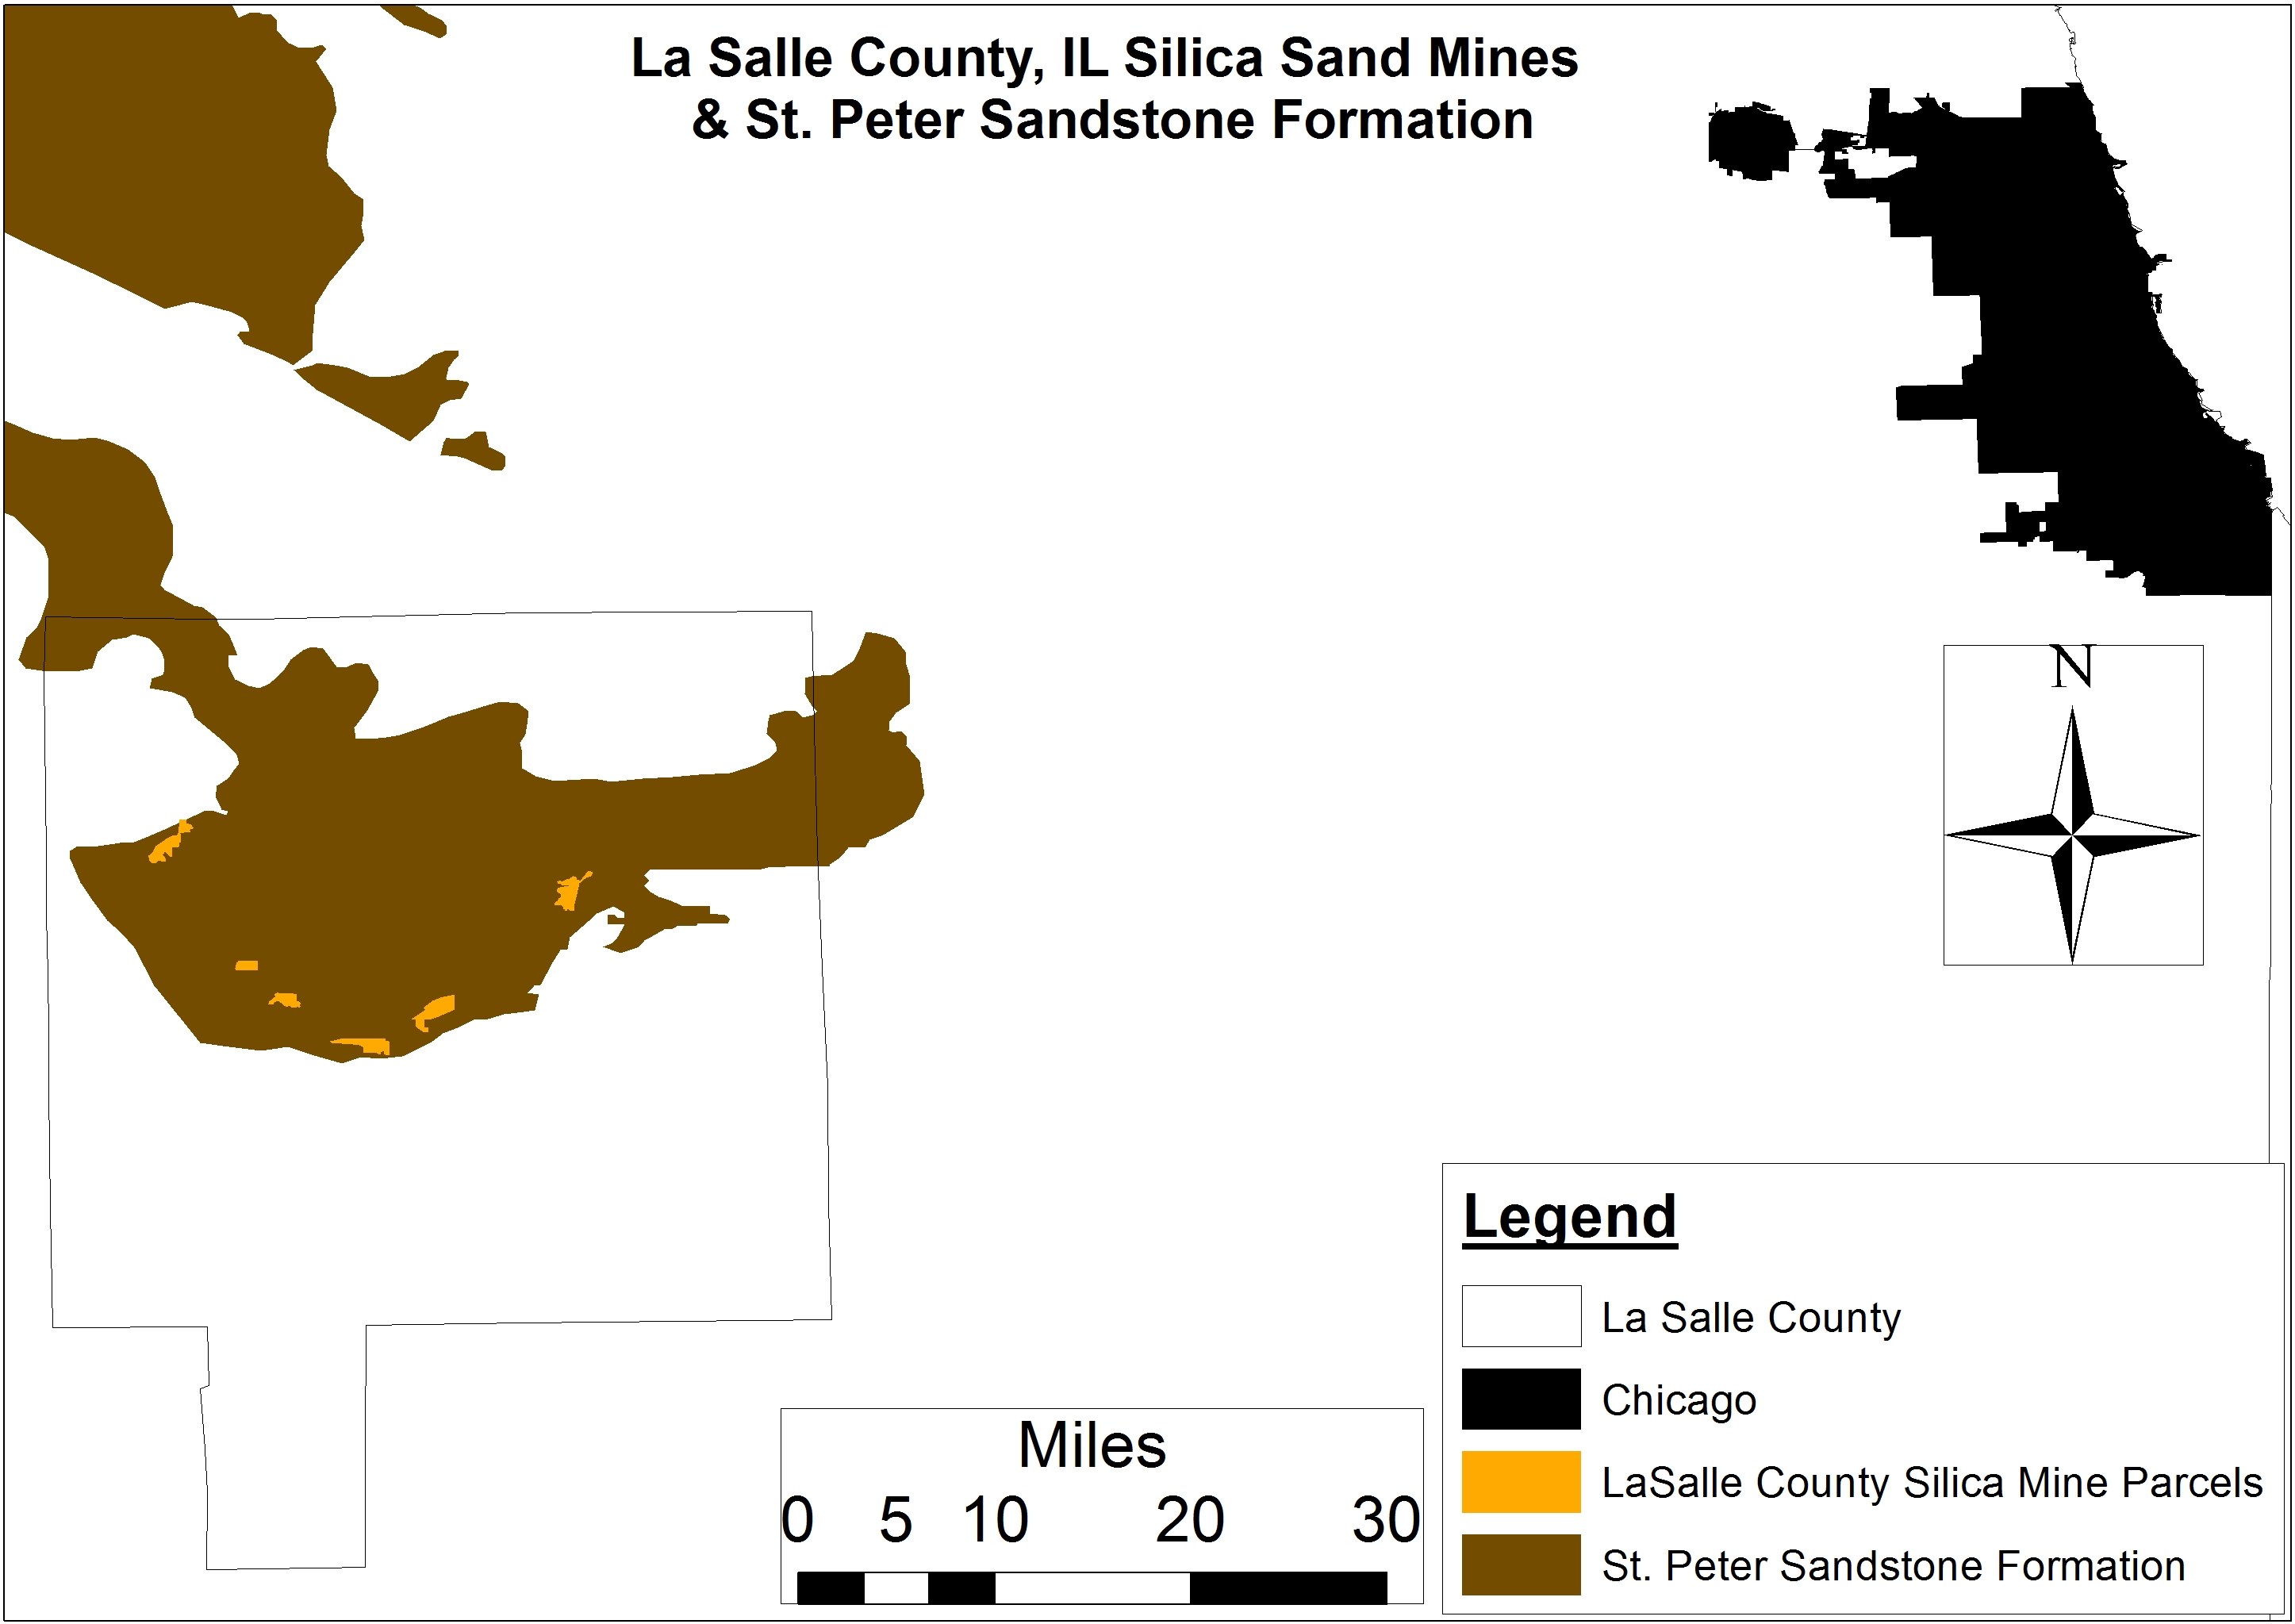
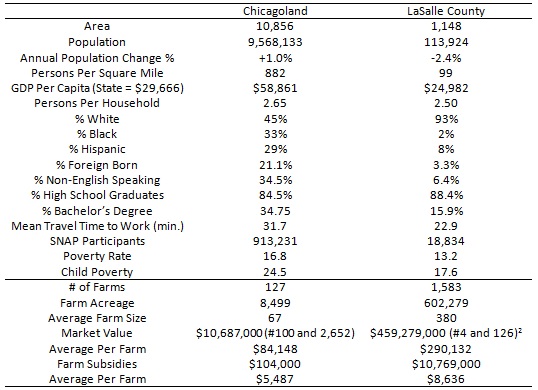


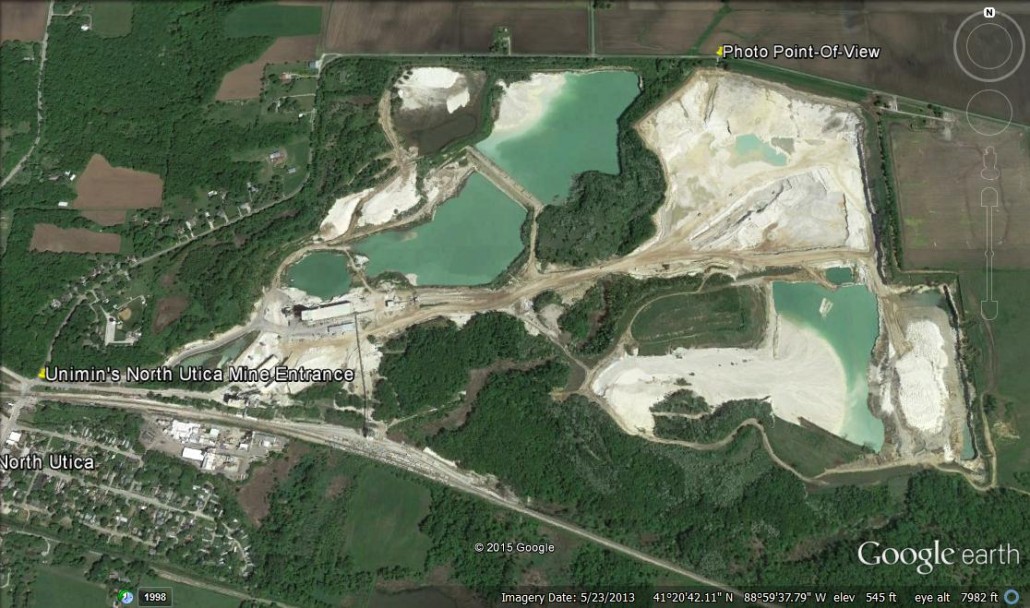


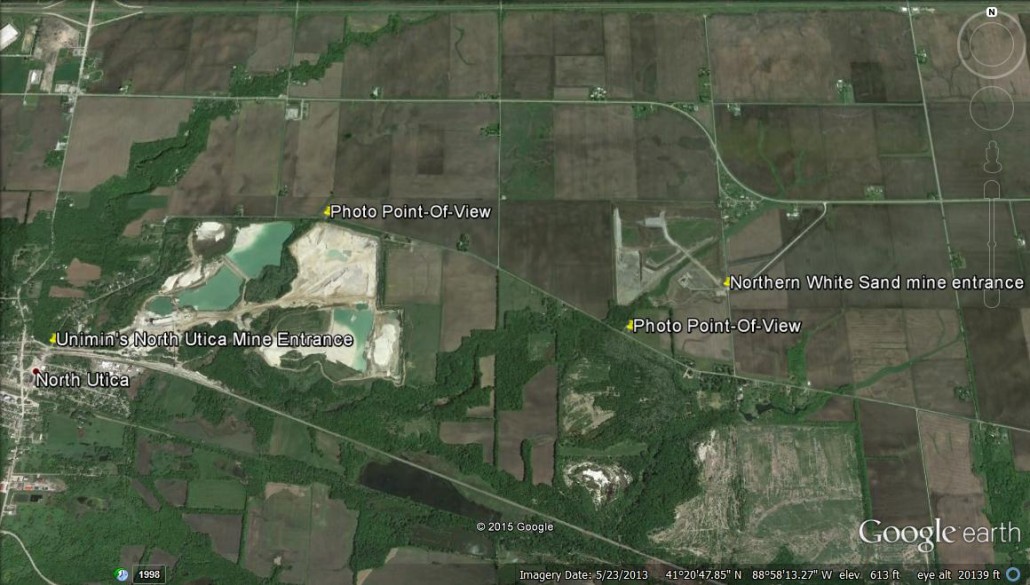
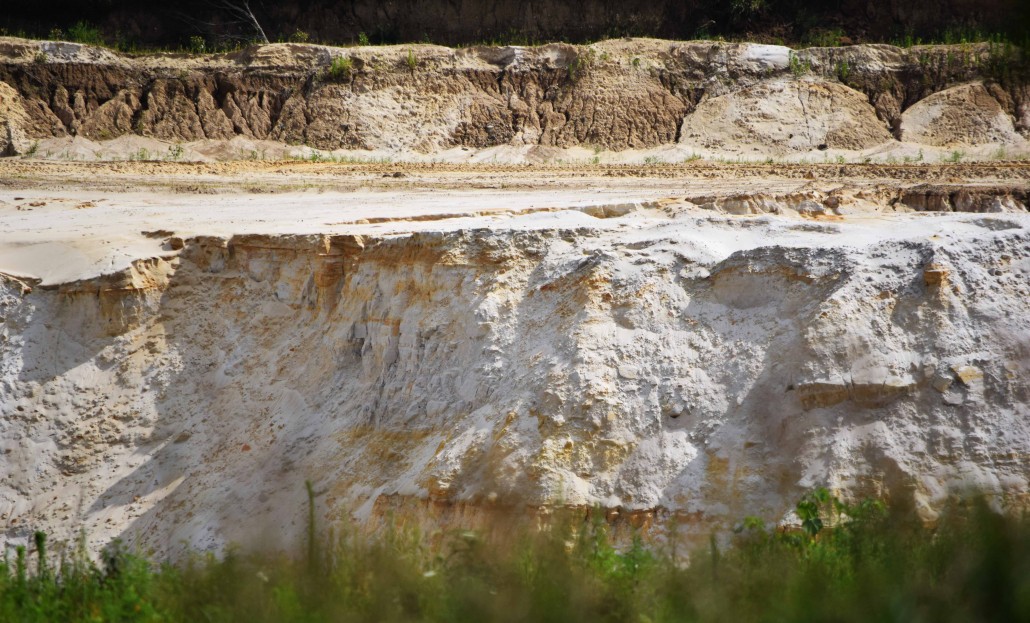
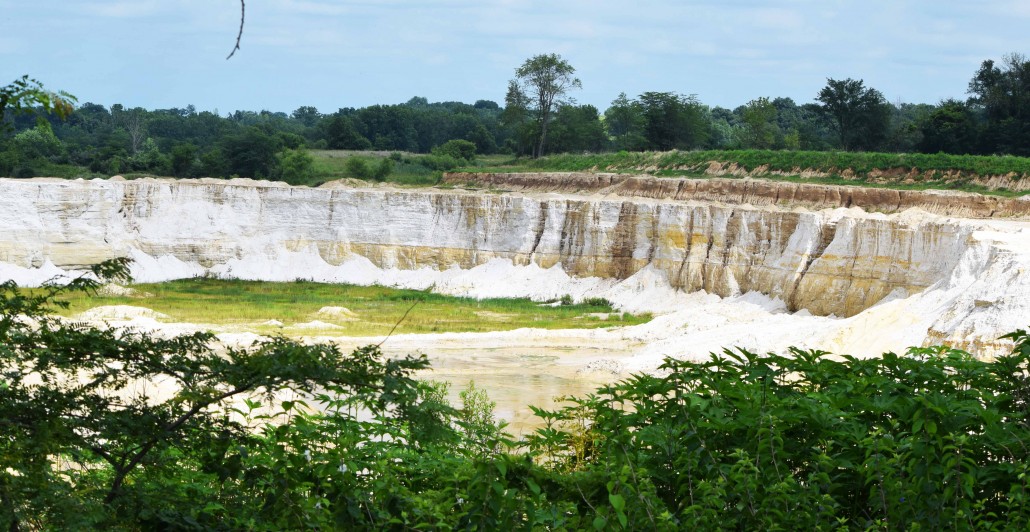

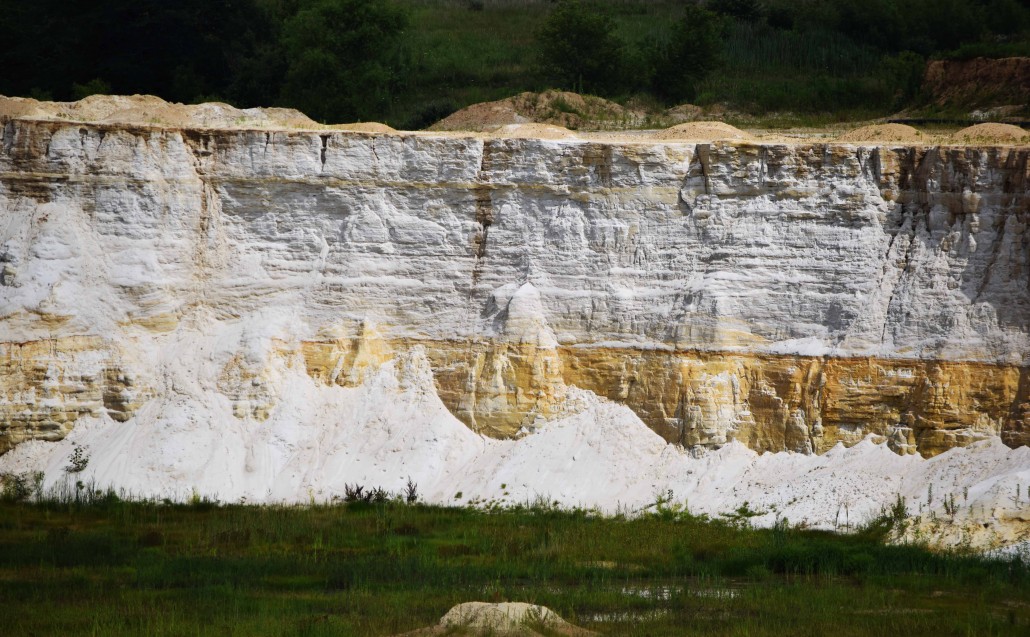
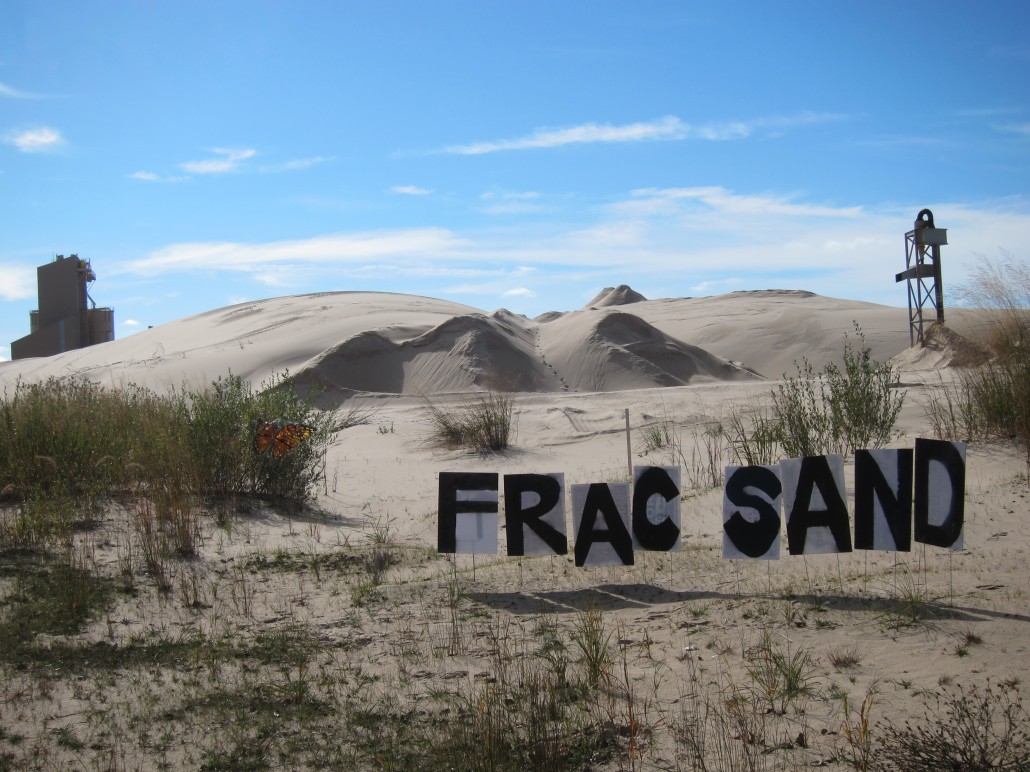

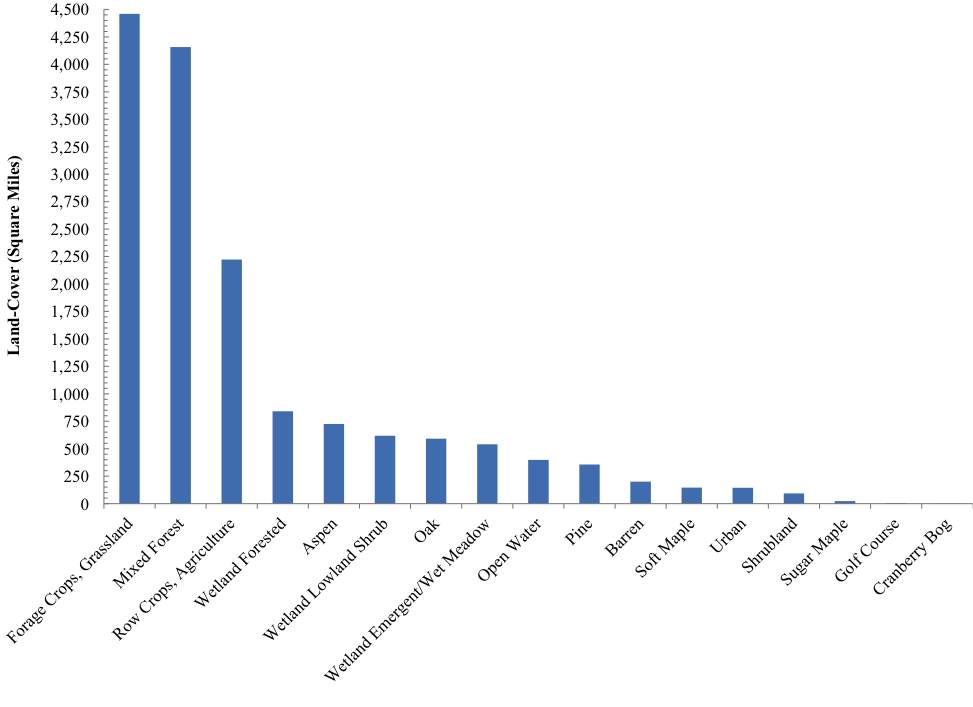
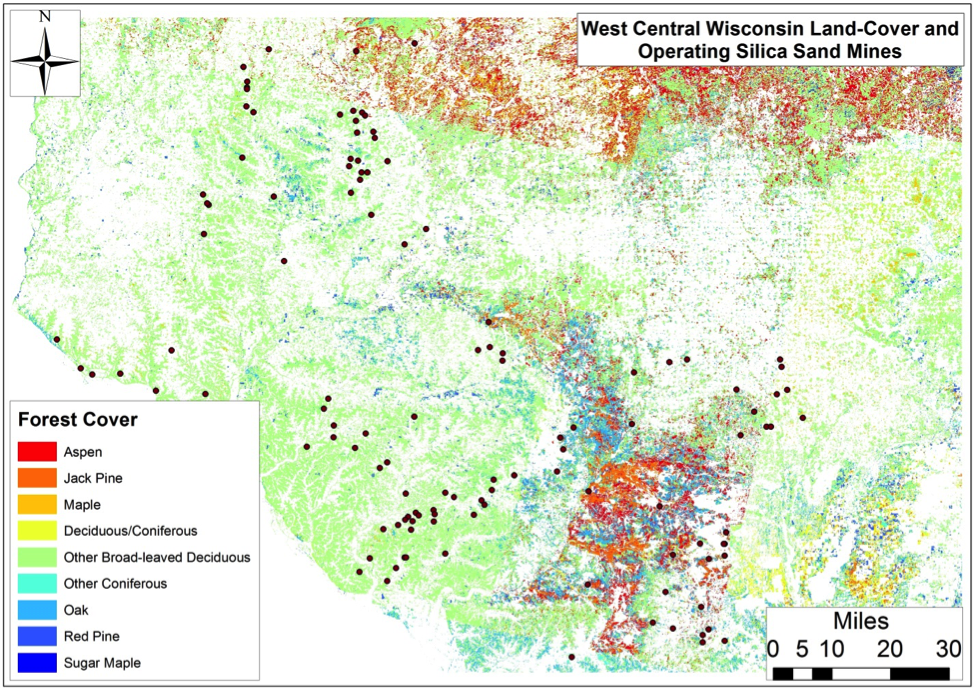
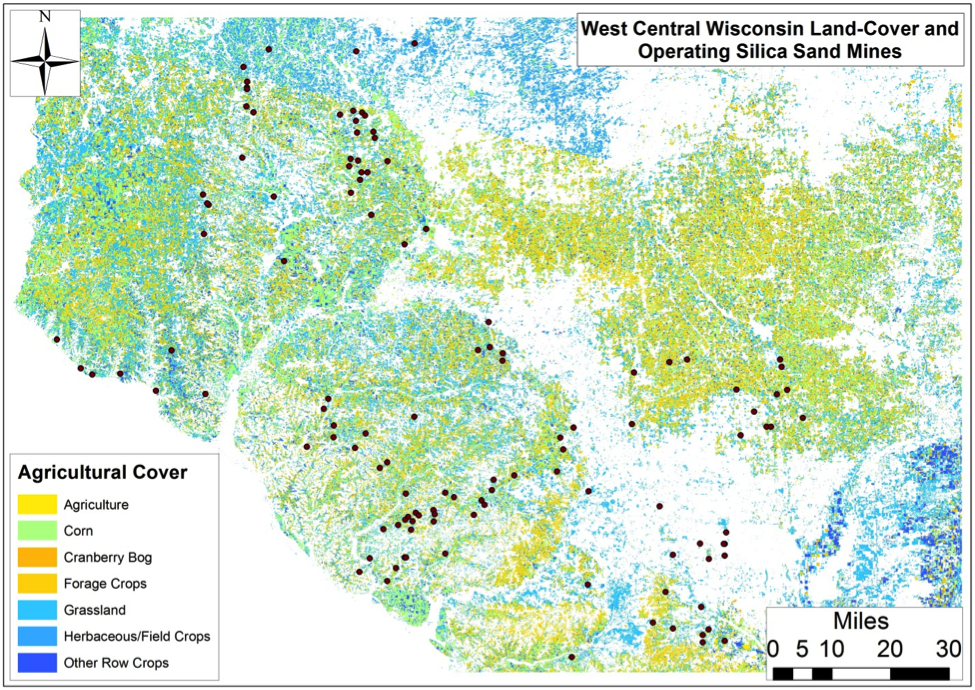

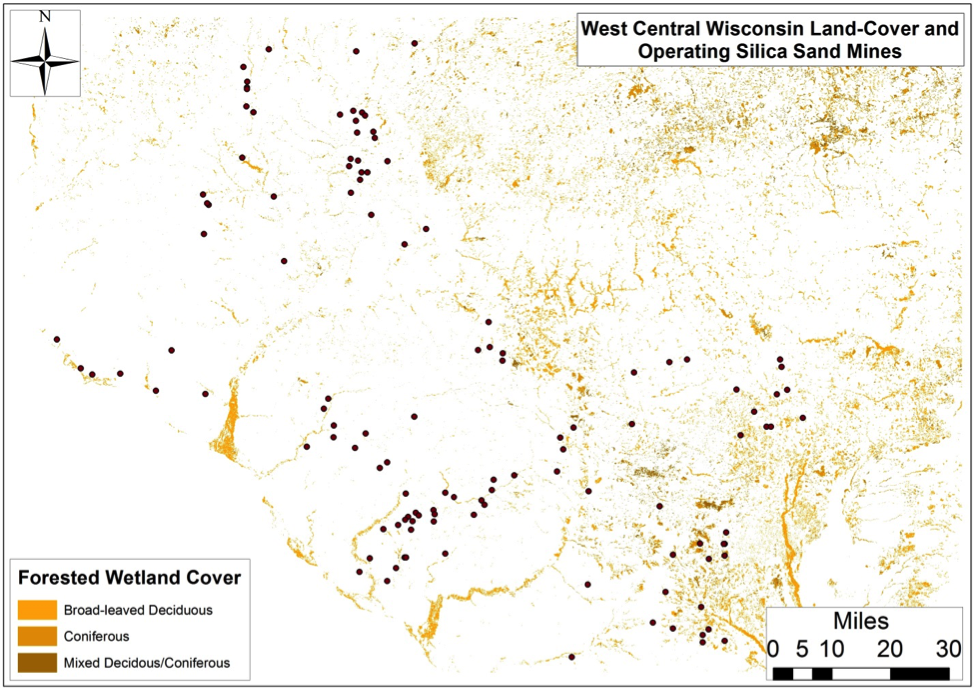
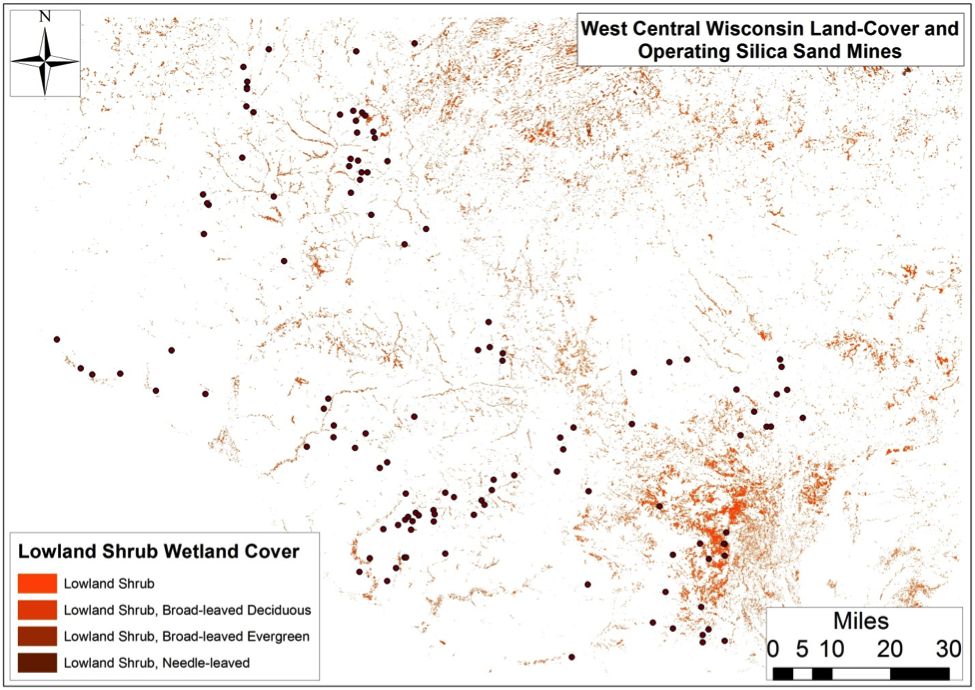
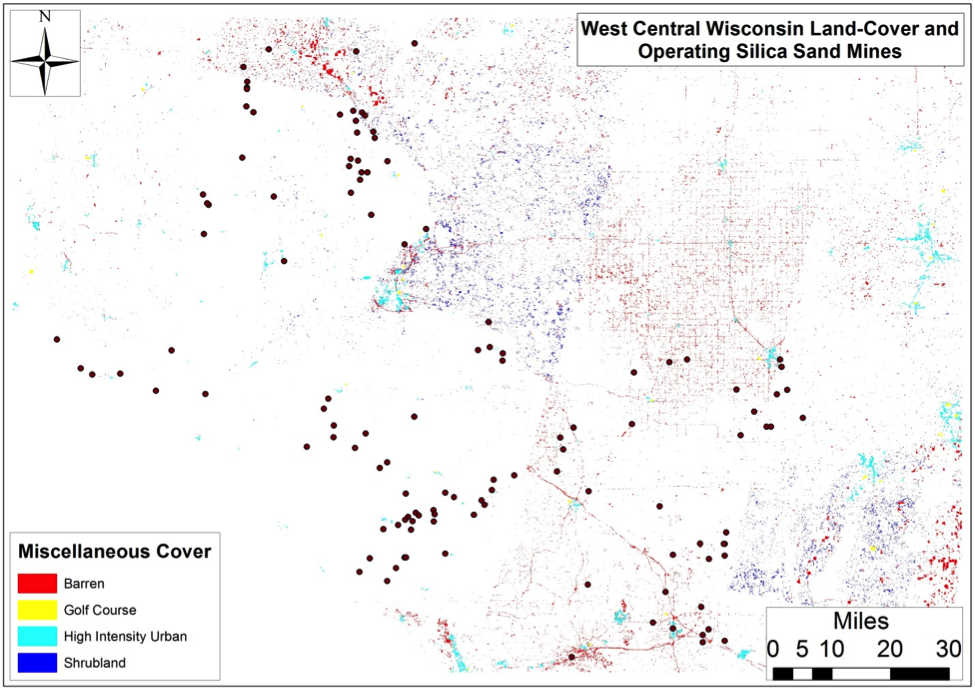
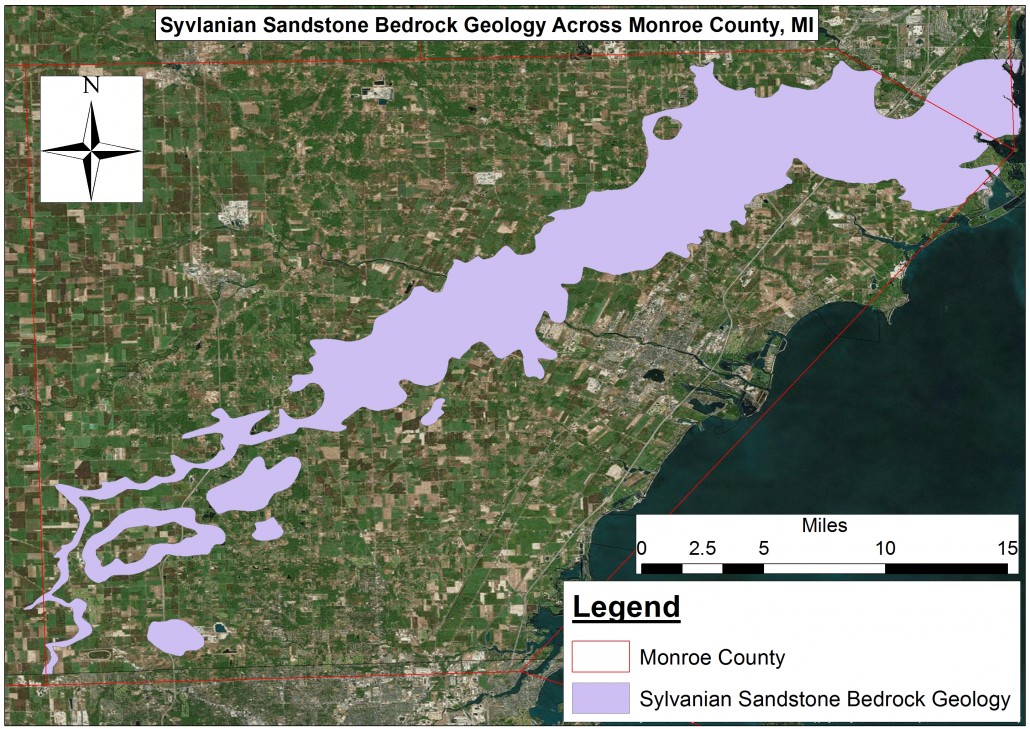
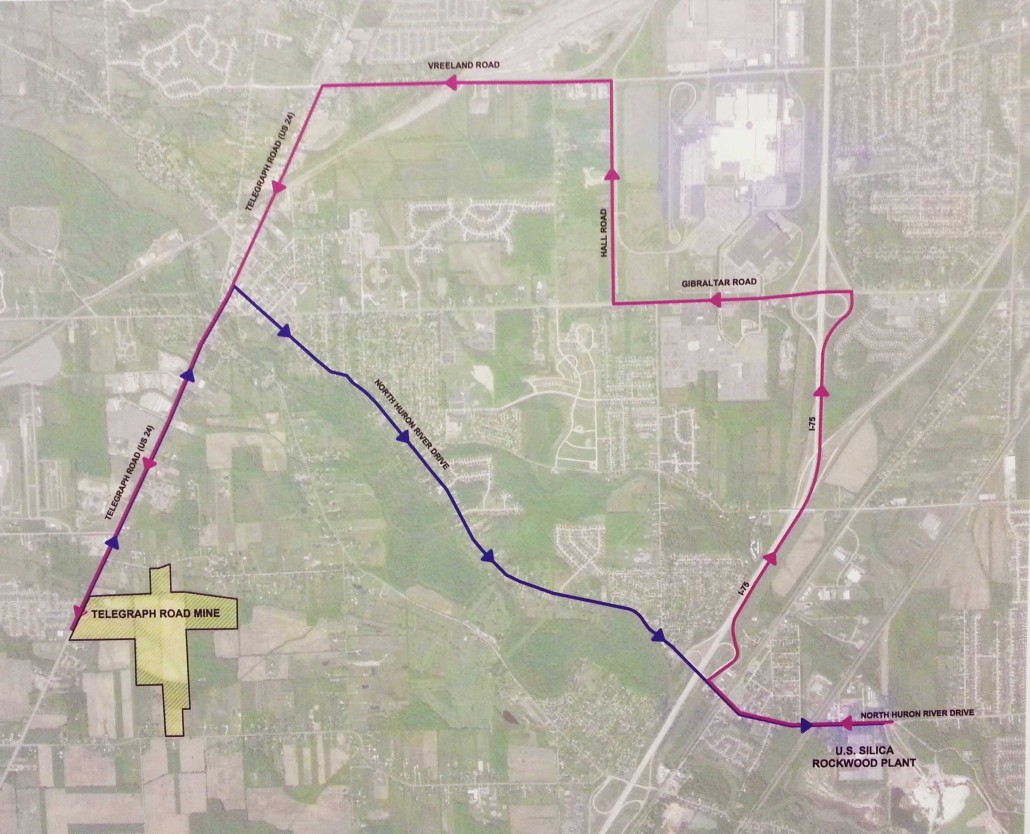
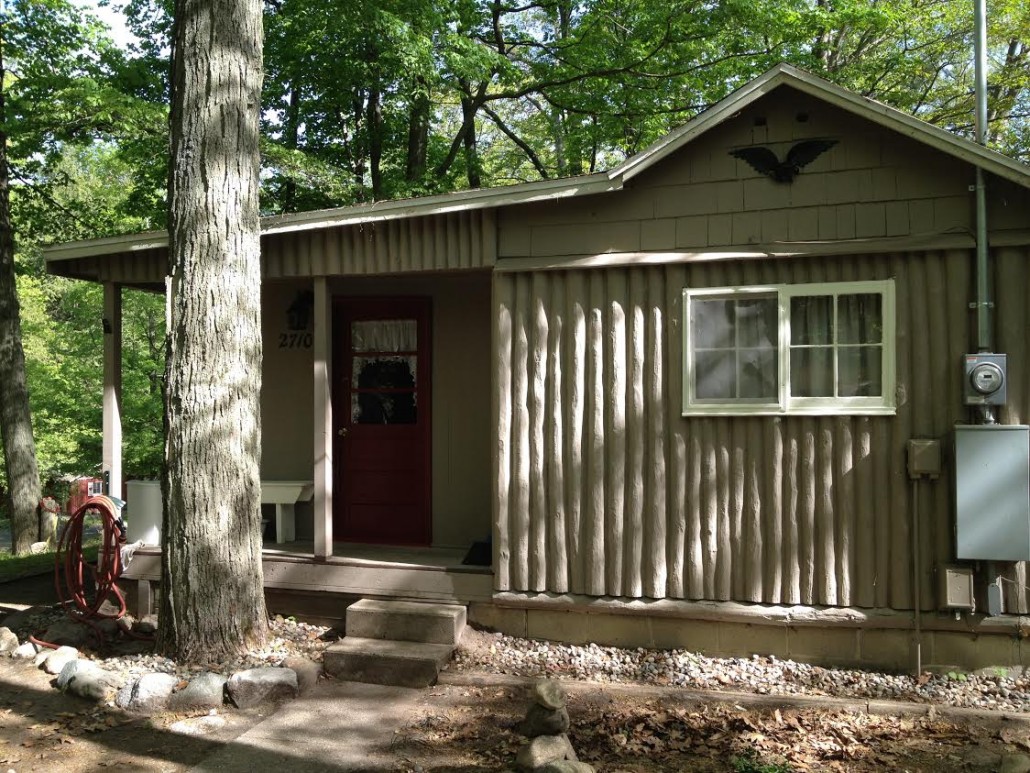
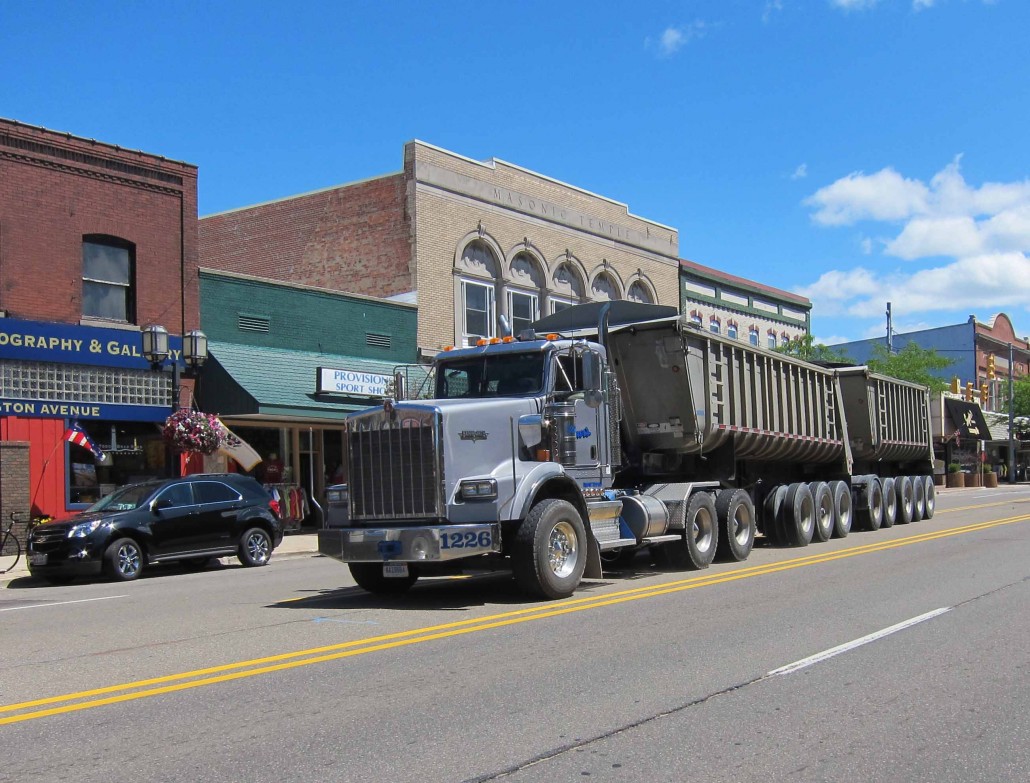
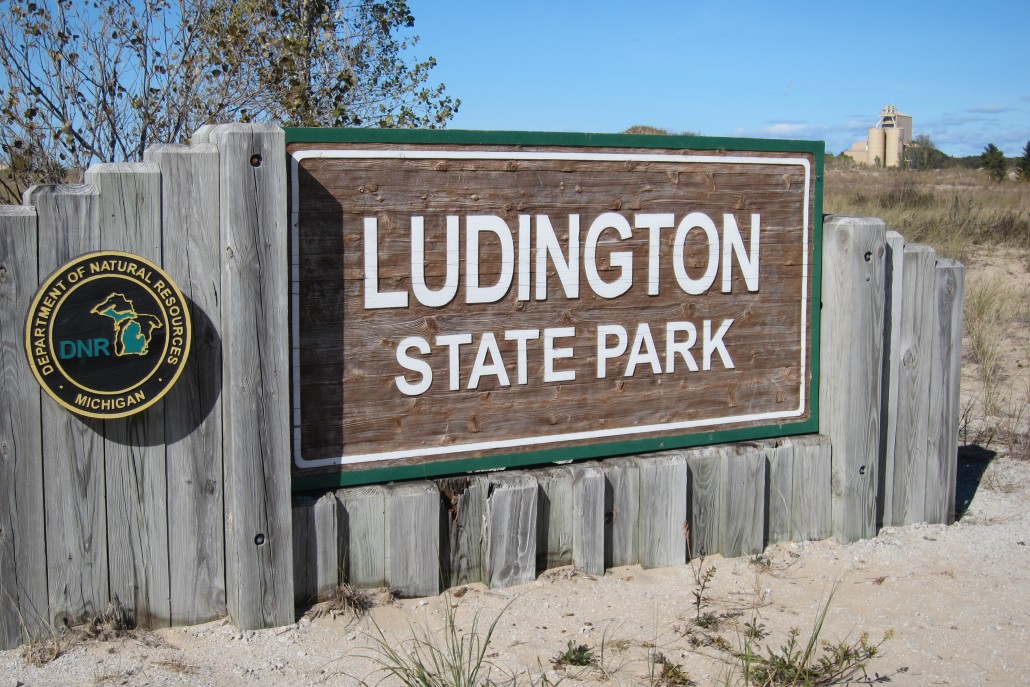
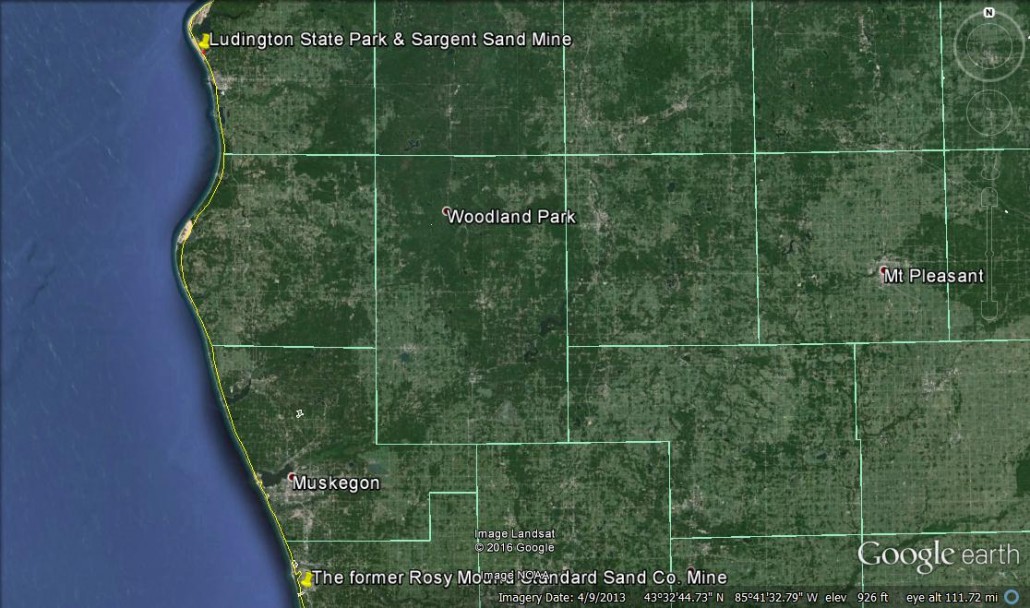
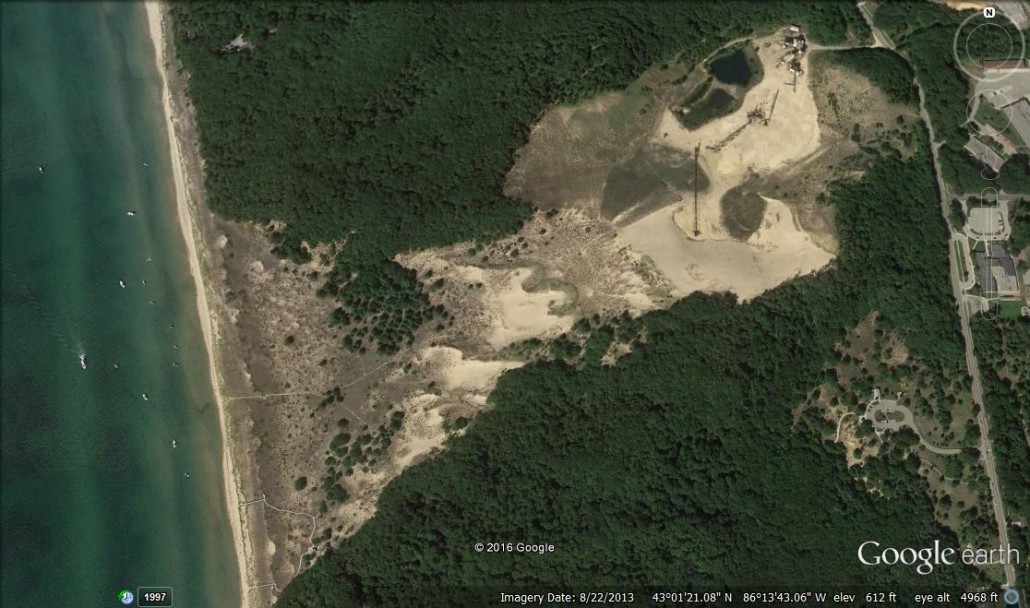
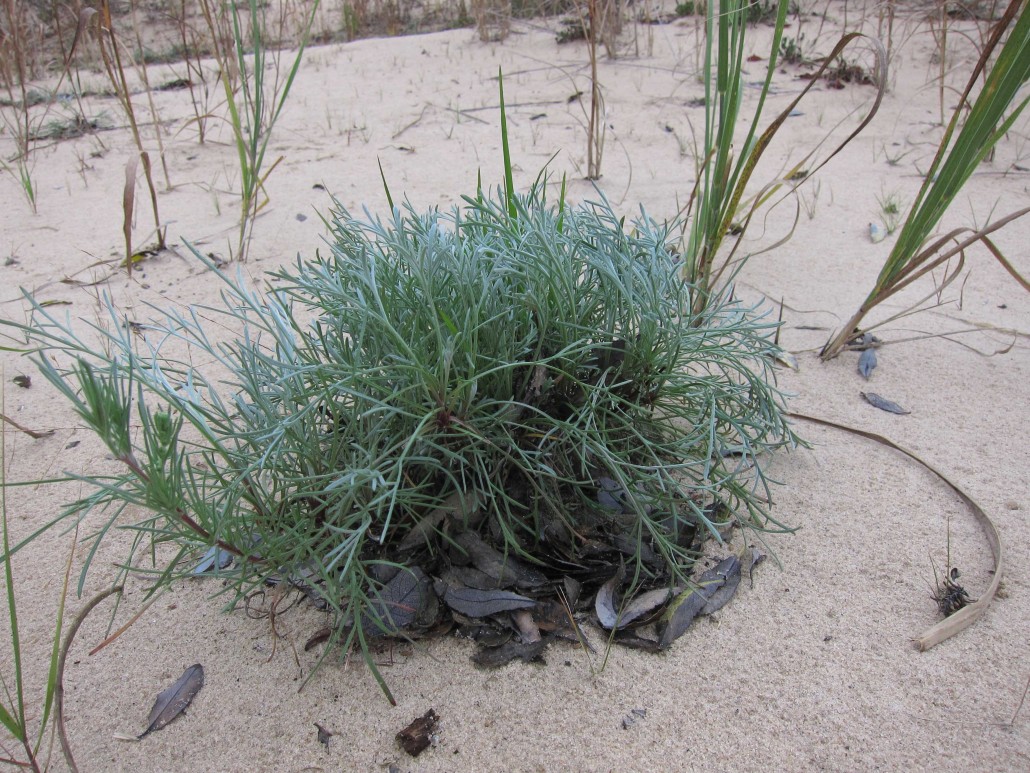
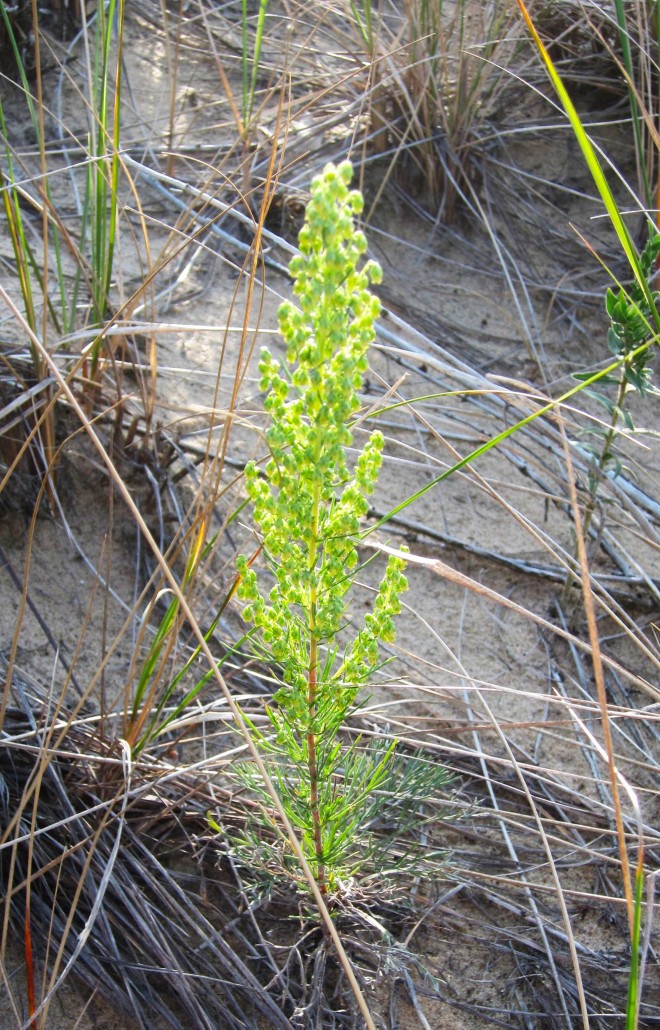
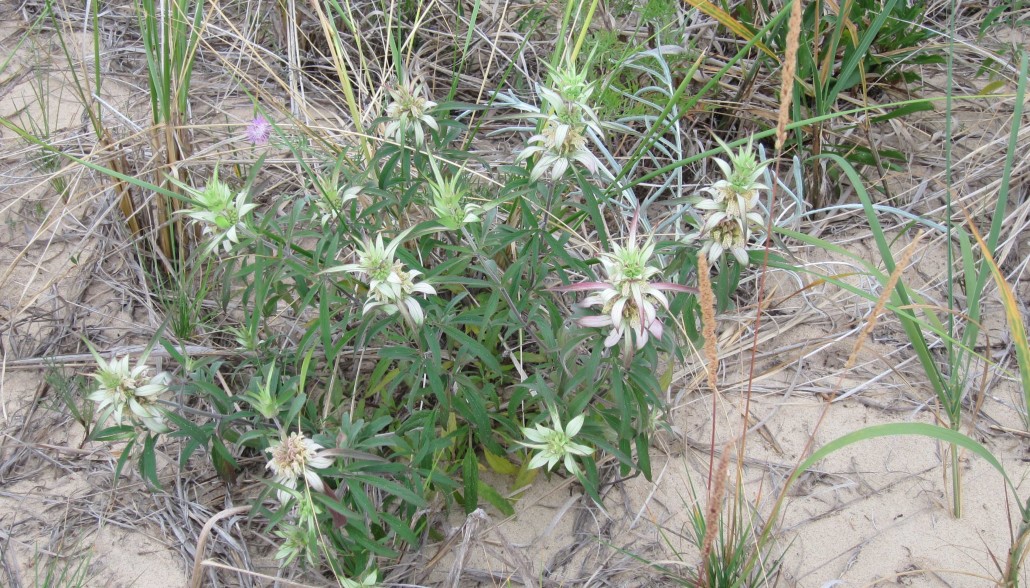
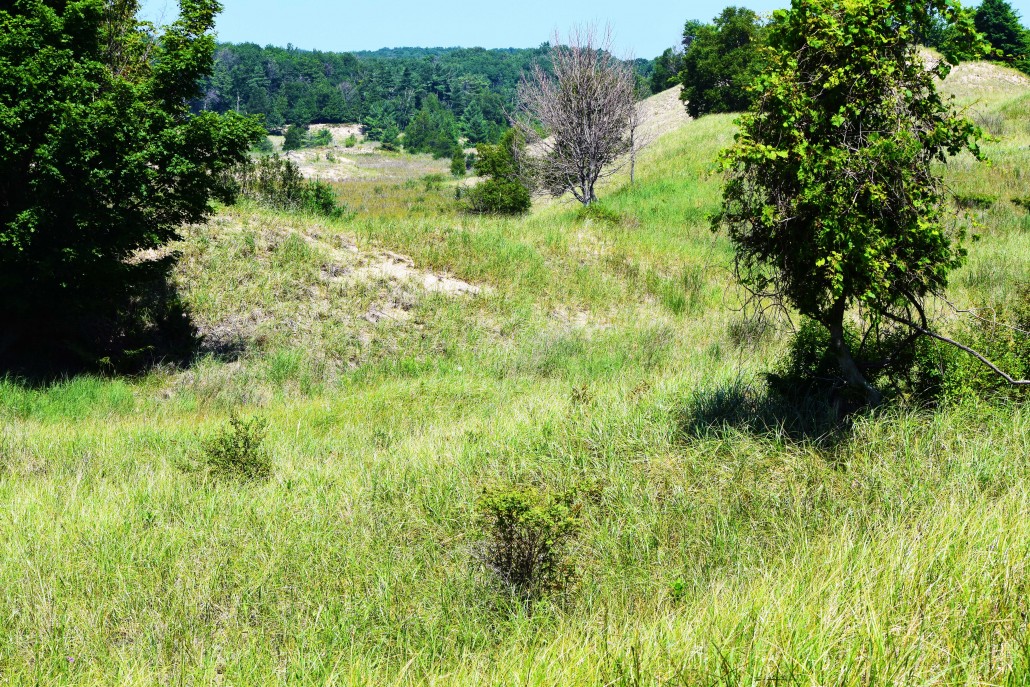
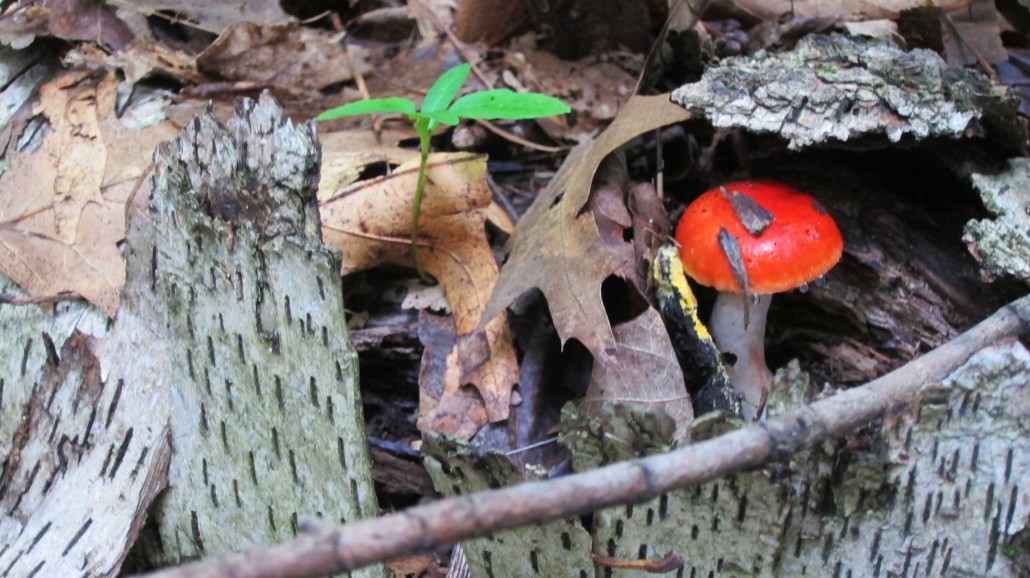
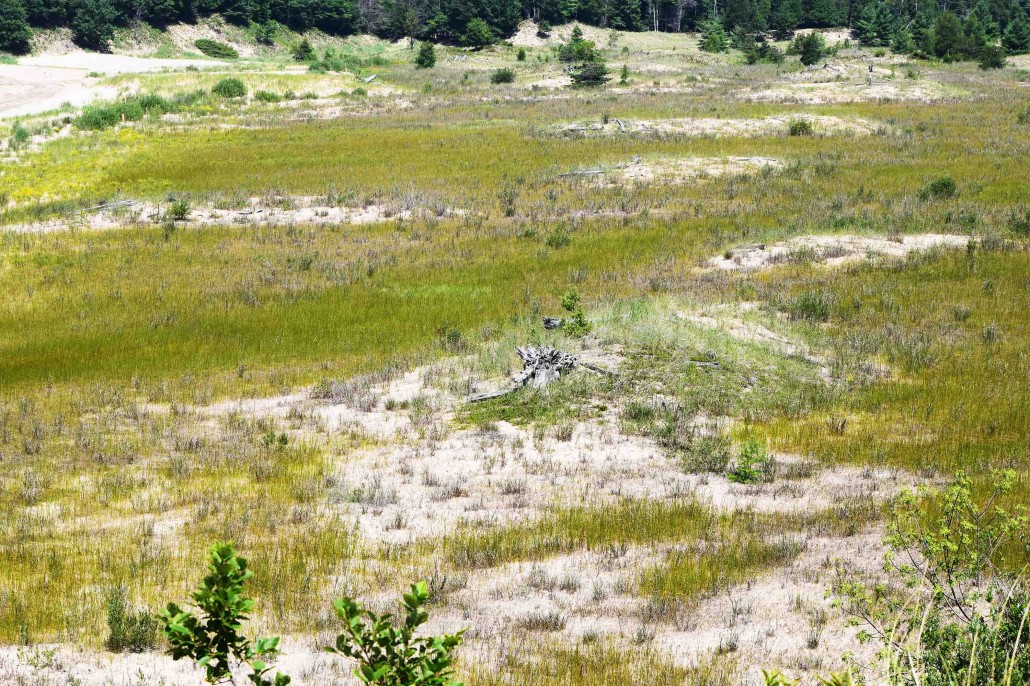
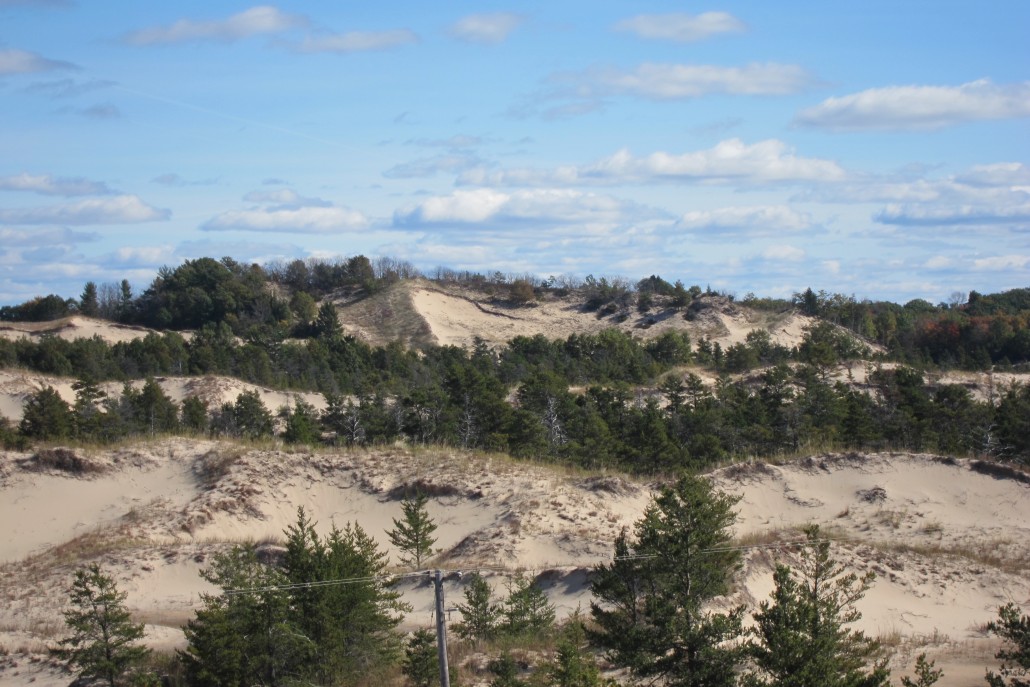
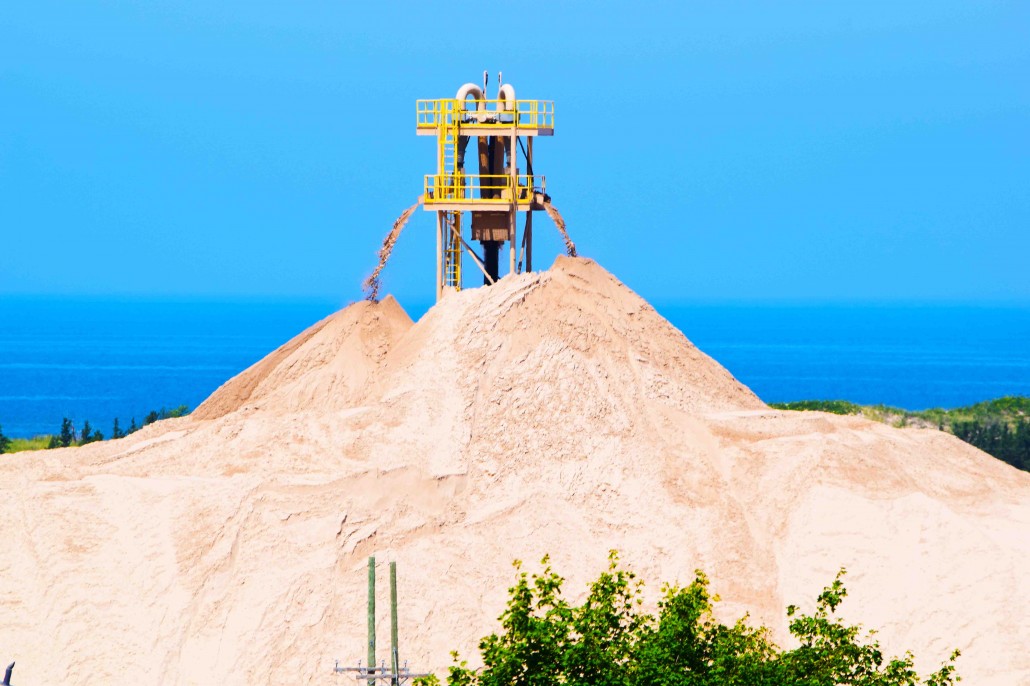
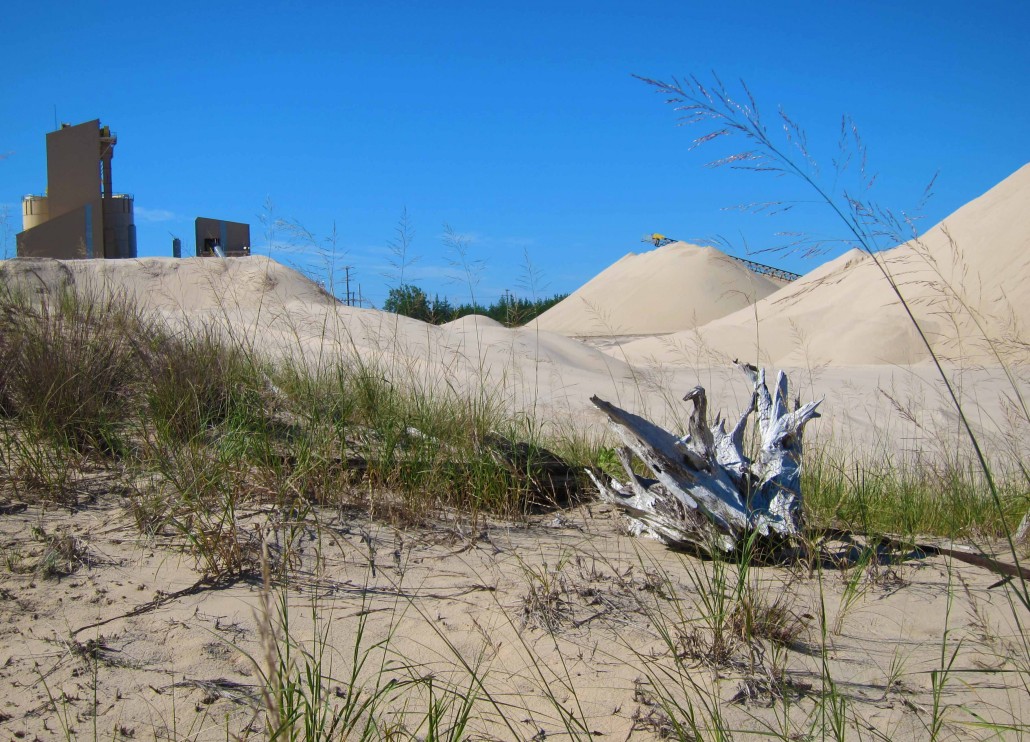
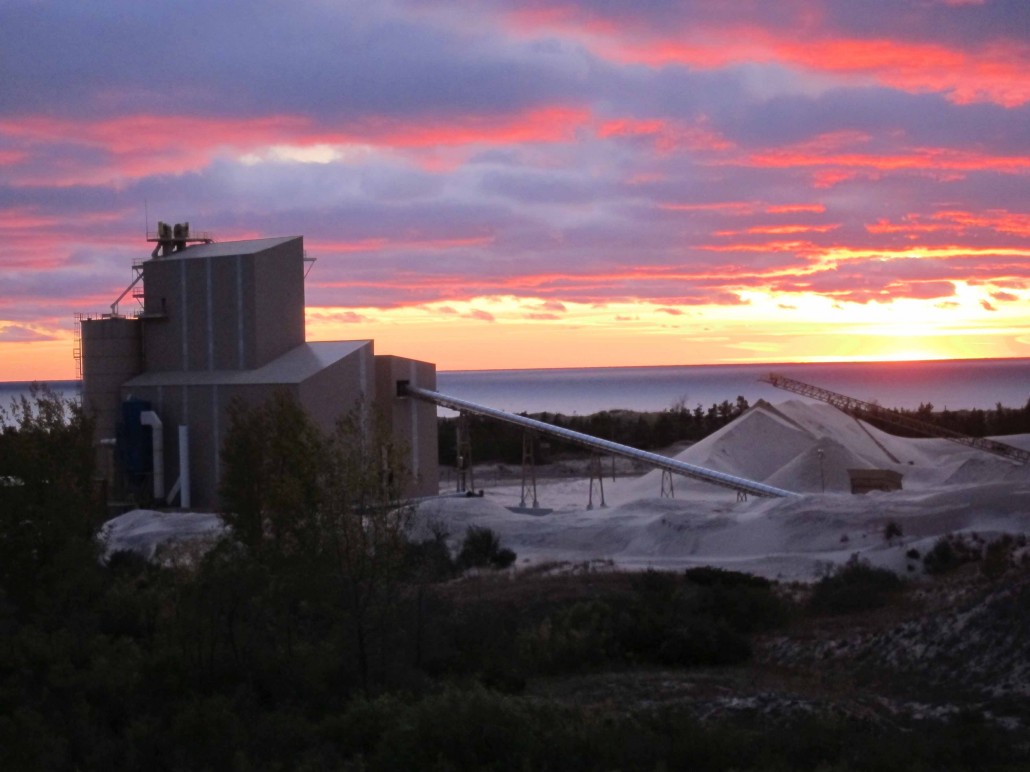
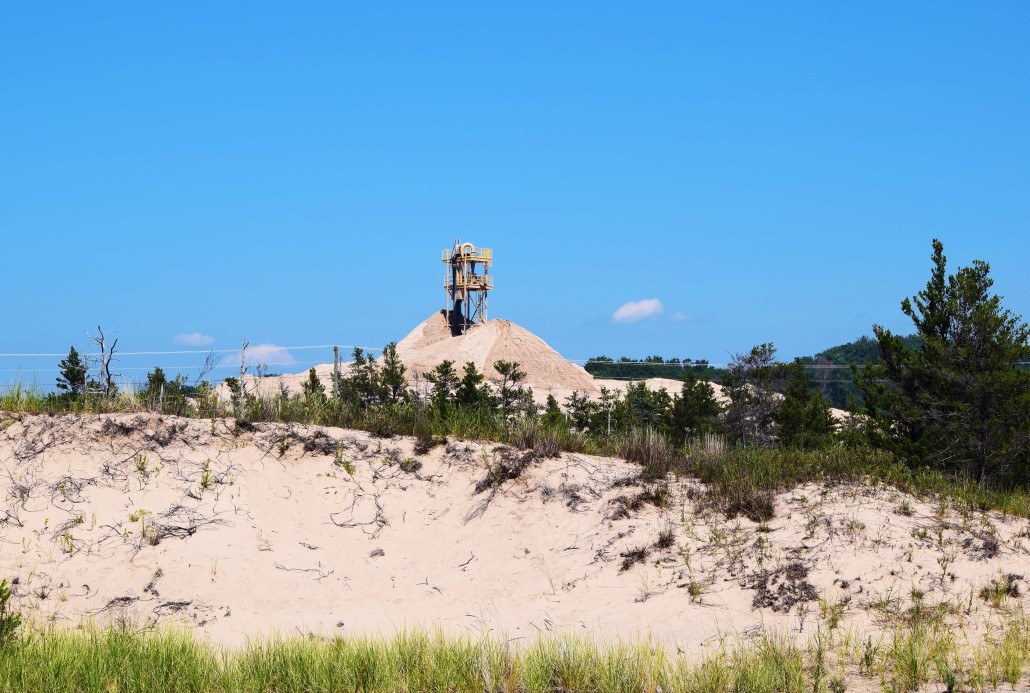
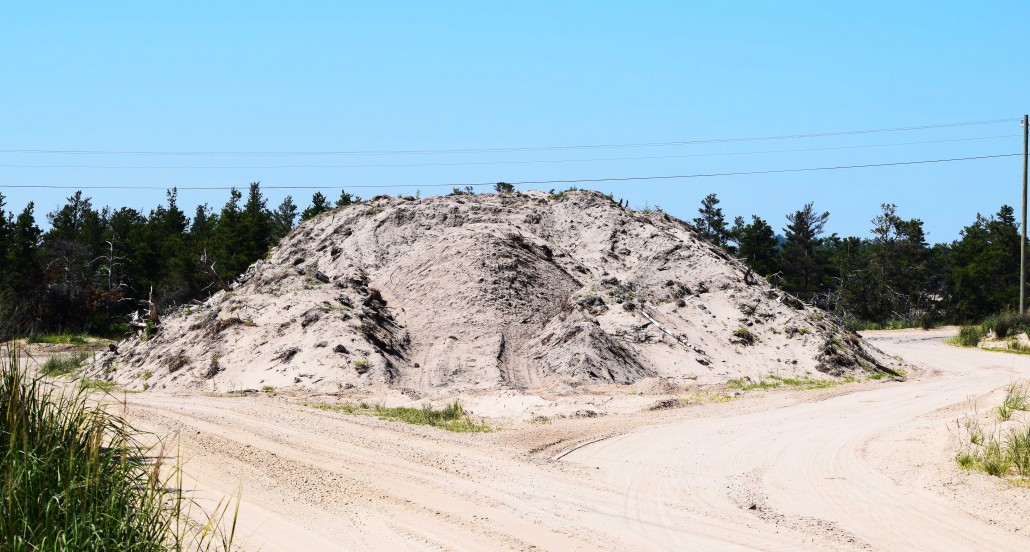
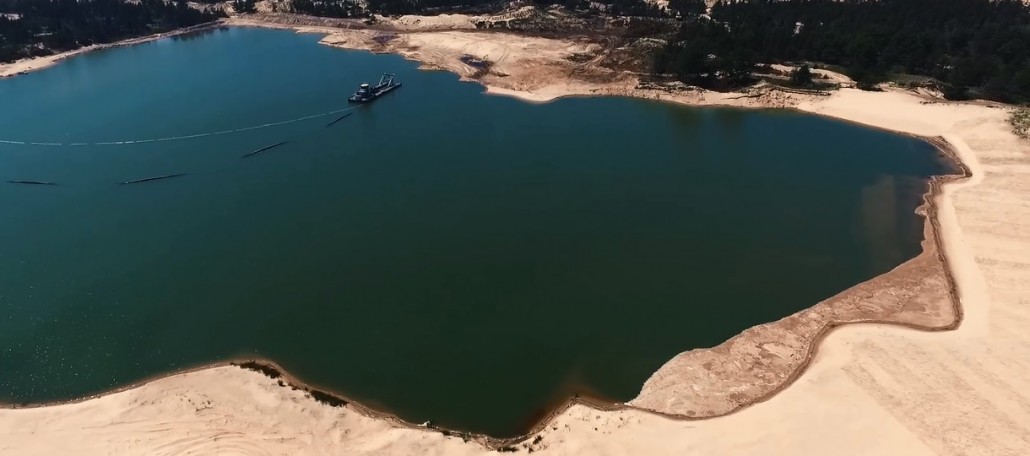
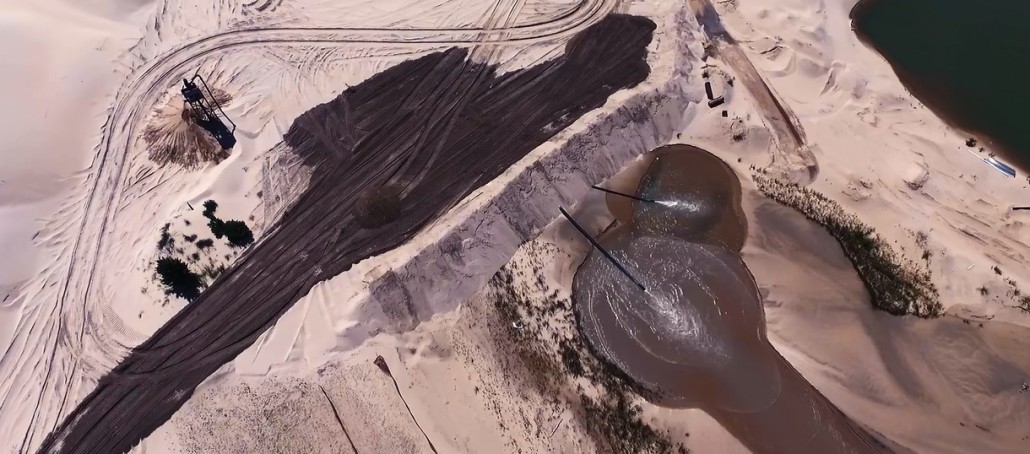