New Letter from Federal Regulators Regarding how the Falcon has Been Investigated
FracTracker received a letter from federal regulators with news on Shell’s Falcon Pipeline investigation, but many concerns still remain.
FracTracker received a letter from federal regulators with news on Shell’s Falcon Pipeline investigation, but many concerns still remain.
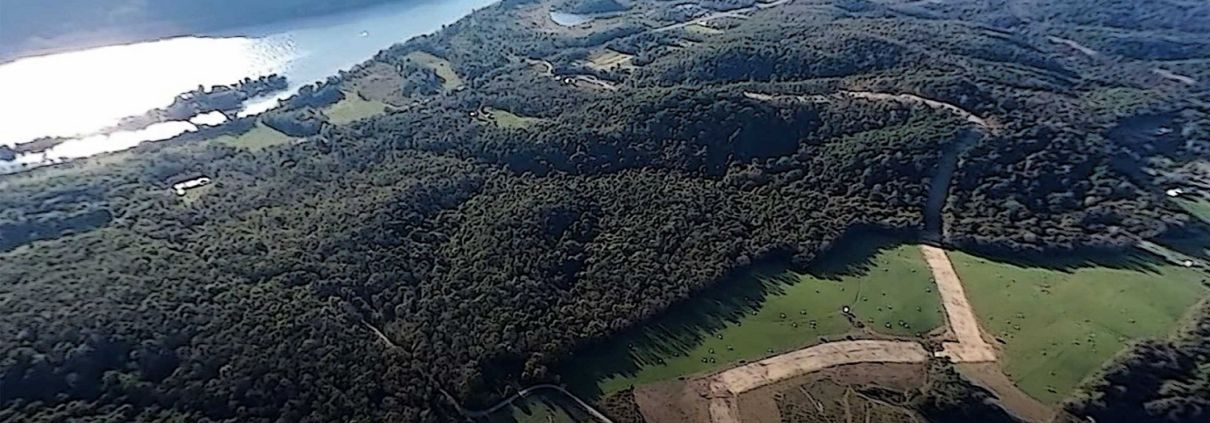
Local stakeholders’ concerns about the environmental and health impacts of oil and gas in the Muskingum Watershed of Ohio have been minimized or excluded by the US Army Corps’ environmental assessment.
Fracking produces more than just oil and gas — billions of gallons of highly toxic waste are also created in the process. Regulatory loopholes have led to limited oversight into how this waste is tracked and treated, putting public health and safety at risk.
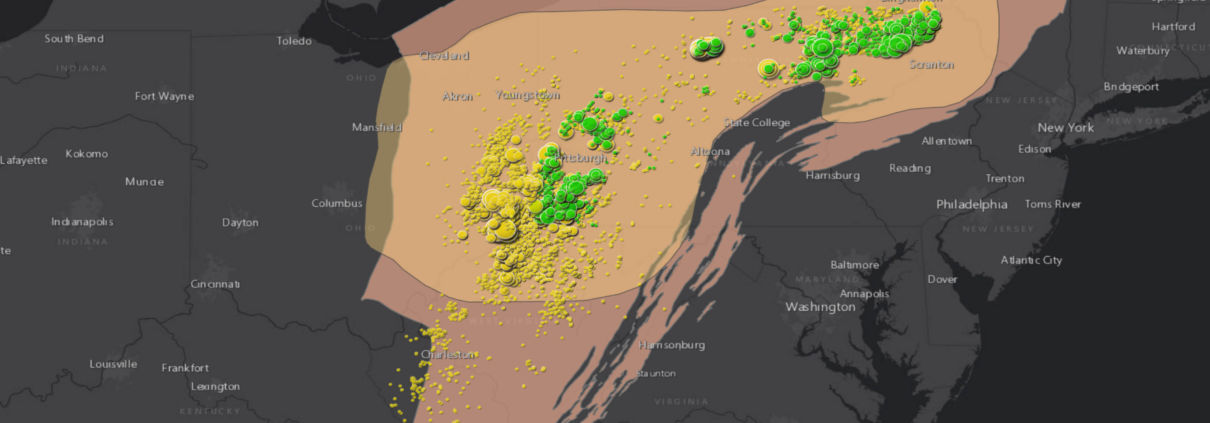
The maps below explore issues related to fracking waste from the Marcellus and Utica Shale regions of Pennsylvania, Ohio, New York, and West Virginia.
This mapping platform is an evolving tool based on available data — yet the opaqueness of the fracking industry limits our ability to map and analyze the full scope of the problem of fracking waste in the Appalachian Basin.
Unfortunately, even after sifting through thousands of data points, we’re left with many outstanding questions — what are the chemical components of the waste created? Where is it all sent? Where are its byproducts sent? What facilities are being planned and proposed? How much illegal dumping occurs?
The production of fracking waste in the Appalachian Basin will continue to create environmental and public health threats for decades after the industry leaves the region. Wells can continue to generate wastewater for years and contaminated equipment sent to landfills will leach toxins into the environment. Furthermore, with the industry’s history of failing to restore land after it has been used for oil and gas operations, we can expect abandoned fracking sites to become an increasing source of pollution in the Appalachian Basin in the coming decades. It’s imperative that the public have access to accurate and detailed data on fracking waste to protect the health of workers and residents.
By Erica Jackson, Community Outreach & Communications Specialist, FracTracker Alliance
FracTracker is closely mapping and following the petrochemical build-out in Appalachia, as the oil and gas industry invests in petrochemical manufacturing. Much of the national attention on the build-out revolves around the Appalachian Storage Hub (ASH), a venture spearheaded by Appalachian Development Group.
The ASH involves a network of infrastructure to store and transport natural gas liquids and finds support across the political spectrum. Elected officials are collaborating with the private sector and foreign investors to further development of the ASH, citing benefits such as national security, increased revenue, job creation, and energy independence.
Left out of the discussion are the increased environmental and public health burdens the ASH would place on the region, and the fact that natural gas liquids are the feedstock of products such as plastic and resins, not energy.
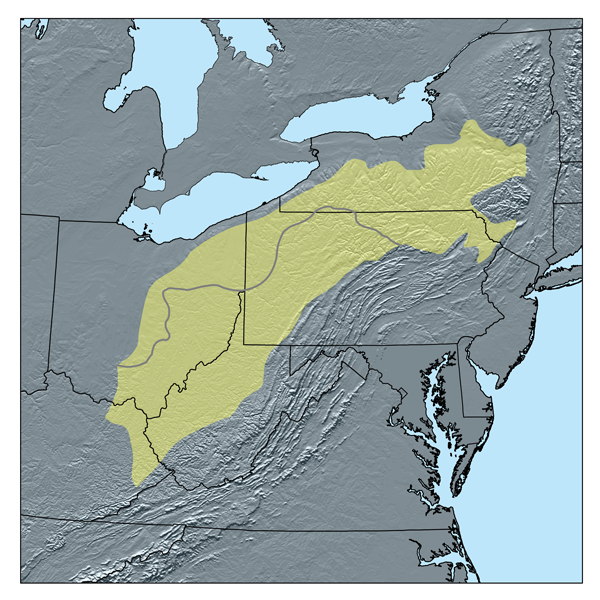
The Allegheny Plateau. Wikipedia
The “Shale Revolution” brought on by high-volume hydraulic fracturing (fracking) in this region encompasses thousands of wells drilled into the Marcellus and Utica-Point Pleasant shale plays across much of the Allegheny Plateau. This area spans from north of Scranton-Wilkes Barre, Pennsylvania, just outside the Catskills Mountains to the East in Susquehanna County, Pennsylvania, and down to the West Virginia counties of Logan, Boone, and Lincoln. The westernmost extent of the fracking experiment in the Marcellus and Utica shale plays is in Noble and Guernsey Counties in Ohio.
Along the way, producing wells have exhibited steeper and steeper declines during the first five years of production, leading the industry to develop what they refer to as “super laterals.” These laterals (the horizontal portion of a well) exceed 3 miles in length and require in excess of 15 million gallons of freshwater and 15,000 tons of silica sand (aka, “proppant”)[1].
The resource-intense super laterals are one way the industry is dealing with growing pressure from investors, lenders, the media, state governments, and the public to reduce supply costs and turn a profit, while also maintaining production. (Note: unfortunately these sources of pressures are listed from most to least concerning to industry itself!)
Another way the fracking industry is hoping to make a profit is by investing in the region’s natural gas liquids (NGLs), such as ethane, propane, and butane, to support the petrochemical industry.
Continued oil and gas development are part of a nascent effort to establish a mega-infrastructure petrochemical complex, the Appalachian Storage Hub (ASH). For those that aren’t familiar with the ASH it could be framed as the fracking industry’s last best attempt to lock in their necessity across Appalachia and nationwide. The ASH was defined in the West Virginia Executive as a way to revitalize the Mountain State and would consist of the following:
“a proposed underground storage facility that would be used to store and transport natural gas liquids (NGLs) extracted from the Marcellus, Utica and Rogersville shales across Kentucky, Ohio, Pennsylvania and West Virginia. Construction of this hub would not only lead to revenue and job creation in the natural gas industry but would also further enable manufacturing companies to come to the Mountain State, as the petrochemicals produced by shale are necessary materials in most manufacturing supply chains…[with] the raw materials available in the region’s Marcellus Shale alone…estimated to be worth more than $2 trillion, and an estimated 20 percent of this shale is composed largely of ethane, propane and butane NGLs that can be utilized by the petrochemical industry in the manufacturing of consumer goods.”
This is yet another example of fracking rhetoric that appeals to American’s sense of patriotism and need for cheaper consumer goods (in this case, plastics), given that they are seeing little to no growth in wages.
While a specific location for underground storage has not been announced, the infrastructure associated with the ASH (such as pipelines, compressor stations, and processing stations) would stretch from outside Pittsburgh down to Catlettsburg, Kentucky, with the latter currently the home of a sizeable Marathon Oil refinery. The ASH “would act like an interstate highway, with on-ramps and off-ramps feeding manufacturing hubs along its length and drawing from the available ethane storage fields. The piping would sit above-ground and follow the Ohio and Kanawha river valley.”
Elected officials across the quad-state region are supporting this effort invoking, not surprisingly, its importance for national security and energy independence.
West Virginia Senator Joe Manchin (D) went so far as to introduce “Senate Bill 1064 – Appalachian Energy for National Security Act.” This bill would require Secretary of Energy Rick Perry and his staff to “to conduct a study on the national security implications of building ethane and other natural-gas-liquids-related petrochemical infrastructure in the United States, and for other purposes.”
Interestingly, the West Virginia Senator told the West Virginia Roundtable Inc’s membership meeting that the study would not examine the “national security implications” but rather the “additional security benefits” of an Appalachian Storage Hub and cited the following to pave the way for the national security study he is proposing: “the shale resource endowment of the Appalachian Basin is so bountiful that, if the Appalachian Basin were an independent country, the Appalachian Basin would be the third largest producer of natural gas in the world.”
Senator Manchin is not the only politician of either party to unabashedly holler from the Appalachian Mountaintops the benefits of the ASH. Former Ohio Governor, and 2016 POTUS primary participant, John Kasich (R) has been a fervent supporter of such a regional planning scheme. He is particularly outspoken in favor of the joint proposal by Thailand-based PTT Global Chemical and Daelim to build an ethane cracker in Dilles Bottom, Ohio, across the Ohio River from Moundsville, West Virginia. The ethane cracker would convert the region’s fracked ethane into ethylene to make polyethylene plastic. This proposed project could be connected to the underground storage component of the ASH.
The Democratic Pennsylvania Governor Tom Wolf has consistently advocated for the project, going so far as to sign “an unprecedented agreement at the Tri-State Shale Summit, promising collaboration between the states in securing crackers for the region and, by extension, support of the storage hub.”
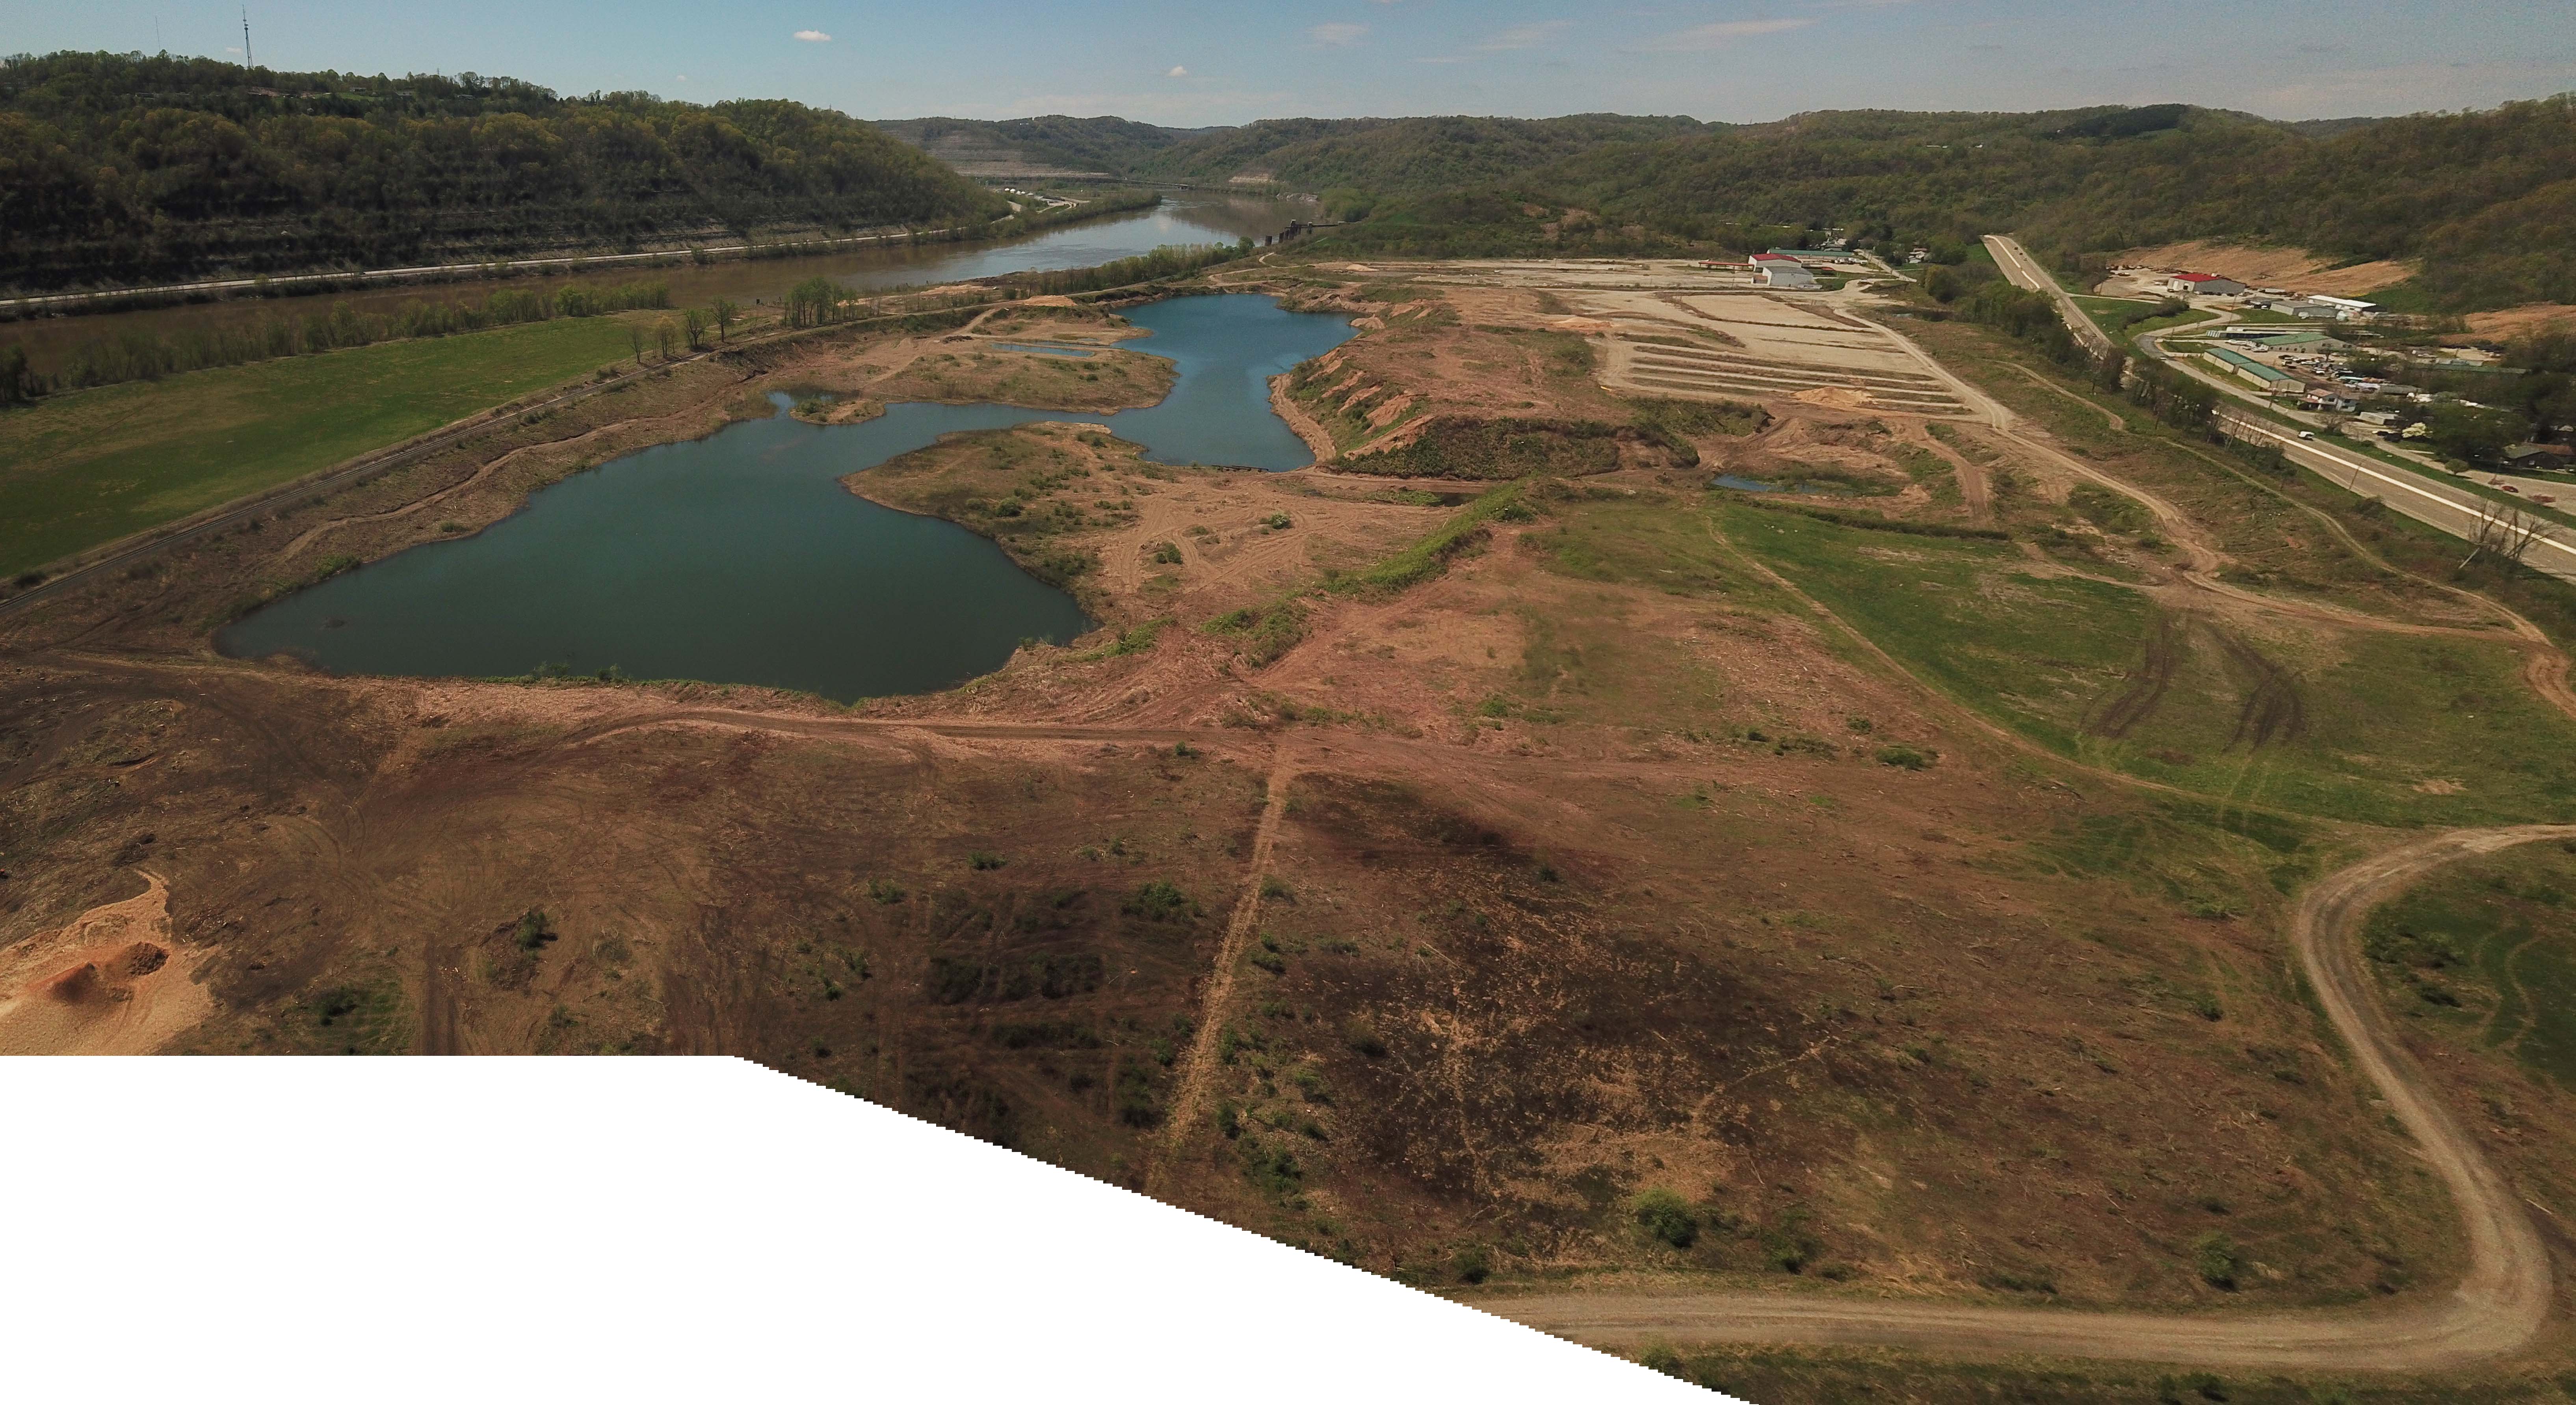
Dilles Bottom, OH ethane cracker site. Photo by Ted Auch, aerial assistance provided by LightHawk.
Not to be outdone in the ASH cheerleading department, West Virginia Governor Jim Justice (R), who can’t seem to find any common ground with Democrats in general nor Senator Manchin specifically, is collaborating with quad-state governors on the benefits of the ASH. All the while, these players ignore or dismiss the environmental, social, and economic costs of such an “all in” bet on petrochemicals and plastics.
Even the region’s land-grant universities have gotten in on the act, with West Virginia University’s Appalachian Oil and Natural Gas Research Consortium and Energy Institute leading the way. WVU’s Energy Institute Director Brian Anderson pointed out that, “Appalachia is poised for a renaissance of the petrochemical industry due to the availability of natural gas liquids. A critical path for this rebirth is through the development of infrastructure to support the industry. The Appalachian Storage Hub study is a first step for realizing that necessary infrastructure.”
The Trump administration, with the assistance of Senator Manchin’s “Senate Bill 1337 – Capitalizing on American Storage Potential Act”, has managed to stretch the definition of the Department of Energy’s Title XVII loan guarantee to earmark $1.9 billion for the Appalachian Development Group, LLC (ADG) to develop the ASH, even though any project that receives such a loan must:
This type of Public-Private Investment Program is central planning at its finest, in spite of the likelihood that the prospects of the ASH meeting the second and fourth conditions above are dubious at best (even if the project utilizes carbon capture and storage technologies).
Public-Private Investment Programs have a dubious past. In her book “Water Wars,” Vandana Shiva discusses the role of these programs globally and the involvement of institutions like the World Bank and International Monetary Fund:
“public-private partnerships”…implies public participation, democracy, and accountability. But it disguises the fact that the public-private partnership arrangements usually entail public funds being available for the privatization of public goods…[and] have mushroomed under the guise of attracting private capital and curbing public-sector employment.”
In response to the Department of Energy’s Title XVII largesse, Congresswoman Pramila Jayapal and Ilhan Omar introduced Amendment 105 in Rule II on HR 2740. According to Food and Water Watch, this amendment would restrict “the types of projects the Department of Energy could financially back. It would block the funding for ALL projects that wouldn’t mitigate climate change.”
On Wednesday, June 19th Congress voted 233-200 along party lines to pass the amendment, preventing funds from the Energy Policy Act of 2005 to be provided to any “project that does not avoid, reduce, or sequester air pollutants or anthropogenic emissions of greenhouse gases”.
The only condition of Department of Energy’s Title XVII loan program ASH is guaranteed to meet is the third (be located in the United States), but as we’ve already mentioned, the level of foreign money involved complicates the domestic facade.
Foreign involvement in the ASH lends credence to Senator Manchin’s and others’ concerns about where profits from the ASH will go, and who will be reaping the benefits of cheap natural gas. The fact that the ASH is being heavily backed by foreign money is the reason Senator Manchin raised an issue with the outsized role of state actors like Saudi Arabia and China as well as likely state-backed private investments like PTT Global Chemical’s. The Senator even cited how a potential $83.7 billion investment in West Virginia from China’s state-owned energy company, China Energy, would compromise “domestic manufacturing and national security opportunities.”
“Critical” infrastructure
With all of the discussion and legislation focused on energy and national security, many don’t realize the output of the ASH would be the production of petroleum-based products: mainly plastic, but also fertilizers, paints, resins, and other chemical products.
Not coincidentally, Republican Ohio State Representatives George Lang and Don Jones just introduced House Bill 242, and attempt to support the plastic industry by “prohibit[ing] the imposition of a tax or fee on [auxiliary or plastic] containers, and to apply existing anti-littering law to those containers.”
There will most certainly be a battle in the courts between the state and urban counties like Cuyahoga County, Ohio, who’s council just voted to ban plastic bags countywide on May 28.
Bills like this and the not unrelated “critical infrastructure” bills being shopped around by the American Legislative Exchange Council will amplify the rural vs urban and local vs state oversight divisions running rampant throughout the United States. The reason for this is that yet another natural resource boom/bust will be foisted on Central Appalachia to fuel urban growth and, in this instance, the growth and prosperity of foreign states like China.
Instead of working night and day to advocate for Appalachia and Americans more broadly, we have legislation in statehouses around the country that would make it harder to demonstrate or voice concerns about proposals associated with the ASH and similar regional planning projects stretching down into the Gulf of Mexico.
Impacts from the ASH and associated ethane cracker proposals will include but are not limited to: an increase in the permitting of natural gas wells, an increase in associated gas gathering pipelines across the Allegheny Plateau, and an exponential increase in the production of plastics, all of which are harmful to the region’s environment and the planet.
The production of the region’s fracked wells will determine the long-term viability of the ASH. From our reading of things, the permitting trend we see in Ohio will have to hit another exponential inflection point to “feed the beast” as it were. Figure 1 shows an overall decline in the number of wells drilled monthly in Ohio.
Figure 2, below it, shows the relationship between the number of wells that are permitted verse those that are actually drilled. 

That supply-demand on steroids interaction will likely result in an increased reliance on “super laterals” by the high-volume hydraulic fracturing industry. These laterals require 5-8 times more water, chemicals, and proppant than unconventional laterals did between 2010 and 2012.
Given this, we felt it critical to map not just the environmental impacts of this model of fracking but also the nuts and bolts of production over time. The map below shows the supply-demand links between the fracking industry and the ASH, not as discrete pieces or groupings of infrastructure, but rather a continuum of up and downstream patterns.
The current iteration of the map shows production values for oil, natural gas, and natural gas liquids, how production for any given well changes over time, and production declines in newer wells relative to those that were fracked at the outset of the region’s “Shale Revolution.” Working with volunteer Gary Allison, we have compiled and mapped monthly (Pennsylvania and West Virginia) and quarterly (Ohio)[2] natural gas, condensate, and natural gas liquids from 2002 to 2018.
This map includes 15,682 producing wells in Pennsylvania, 3,689 in West Virginia, and 2,064 in Ohio. We’ve also included and will be updating petrochemical projects associated with the ASH, either existing or proposed, across the quad-states including the proposed ethane cracker in Dilles Bottom, Ohio and the ethane cracker under construction in Beaver County, Pennsylvania, along with two rumored projects in West Virginia.
We will continue to update this map on a quarterly basis, will be adding Kentucky data in the coming months, and will be sure to update rumored/proposed petrochemical infrastructure as they cross our radar. However, we can’t be everywhere at once so if anyone reading this hears of legitimate rumors or conversations taking place at the county or township level that cite tapping into the ASH’s infrastructural network, please be sure to contact us directly at info@fractracker.org.
By Ted Auch, Great Lakes Program Coordinator, FracTracker Alliance with invaluable data compilation assistance from Gary Allison
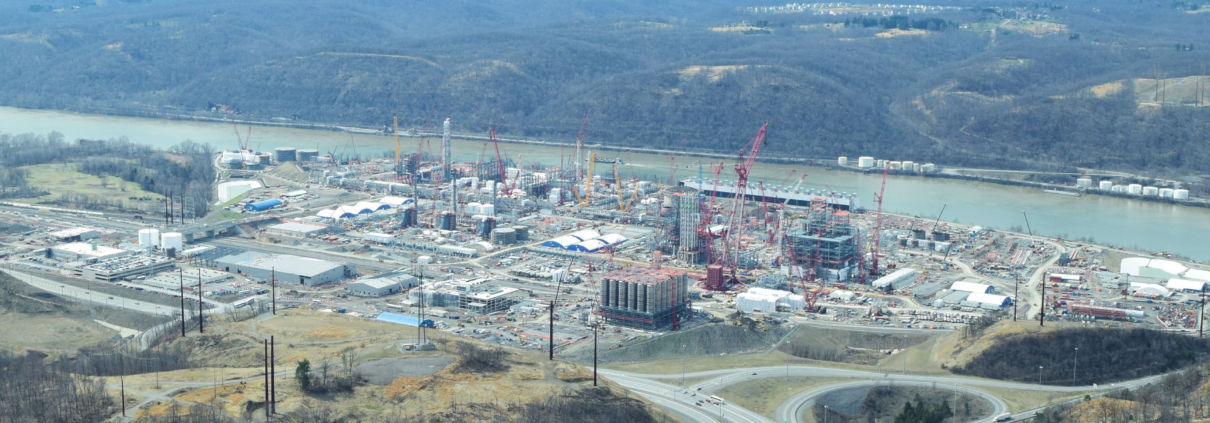
Feature Photo: Ethane cracker plant under construction in Beaver County, PA. Photo by Ted Auch, aerial assistance provided by LightHawk.
[1] For a detailed analysis of the HVHF’s increasing resource demand and how lateral length has increased in the last decade the reader is referred to our analysis titled “A Disturbing Tale of Diminishing Returns in Ohio” Figures 12 and 13.
[2] Note: For those Bluegrass State residents or interested parties, Kentucky data is on its way!
New maps show the build-out of oil and gas infrastructure that converts the upper Ohio River Valley’s fracked gas into petrochemical products
In 2004, Range Resources purchased land in Washington County, Pennsylvania and “fracked” the first well in the Marcellus Shale, opening the flood gates to a wave of natural gas development.
Since then, oil and gas companies have fracked thousands of wells in the upper Ohio River Valley, from the river’s headwaters in Pennsylvania, through Ohio and West Virginia, and into Kentucky.
Industry sold natural gas as a “bridge fuel” to renewable energy, but 15 years since the first fracked Marcellus well, it’s clear that natural gas is more of a barrier than a bridge. In fact, oil and gas companies are not bridging towards clean energy at all, but rather investing in the petrochemical industry- which converts fracked gas into plastic.
This article dives into the expanding oil, gas, and petrochemical industry in the Ohio River Valley, with six maps and over 16,000 data points detailing the build-out of polluting infrastructure required to make plastic and other petrochemical products from fossil fuels.
The petrochemical industry is expanding rapidly, with $164 billion planned for new infrastructure in the United States alone. Much of the build-out involves expanding the nation’s current petrochemical hub in the Gulf Coast, yet industry is also eager to build a second petrochemical hub in the Ohio River Valley.
The shale rock below the Ohio River Valley releases more than methane gas used for energy. Fracked wells also extract natural gas liquids (NGLs) which the petrochemical industry manufactures into products such as plastic and resins. Investing in the petrochemical industry is one way to capitalize on gases that would otherwise be released to the atmosphere via venting and flaring. As companies continue to spend billions more on drilling than they’re bringing in, many are looking towards NGLs as their saving grace.
These maps look at a two-county radius along the upper Ohio River where industry is most heavily concentrated.
The petrochemical lifecycle begins at the well, and there are a lot of wells in the Ohio River Valley. The majority of the natural gas produced here is extracted from the Marcellus and Utica Shale plays, which also contain “wet gas,” or NGLs, such as ethane, propane, and butane.
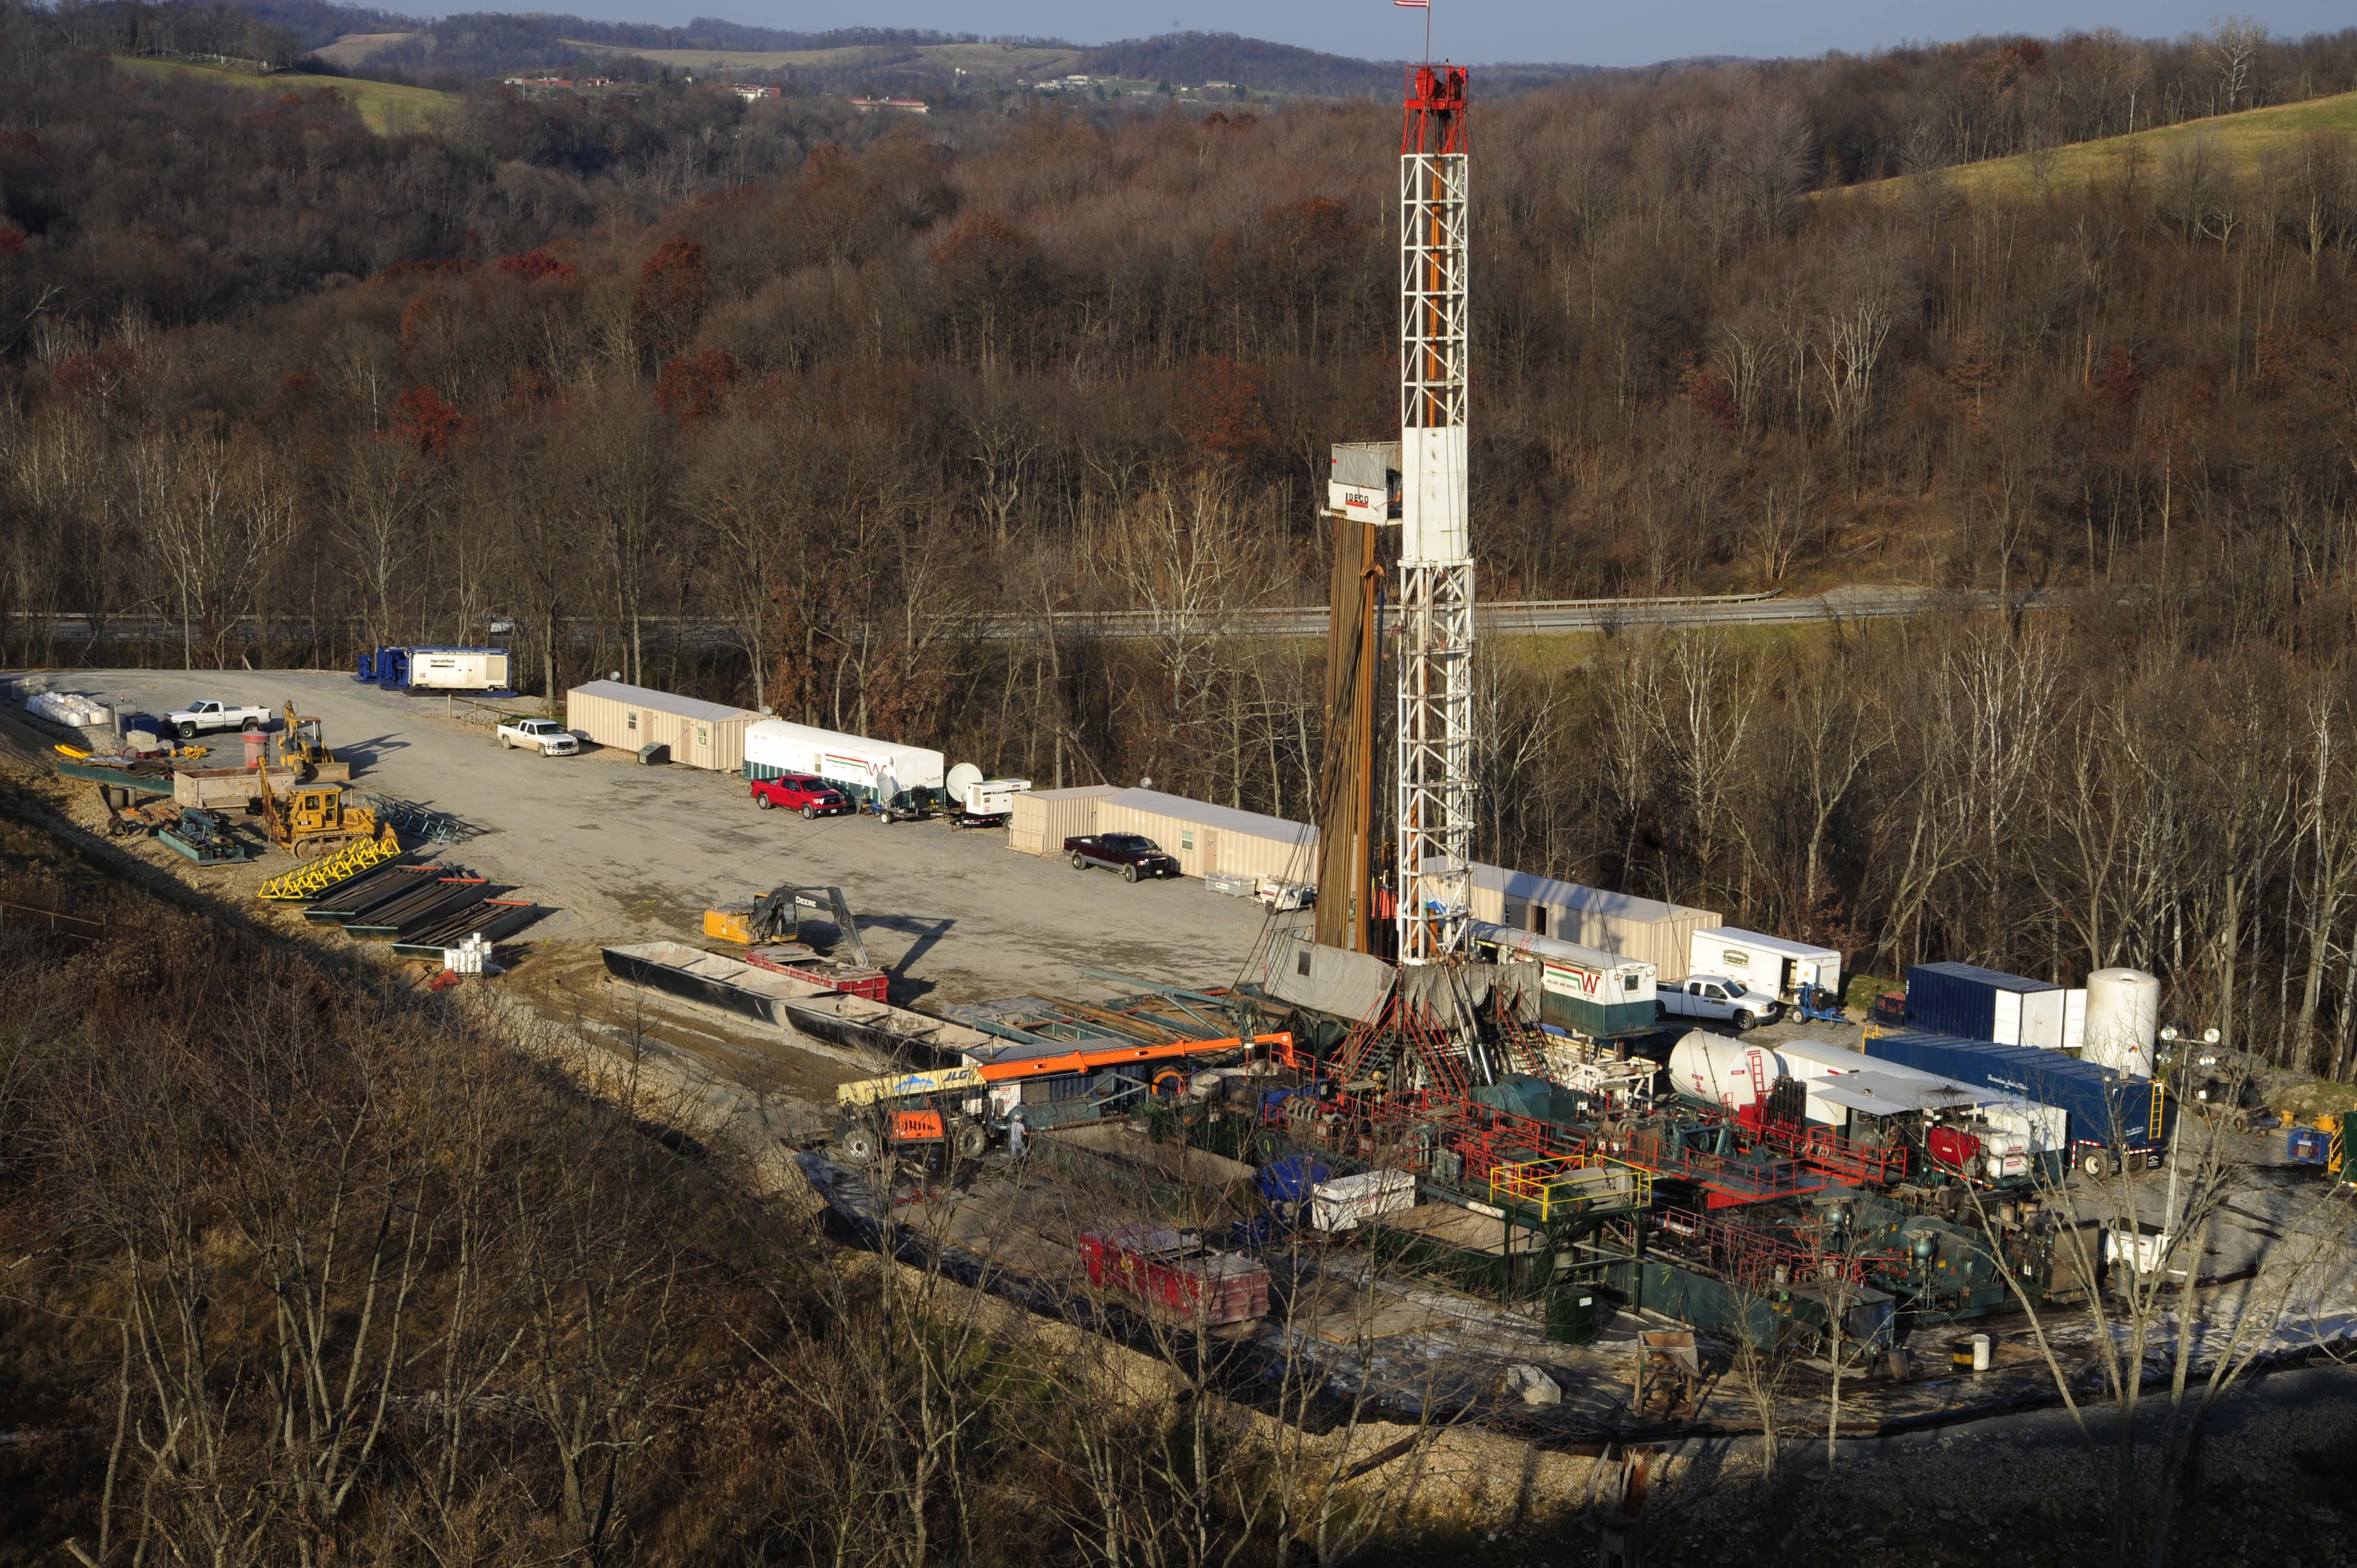
Rig in Greene County, PA. Photo by Ted Auch.
active, unconventional wells in the upper Ohio River Valley
Of particular interest to the petrochemical industry is the ethane in the region, which can be “cracked” into ethylene at high temperatures and converted into polyethylene, the most common type of plastic. The Department of Energy predicts that production of ethylene from ethane in the Appalachian Basin will reach 640,000 barrels a day by 2025 – that’s 20 times the amount produced in 2013.
In our first map, we attempted to show only active and unconventional (fracked) wells, a difficult task as states do not have a uniform definition for “unconventional” or “active.” As such, we used different criteria for each state, detailed below.
This map shows 12,660 wells, including:
The map also shows the Marcellus and Utica Shale plays, and a line demarcating the portions of these plays that contain higher quantities of wet gas. These wet gas regions are of particular interest to the petrochemical industry. Finally, the Devonian-Ohio Shale play is visible as you zoom in.
View Map Full Screen | How FracTracker Maps Work
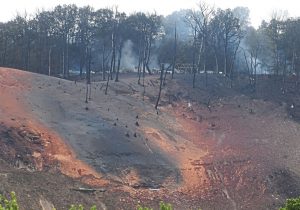
Site of the Revolution Pipeline explosion. Photo: Darrell Sapp, Post Gazette.
A vast network of pipelines transports the oil and gas from these wells to processing stations, refineries, power plants, businesses, and homes. Some are interstate pipelines passing through the region on their way to domestic and international markets.
A number of controversial pipeline projects cross the Ohio River Valley. Construction of the Mariner East II Pipeline is under criminal investigation, the Revolution Pipeline exploded six days after it came on line, protesters are blocking the construction of the Mountain Valley Pipeline, and the Atlantic Coast Pipeline is in the Supreme Court over permits to cross the Appalachian Trail.
Accurate pipeline data is not typically provided to the public, ostensibly for national security reasons. The result of this lack of transparency is that residents along the route are often unaware of the infrastructure, or whether or not they might live in harm’s way. While pipeline data has improved in recent years, much of the pipeline data that exists remains inaccurate. In general, if a route is composed of very straight segments throughout the rolling hills of the Upper Ohio River Valley, it is likely to be highly generalized.
The pipeline map below includes:
View Map Full Screen | How FracTracker Maps Work
Pipelines transport oil and the natural gas stream to an array of facilities. Compressor stations and pumping stations aid the movement of the products through pipelines, while processing stations separate out the natural gas stream into its different components, including NGLs, methane, and various impurities.
At this step, a portion of the extracted fossil fuels are converted into sources of energy: power plants can use the methane from the natural gas stream to produce electricity and heat, and oil refineries transform crude oil into products such as gasoline, diesel fuel, or jet fuel.
A separate portion of the fuels will continue down the petrochemical path to be converted into products such as plastics and resins. Additionally, a significant portion of extracted natural gas leaks unintentionally as “fugitive emissions” (an estimated 2-3%) or is intentionally vented into the atmosphere when production exceeds demand.
This map shows 756 facilities, including:
*A small portion of these facilities are proposed or in construction, but not yet built. Click on the facilities for more information.
View map full screen | How FracTracker Maps Work
After natural gas is extracted from underground, transported via pipeline, and separated into dry gas (methane) and wet gas (NGLs), its components are often pumped back underground for storage. With the expansion of the petrochemical industry, companies are eager to find opportunities for NGL storage.
Underground storage offers a steady supply for petrochemical manufacturers and allows industry to adapt to fluctuations in demand. A study out of West Virginia University identified three different types of NGL storage opportunities along the Ohio and Kanawha River valleys:
Above-ground tanks offer a fourth storage option.
Natural gas and NGL storage contains many risks. These substances are highly flammable, and accidents or leaks can be fatal. A historically industrialized region, the Ohio River Valley is full of coal mines, pipelines, and wells (including abandoned wells with unknown locations). All of this infrastructure creates passages for NGLs to leak and can cause the land above them to collapse. As many of these storage options are beneath the Ohio River, a drinking water supply for over 5 million people, any leak could have catastrophic consequences.
Furthermore, there are natural characteristics that make the geology unsuitable for underground storage, such as karst geological formations, prone to sinkholes and caves.
Appalachia Development Group LLC is heading the development of the Appalachia Storage & Trading Hub initiative, “a regional network of transportation, storage and trading of Natural Gas Liquids and chemical intermediates.” The company has not announced the specific location for the project’s storage component. Funding for this project is the subject of national debate; the company applied for a loan guarantee through a federal clean energy program, in a move that may be blocked by Congress.
Energy Storage Ventures LLC plans to construct the Mountaineer NGL Storage facility near Clarington, Ohio along the Ohio River. This facility involves salt cavern storage for propane, ethane, and butane. To supply the facility, the company plans to build three pipelines beneath the Ohio River: two pipelines (one for ethane and one for propane and butane) would deliver NGLs to the site from Blue Racer Natrium processing plant. A third pipeline would take salt brine water from the caverns to the Marshall County chlorine plant (currently owned by Westlake Chemical Corp).
The storage map below shows potential NGL storage sites to feed petrochemical infrastructure as well as natural gas storage for energy production:
View Map Full Screen | How FracTracker Maps Work
While conventional oil and gas extraction has occurred in the region for decades, and fracking for 15 years, the recent petrochemical build-out adds an additional environmental and health burdens to the Ohio River Valley. Our final map represents the facilities located “downstream” in the petrochemical process which convert fossil fuels into petrochemical products.
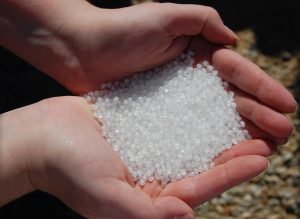
Polyethylene pellets, also called nurdles, manufactured by ethane crackers. Image source.
Much of the petrochemical build-out revolves around ethane crackers, which convert ethane from fracked wells into small, polyethylene plastic pellets. They rely on a regional network of fracking, pipelines, compressor stations, processing stations, and storage to operate.
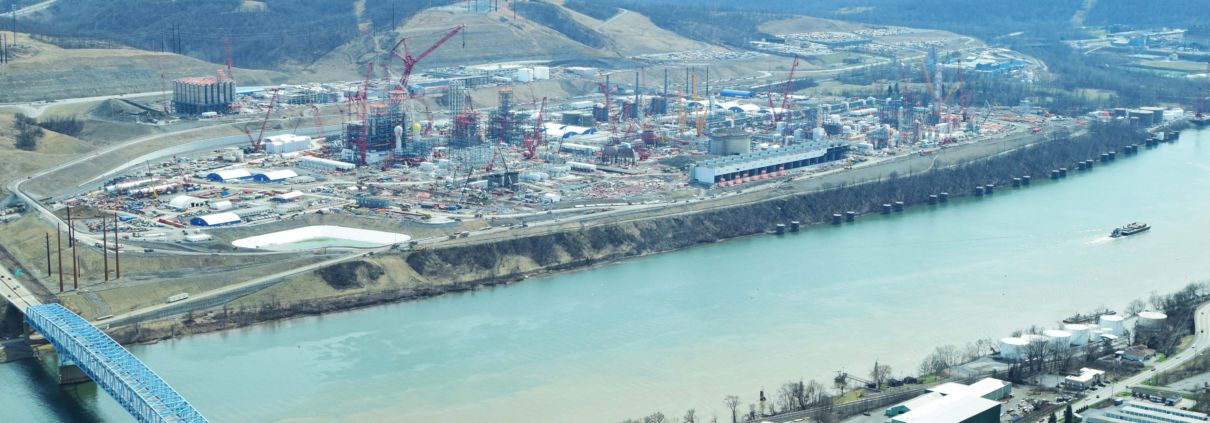
In 2017, Royal Dutch Shell began construction on the first ethane cracker to be built outside of the Gulf Coast in 20 years. Located in Beaver County, Pennsylvania, this plant is expected to produce 1.6 million tons of polyethylene plastic pellets per year. In the process, it will release an annual 2.2 million tons of carbon dioxide (CO2).
A second ethane cracker has been permitted in Belmont County, Ohio. Several organizations, including the Sierra Club, Center for Biological Diversity, FreshWater Accountability Project, and Earthworks have filed an appeal against Ohio EPA’s issuance of the air permit for the PTTGC Ethane Cracker.
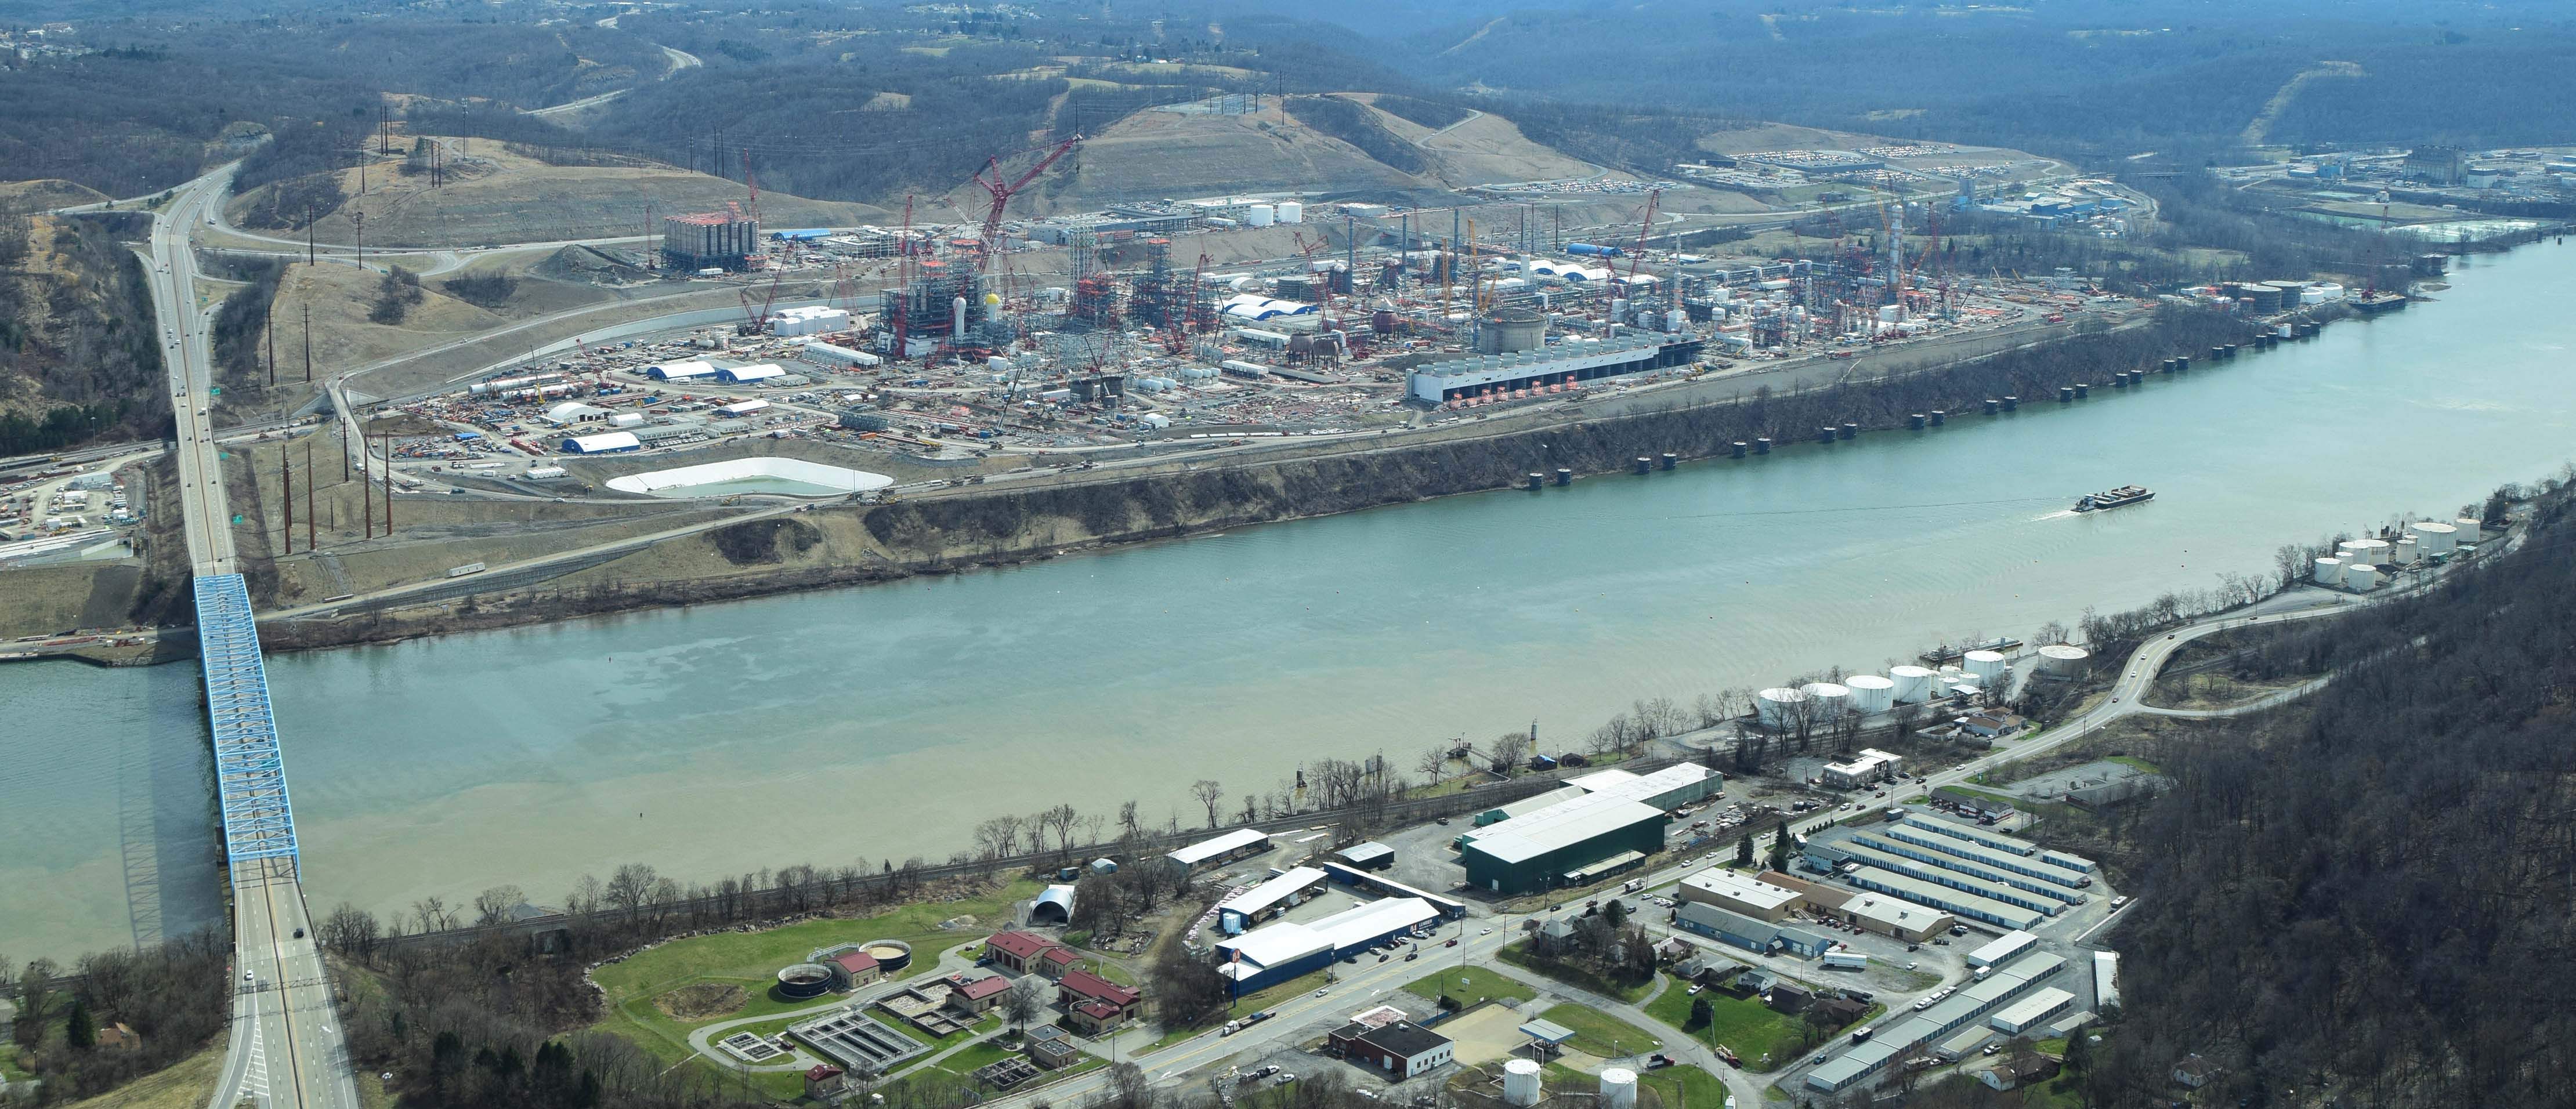
The Shell Ethane Cracker, under construction in Beaver County, is expected to produce 1.6 million tons of plastic per year. Photo by Ted Auch, aerial assistance provided by LightHawk.
Methanol plants also convert part of the natural gas stream (methane) into feedstock for a petrochemical product (methanol). Methanol is commonly used to make formaldehyde, a component of adhesives, coatings, building materials, and many other products. In addition to methanol plants and ethane crackers, the map below also shows the facilities that make products from feedstocks, such as fertilizer (made from combining natural gas with nitrogen to form ammonia, the basis of nitrogen fertilizer), paints, and of course, plastic.
These facilities were determined by searching the EPA’s database of industrial sites using the North American Industry Classification System (NAICS).
In total, we mapped 61 such facilities:
View Map Full Screen | How FracTracker Maps Work
How are these facilities all connected? Our final map combines the data above to show the connections between the fossil fuel infrastructure. To avoid data overload, not all of the map’s features appear automatically on the map. To add features, view the map full screen and click the “Layers” tab in the top right tool bar.
View Map Full Screen | How FracTracker Maps Work
The expansion of oil and gas infrastructure, in addition to the downstream facilities listed above, has rapidly increased in the last few years. According to the Environmental Integrity Project, regulatory agencies in these four states have authorized an additional 15,516,958 tons of carbon dioxide equivalents to be emitted from oil and gas infrastructure since 2012. That’s in addition to emissions from older oil and gas infrastructure, wells, and the region’s many coal, steel, and other industrial sites.
View the Environmental Integrity Project’s national map of emission increases here, which also includes permit documents for these new and expanding facilities.
The petrochemical build-out will lock in greenhouse gas emissions and plastic production for decades to come, ignoring increasingly dire warnings about plastic pollution and climate change. A recent report co-authored by FracTracker Alliance found that the greenhouse gas emissions across the plastic lifecycle were equivalent to emissions from 189 coal power plants in 2019 – a number that’s predicted to rise in coming years.
![]() What does the petrochemical build out look like in the Ohio River Valley?
What does the petrochemical build out look like in the Ohio River Valley?
But it doesn’t have to be this way. The oil and gas industry’s plan to increase plastic manufacturing capacity is a desperate attempt to stay relevant as fracking companies “hemorrhage cash” and renewable energy operating costs beat out those of fossil fuels. Investing instead in clean energy, a less mechanized and more labor intensive industry, will offer more jobs and economic opportunities that will remain relevant as the world transitions away from fossil fuels.
In fact, the United States already has more jobs in clean energy, energy efficiency, and alternative vehicles than jobs in fossil fuels. It’s time to bring these opportunities to the Ohio River Valley and bust the myth that Appalachian communities must sacrifice their health and natural resources for economic growth.
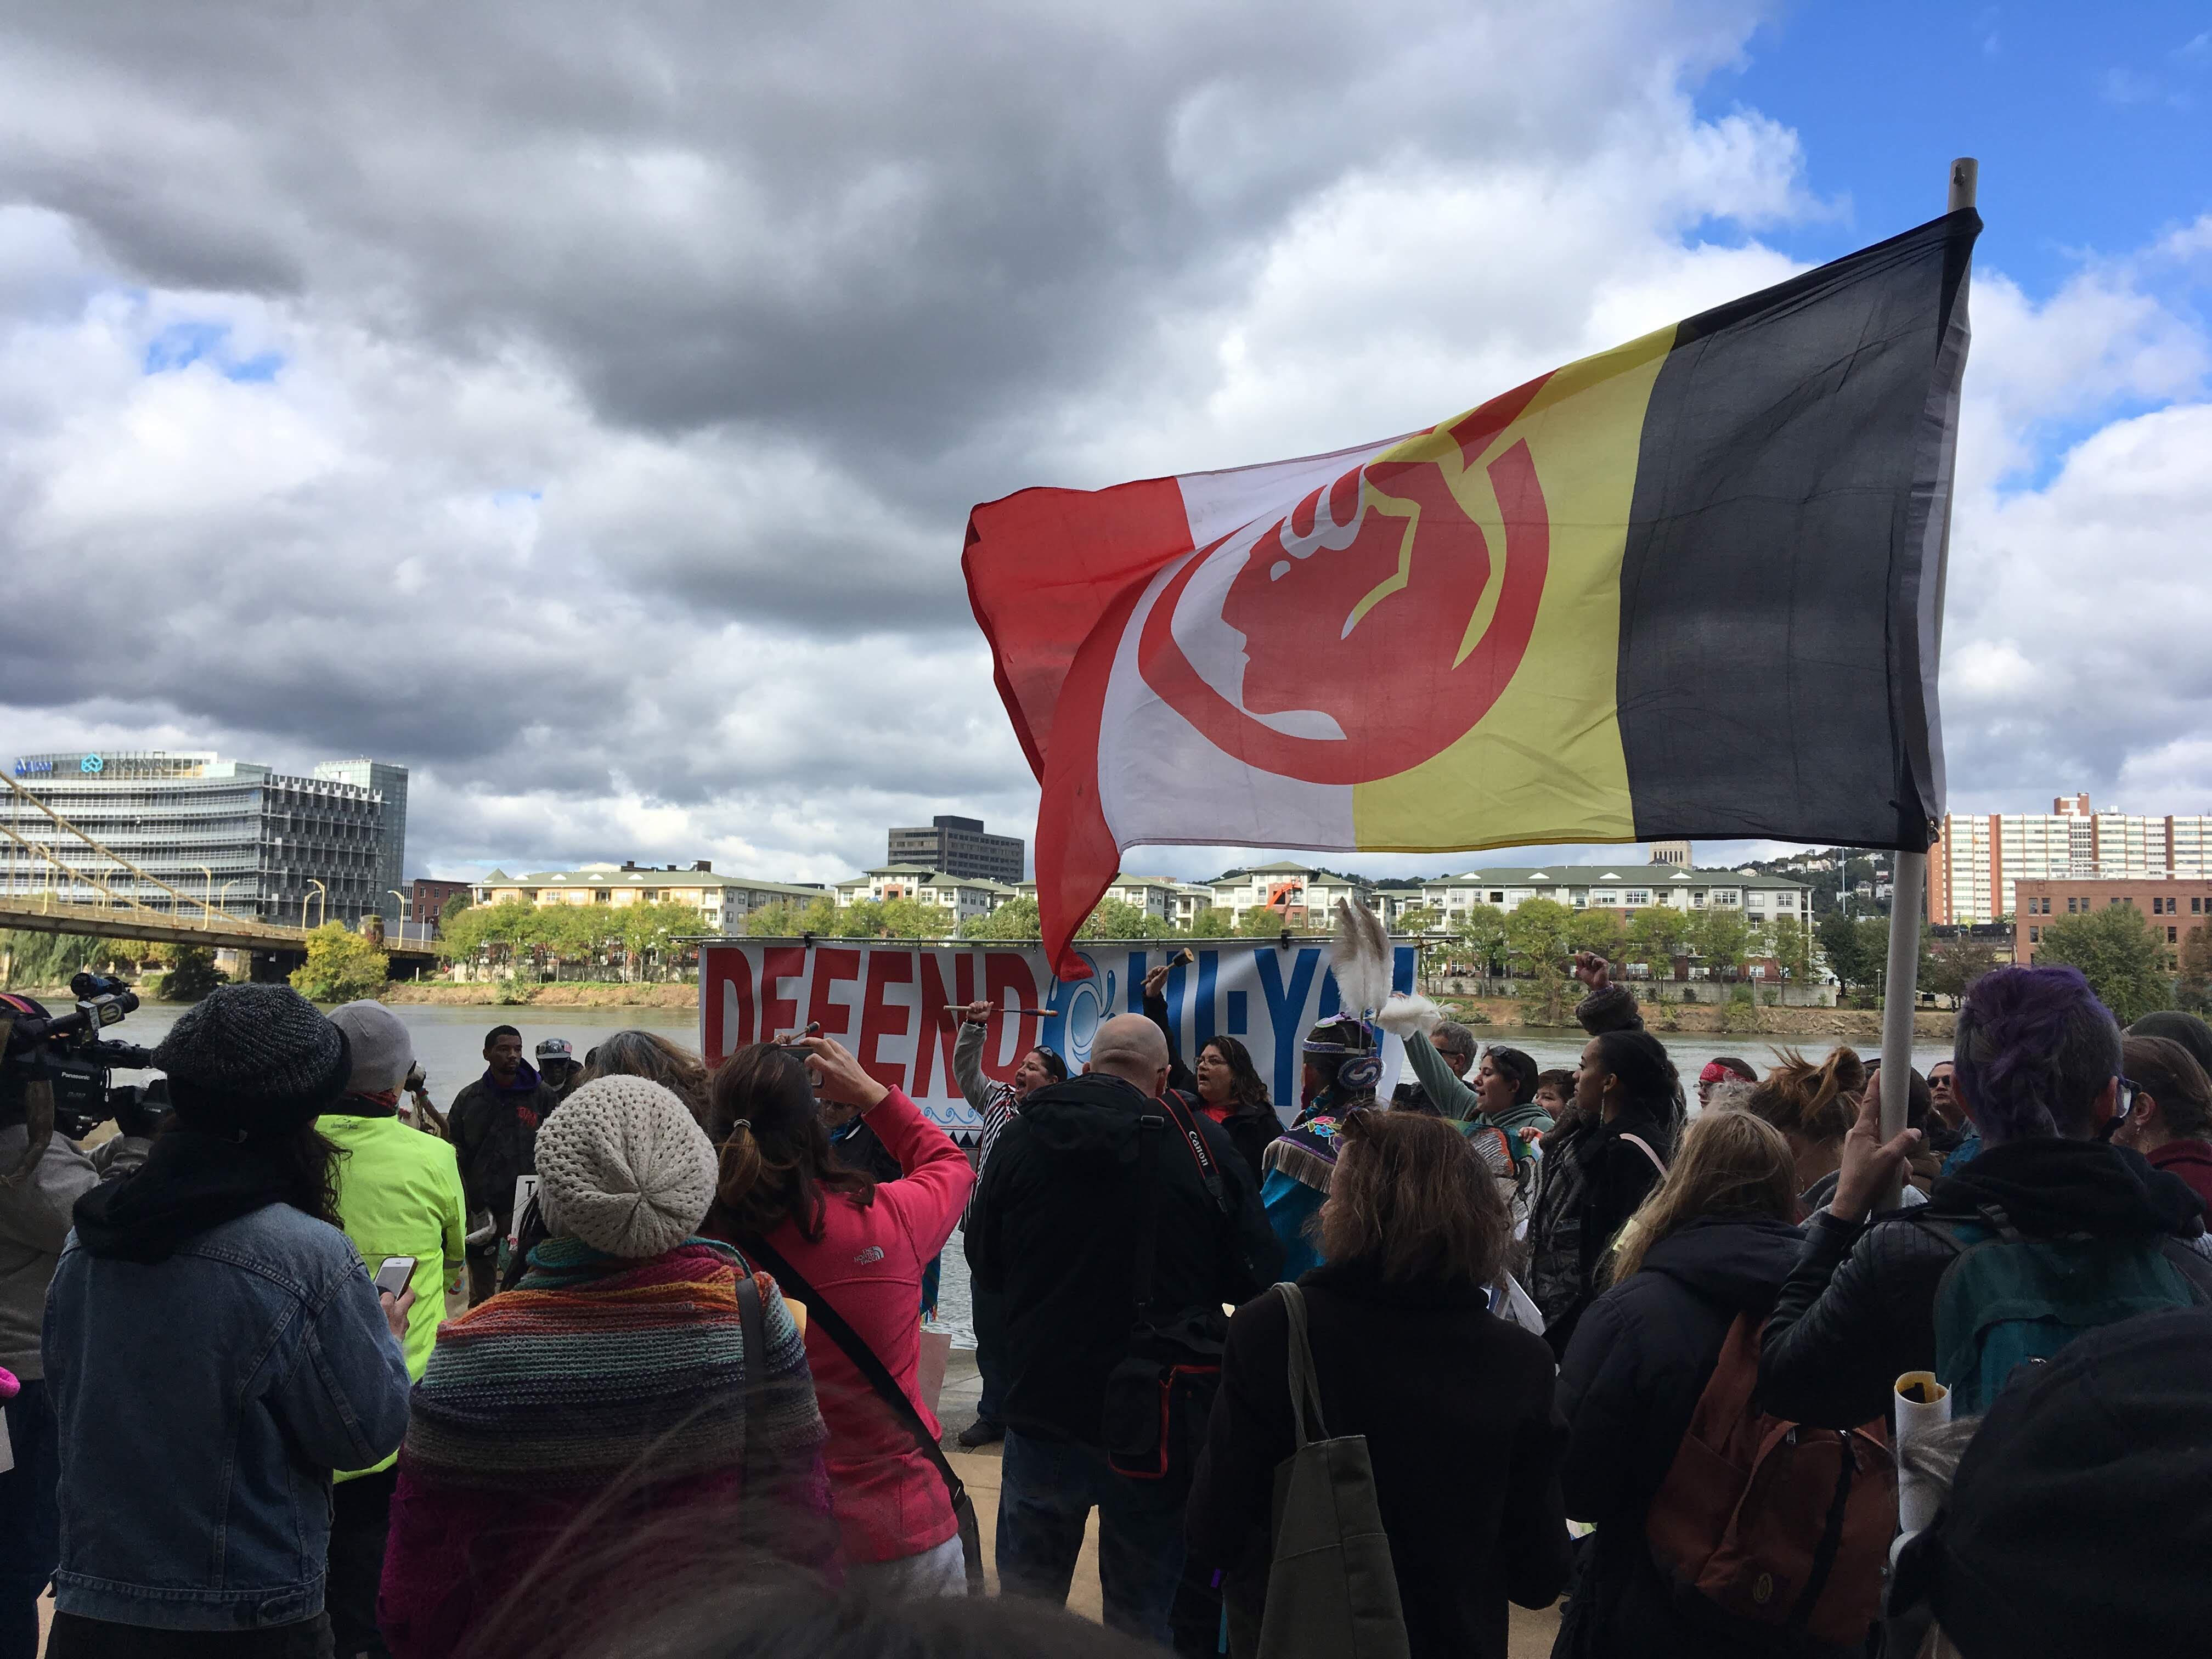
People gather at the headwaters of the Ohio River to advocate for the sustainable development of the region. Add your voice to the movement advocating for People Over Petro by signing up for the coalition’s email updates today!
This data in this article are not exhaustive. FracTracker will be updating these maps as data becomes available.
By Erica Jackson, Community Outreach and Communications Specialist, FracTracker Alliance
![]()
216 Franklin St, Suite 400, Johnstown, PA 15901
Phone: +1 (717) 303-0403 | info@fractracker.org
FracTracker Alliance is a 501(c)3 non-profit: Tax identification number: 80-0844297