Surveyor Symbols & Signs – A Guide
The following guide is a simplified description of a variety of markings that are used by land surveyors. Throughout an active shale gas field, the first signs of pending expansions are the simple markings of stakes, flags, and pins. Many months or even years before the chain saw fells the first tree or the first dozer blade cuts the dirt at a well pad location, the surveyors have “marked the target” on behalf of their corporate tactical command staff.
The three most commonly used markings are the simple stakes, flags and pins. These surveyor symbols are common to any construction project and guarantee that everything gets put in the right place. In an active gas field, these marking tools are used for all aspects of exploration and production:
- access roads to well pads,
- widening the traveled portion of the roadway,
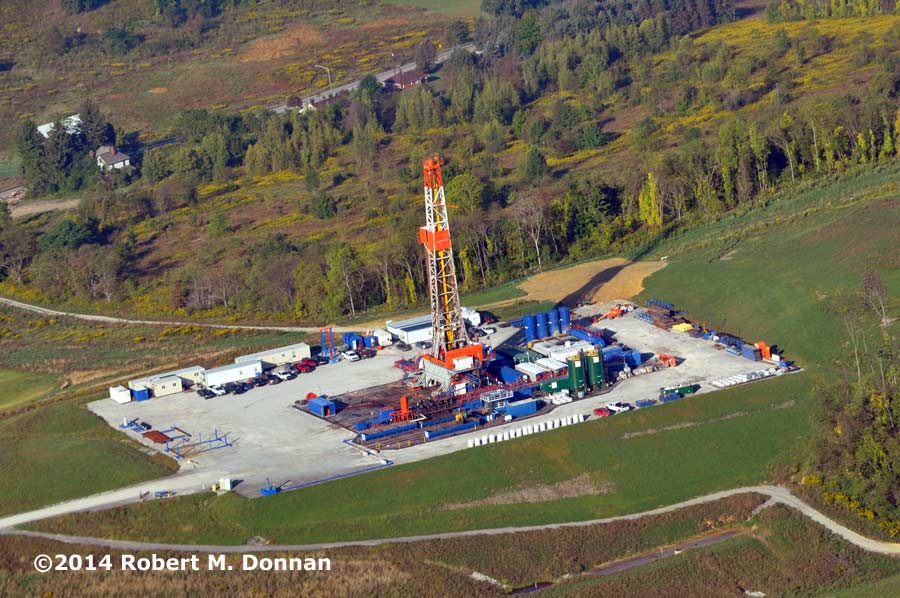
- well locations,
- ponds and impoundment locations,
- temporary water pipeline paths,
- surface disturbance limits,
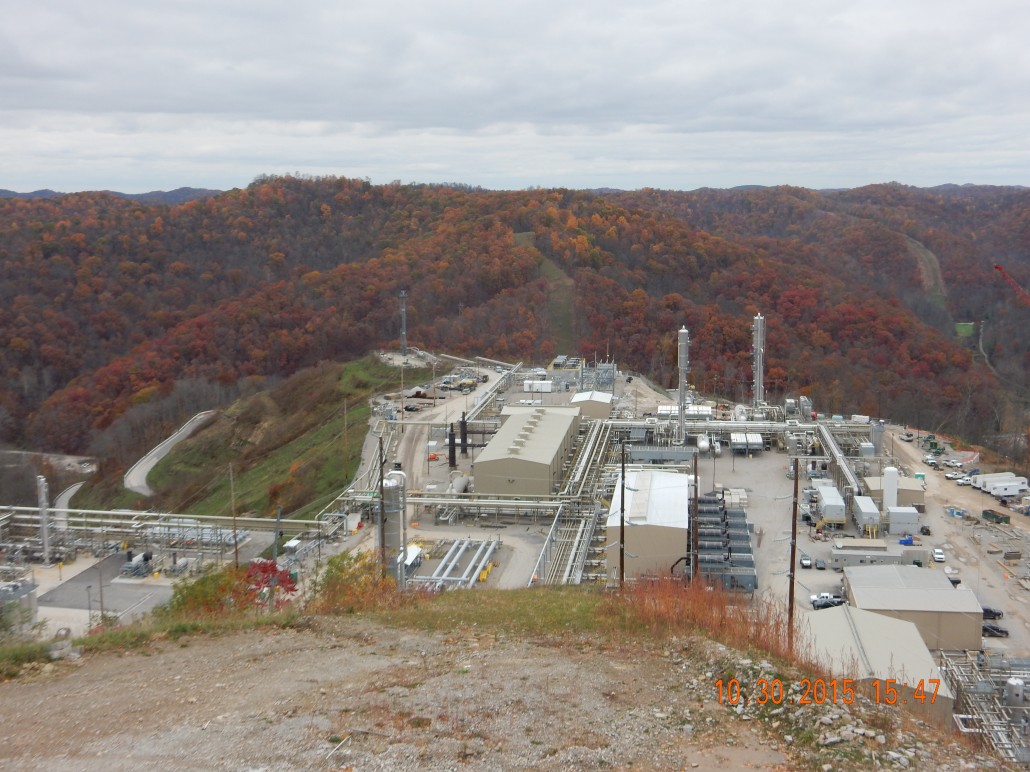
- compressor stations,
- gas processing sites, and
- rights-of-way for roads and pipelines.
Quite frequently these simple markings are undecipherable by themselves, especially by non-professionals. One cannot just know what is happening, what is likely to occur, or how concerned one should be. Context and additional information are usually needed. Sometimes the simple colors and combinations of colored tapes might only make sense in conjunction with similar markings nearby. Sometimes public notices in the newspaper and regulatory permits must be used to decipher what is planned.
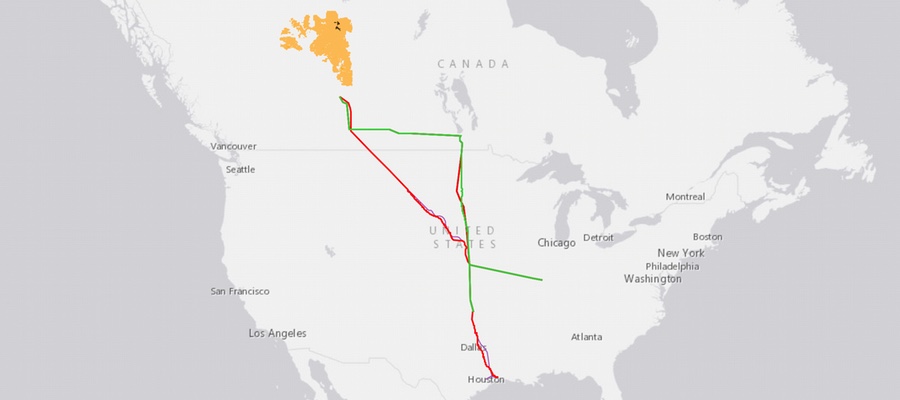
For an example, the proposed 30″ diameter EQT pipeline called the Ohio Valley Connector seems to be regularly marked using a combination of blue and white (see figure 10 below) surveyors tape to mark the actual pipeline location, then green and white (see figure 4 below) to mark all the proposed access roads along the routes that will be used to get pipe trucks and excavation equipment into the right of way. These access roads might be public roadways or cut across private leased property.
Common surveyor symbols & signs (click on images to zoom in)
Surveyor flags and tape: Sometime the flags or streamers are just attached to trees, fence posts, or put on a stake to make them visible above the weeds. There might be no markings on the stake, or only simple generic markings. This could just mean that this is the correct road and turn here. It could also signal a proposed or approximate location for some future work.
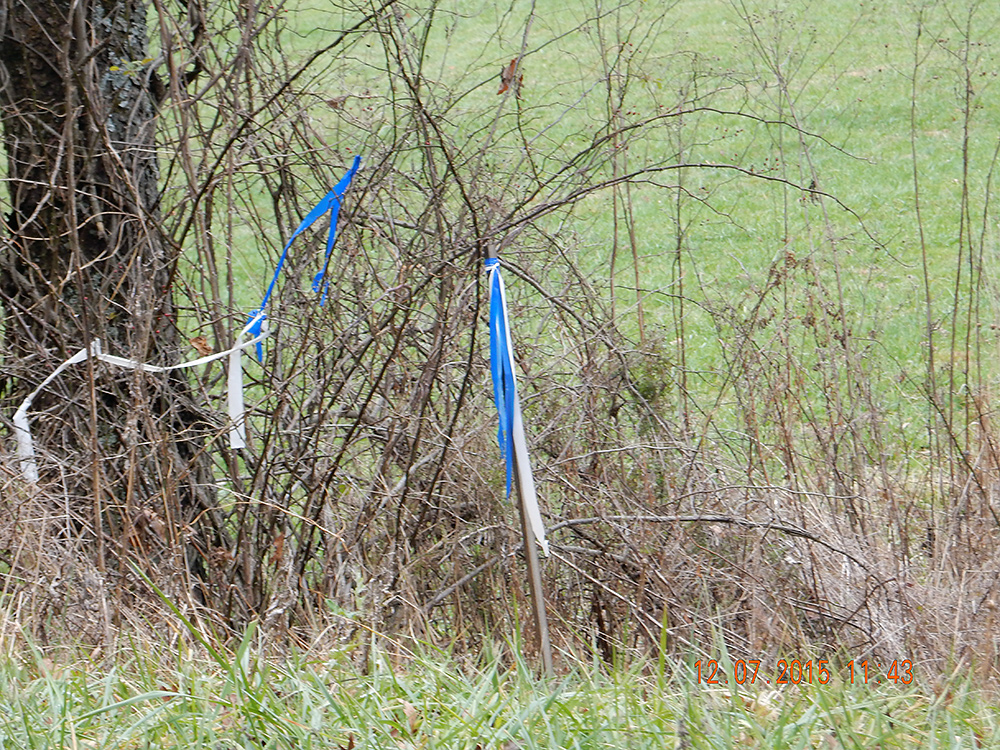
Simple surveyor’s flags or tape
Surveyor flags and tapes: These are a selection of typical surveyor tapes, also called flags or ribbons. Many other specialty color combinations are available to the professional surveyor.
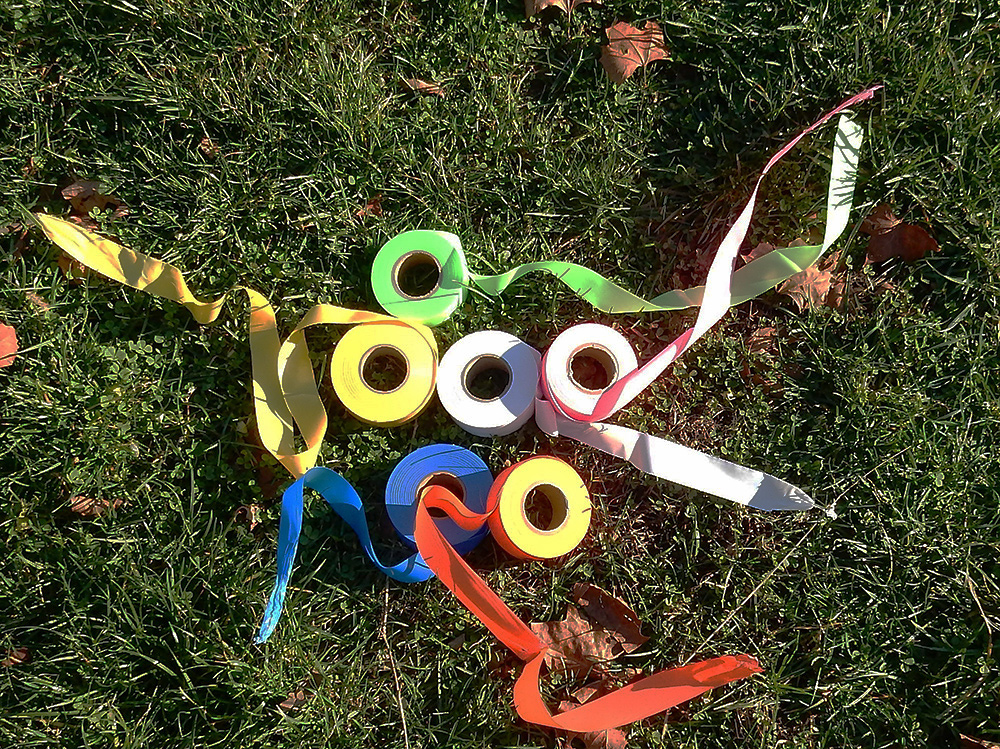
A selection of surveyor tapes
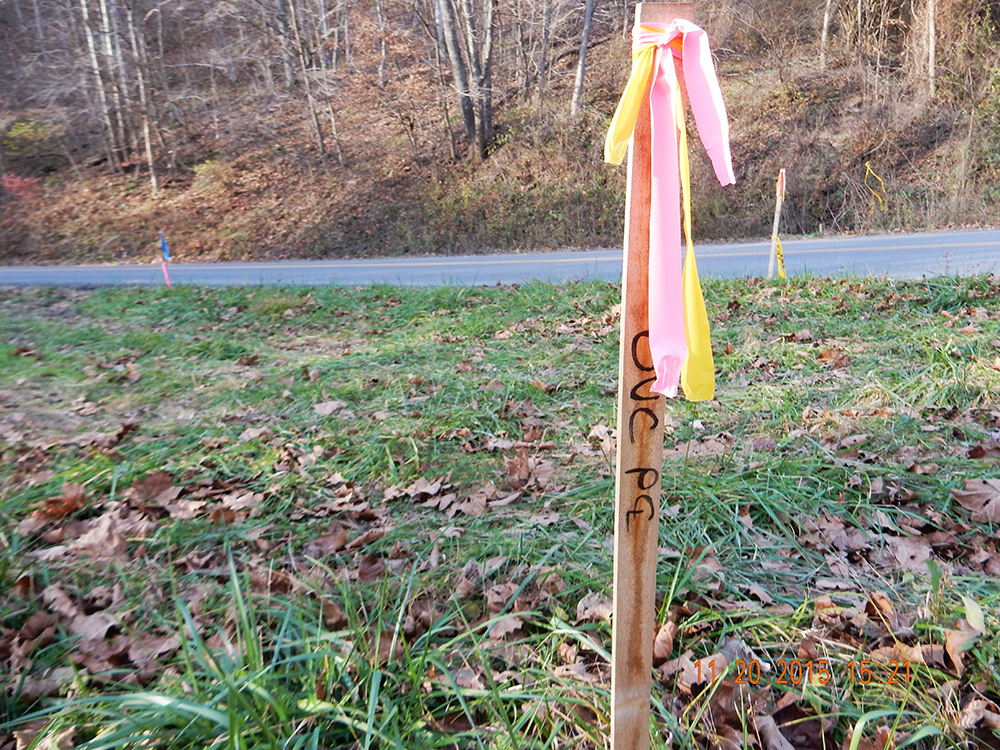
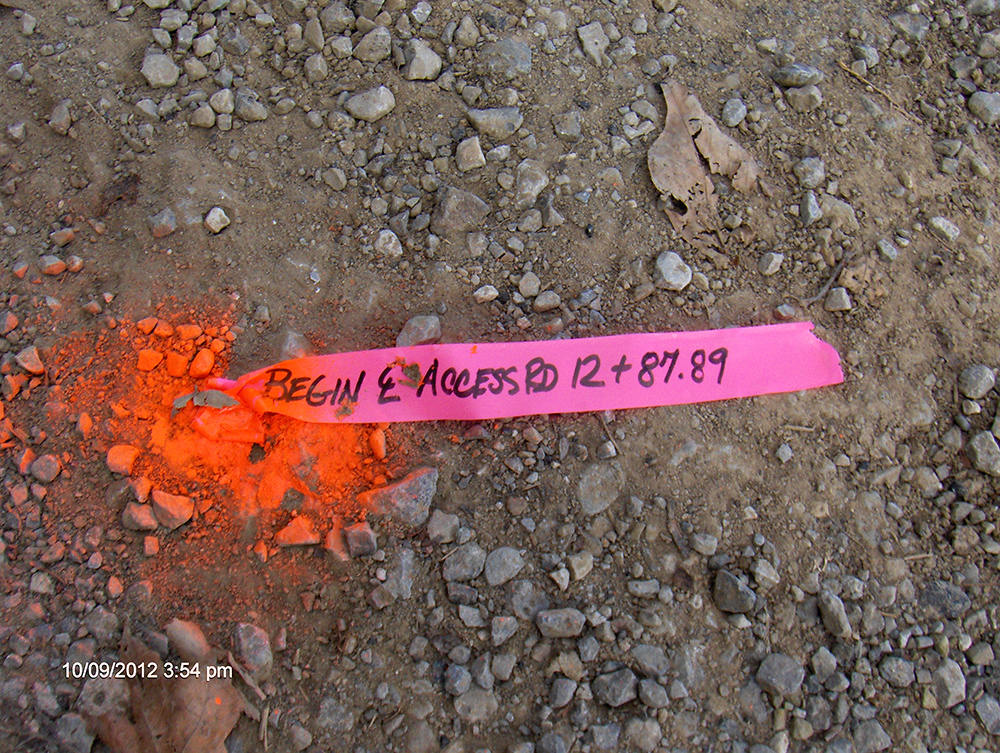
Stakes with simple markings: Flags with some type of identification (it might be names or numbers). This one was used for a proposed well pad access road location. There are no dimensions given on these.
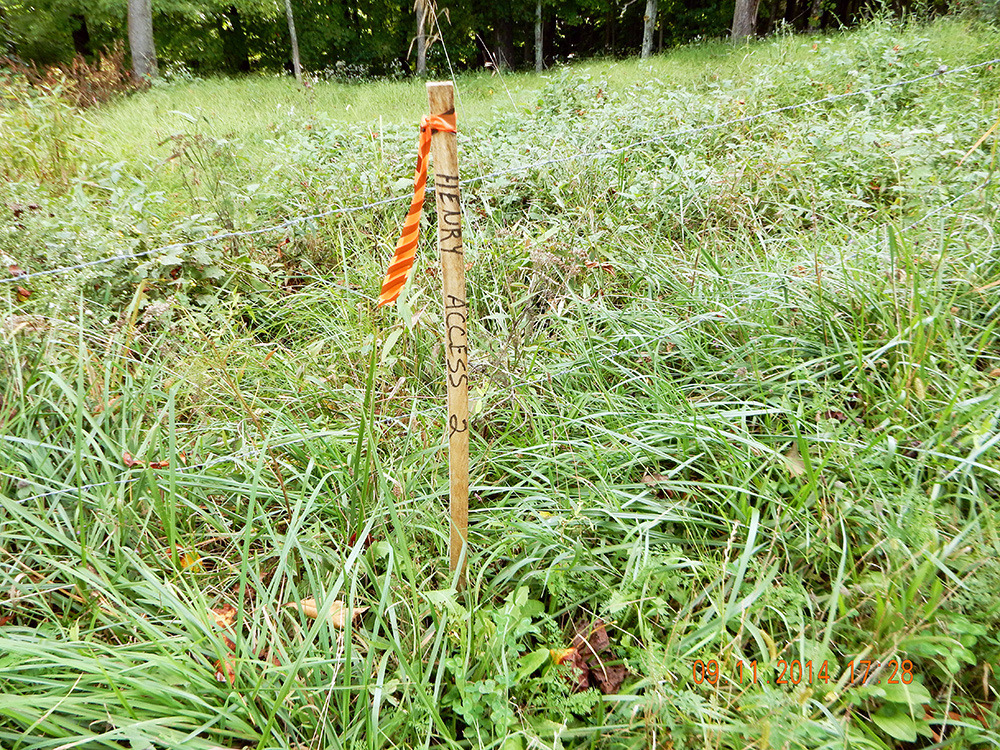
Stake with simple markings
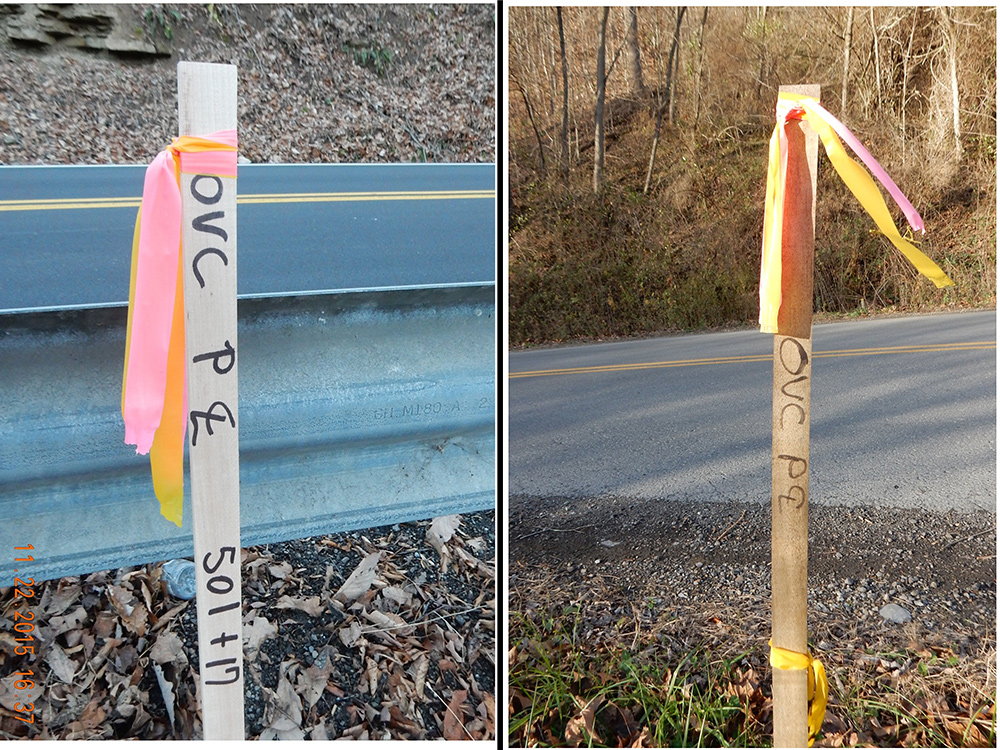
Stakes with simple flags and basic identification: The stakes shown here all indicate an access route to be used for equipment and trucks to get to a proposed pipeline right of way. The “H310″ is the EQT name for the 30” OVC pipeline.
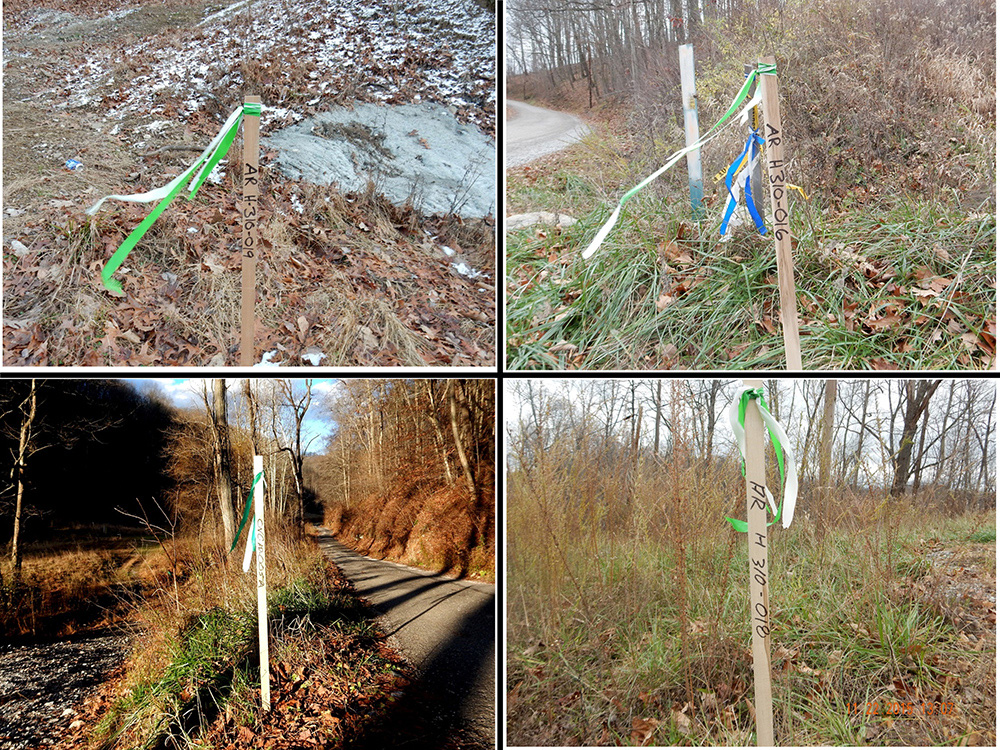
Stakes indicating an access route
Control points: These three stakes are identifying a control point that is outside the limits of disturbance (LoD). These markings surround a pin to be used for reference.
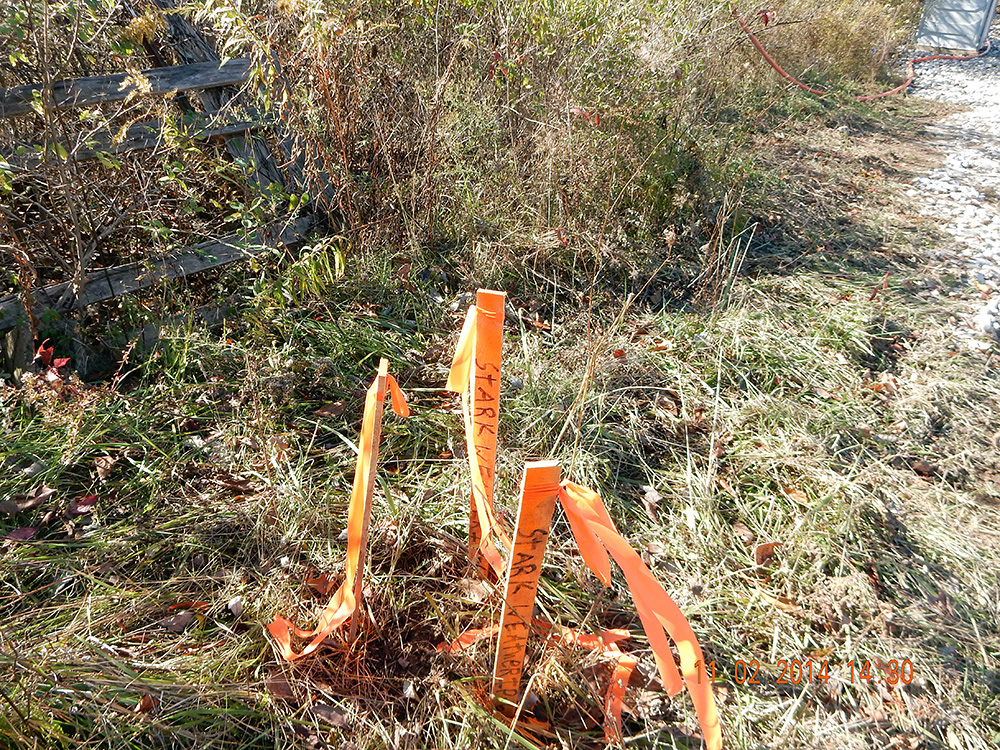
Control point stakes
Controls points: This stake is also identifying a control point location. All control points will have some type of driven metal rod, usually with a plastic cap identifying the surveyor. Frequently there are three stakes with extra flags or tape. They are always set off to the side of the intended work area. They are not to be disturbed.
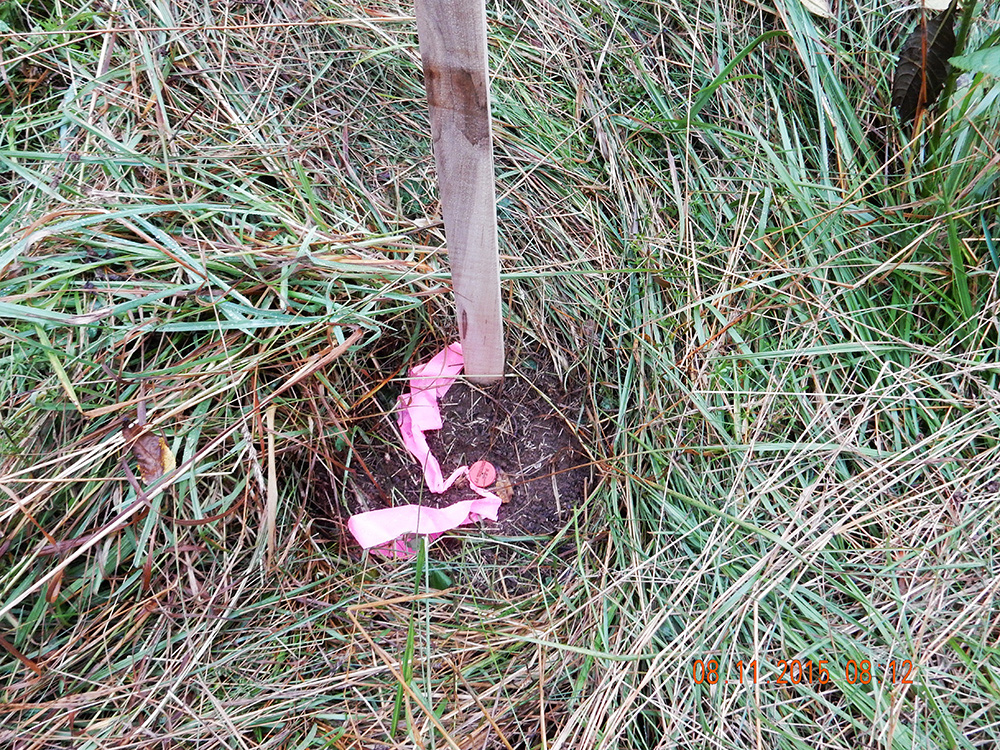
Control point stake and pin
Control points: Another set of three stakes marking a Control Point location. It is common to see triple stakes with elaborate, multiple flags. Even if only two stakes are present, there always will be a driven steel pin and identifying cap.
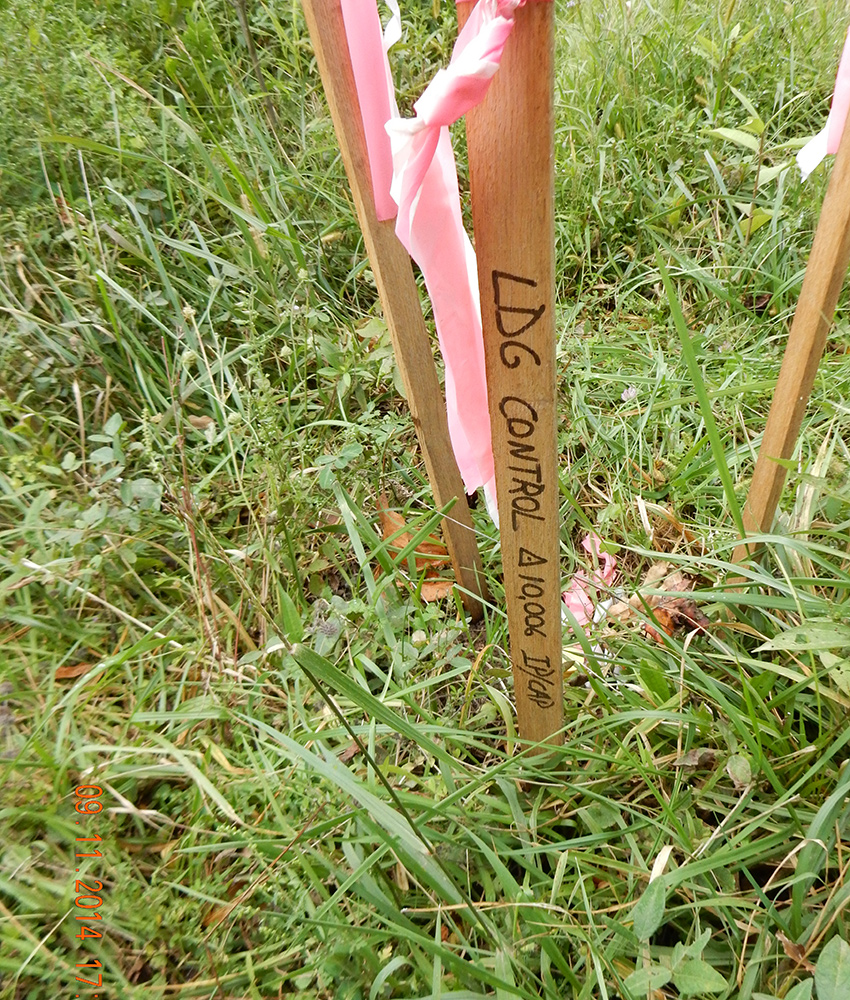
Control point stakes and pin
Control points: This shows a close-up of the identifying cap on a metal driven steel pin. Control point locations are not meant to be disturbed as they are for future and repeated reference. They might give the latitude and longitude on the stake plus the altitude above sea level.
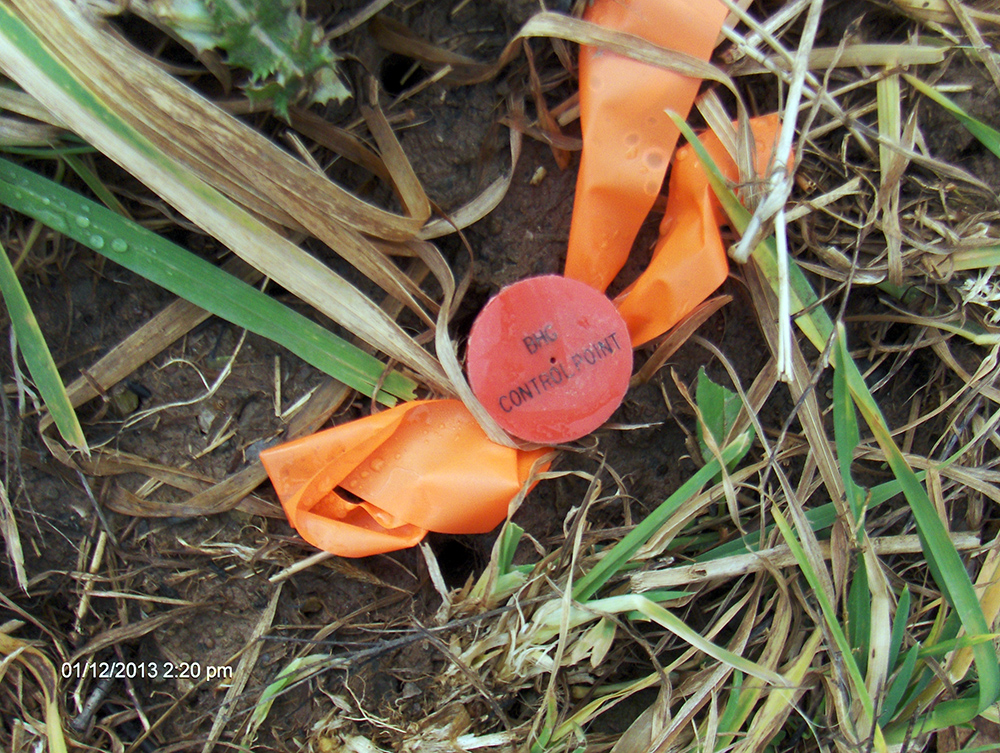
Control point pin and cap
Control points: This is another, older control point location. This represents a typical arrangement where the stakes somewhat try to protect the metal pin from a bulldozer blade by warning its operator.
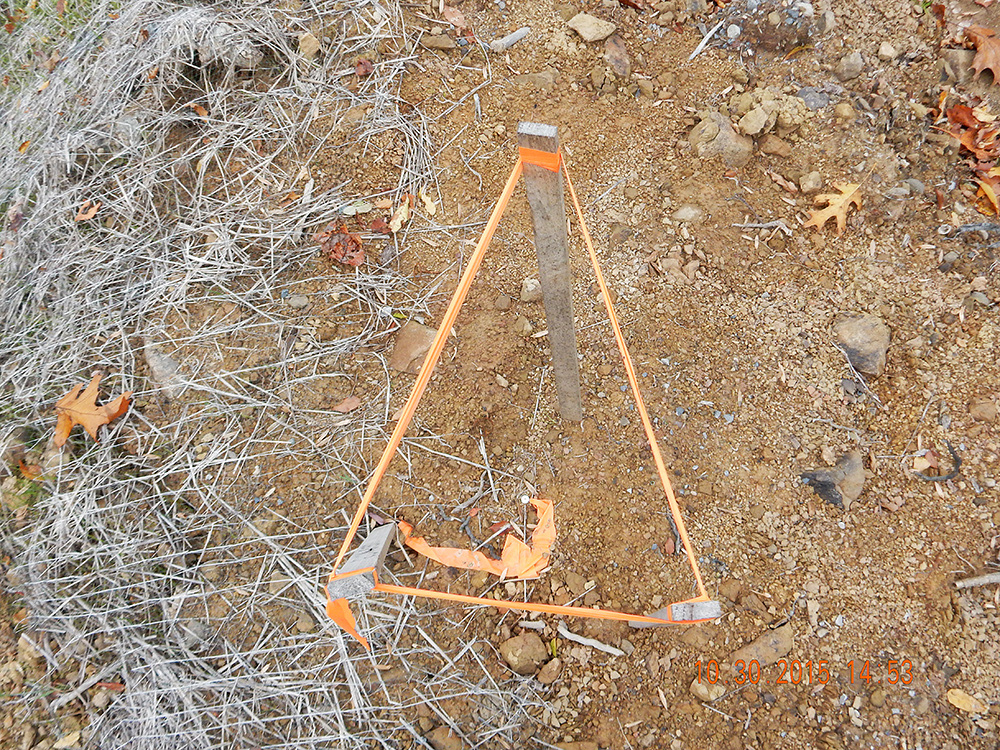
Control point pin protection
Limit of disturbance: The “L O D” here means the limits of disturbance. Beyond this point there should not be any trees cut or dirt moved. The stakes shown here indicates that this is the outside limit of where the contractor will be disturbing the original contour of the surface soil.
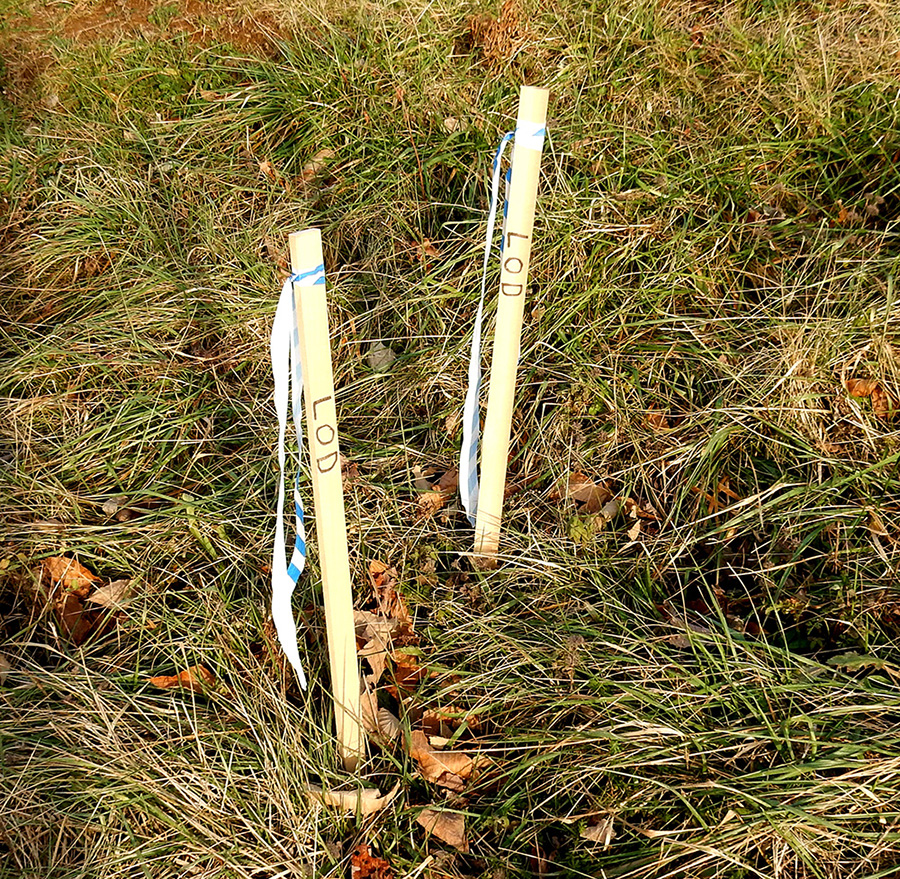
Limit of disturbance stakes
Limit of disturbance: The “L O D” means the limits of disturbance of the proposed pipeline right of way. Beyond this point there should not be any trees cut or dirt moved. This could also be used for the outside edge of well pads or access roads or pond locations.
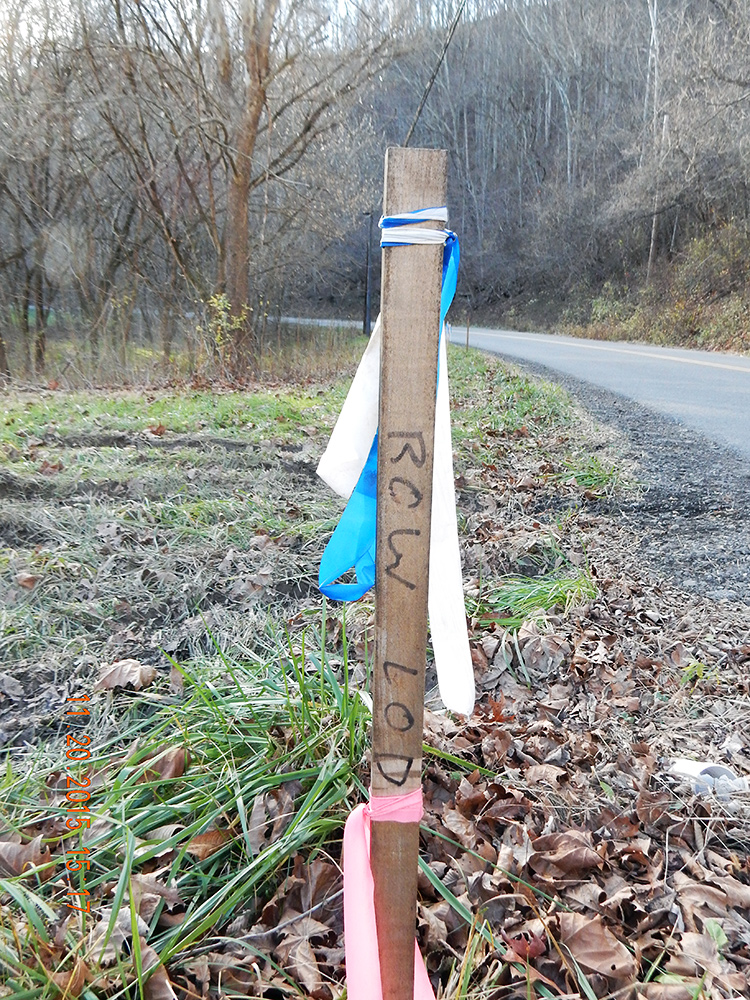
Limit of disturbance ROW stakes
Pipelines: Stakes with flags and “center line” markings are usually for pipelines. Here you see the symbol for center line: a capital letter “C” imposed on the letter “L”.
Pipelines center line
Pipelines: Again you see the capital letter “C” super imposed on top of the letter “L” used frequently for pipe line center lines, but can also be used for proposed access roads.
Pipelines center line
Pipelines: As shown here, “C” and “L” center line flags can also be used for future well pad access roads.
Road access center line
Precise location markings: Stakes like this will usually have a steel pin also associated with it. This stake gives the latitude, longitude, and elevation of the site.
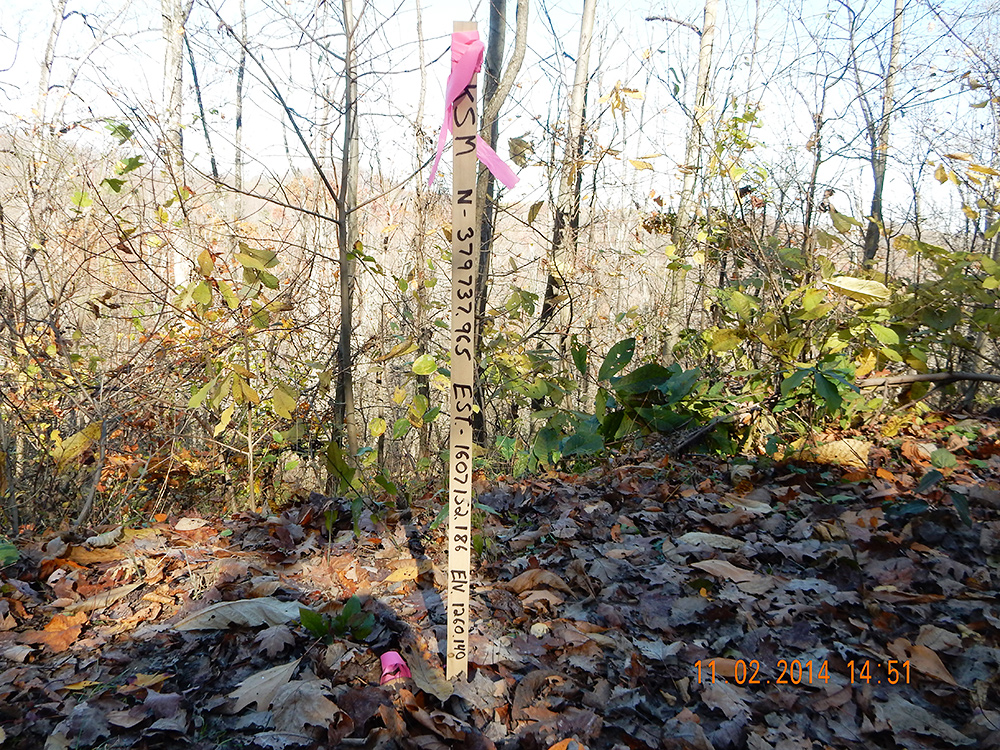
Precise location stake
Permanent property lines: You may also find markings, like this one inch steel rod with an alum cap, that denote permanent property lines and corners of property.
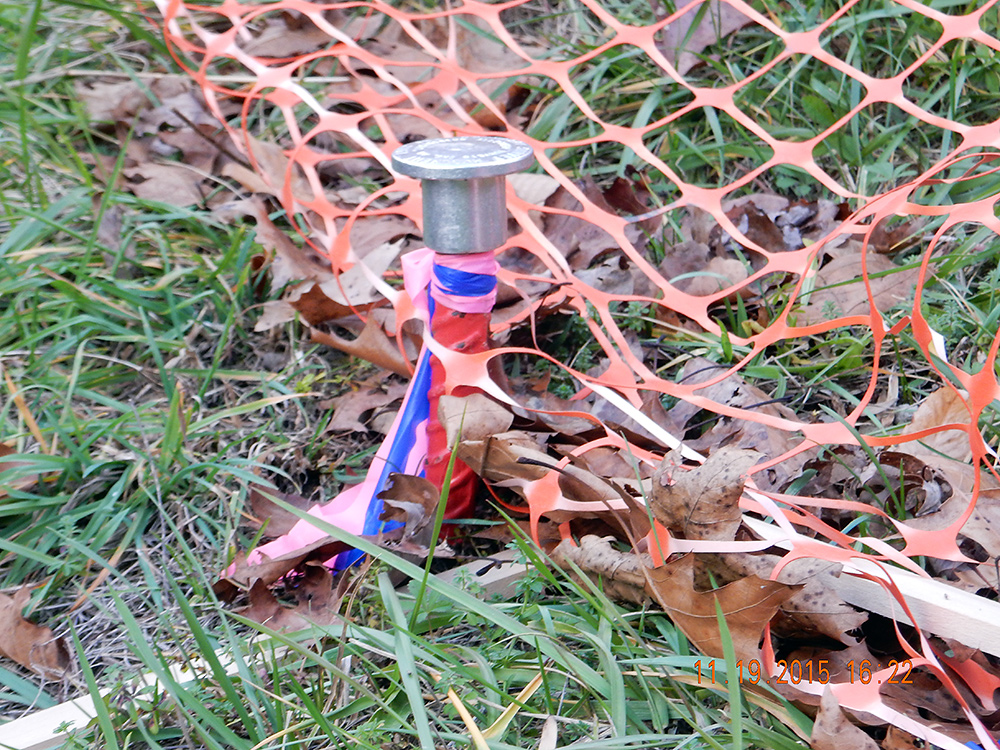
Permanent property rod
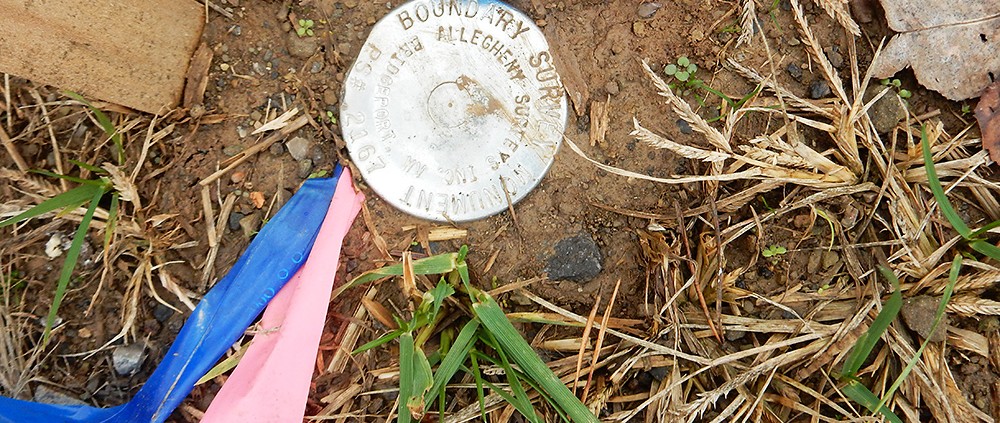
Permanent property lines: Another kind of permanent property line or corner marker is the “boundary survey monument.” This is likely an aluminum cap on top of a one inch diameter steel bar.
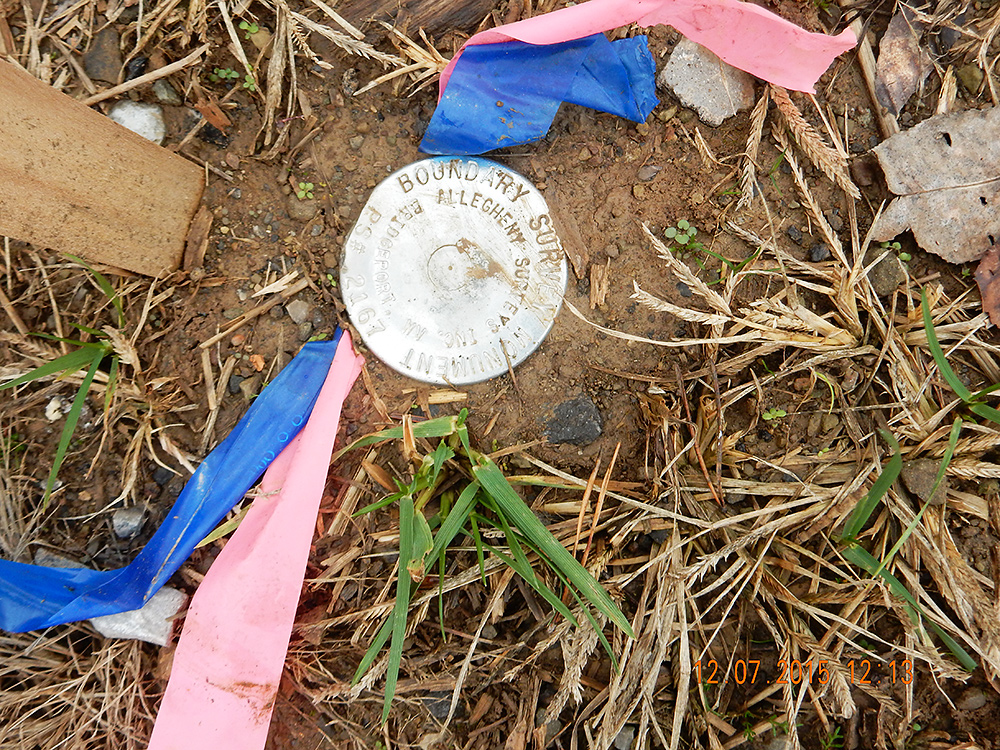
Boundary survey monument


 Both states are at risk from accelerated and more extreme hydrocarbon extraction, but both also bear significant potential for broad success with renewable energy. While only 0.1% of Florida’s current generating capacity comes from solar, it has some of the strongest incoming solar radiation in the country. North Carolina sports the best conditions for offshore wind energy on the east coast. The Tarheel State ranked 2nd in the nation for new installed solar capacity in 2014, and the same year, over 4,300 North Carolinians worked in the solar power industry. Already, 4,800 Floridians work in the solar industry.