Tag Archive for: New Jersey

Incinerators: Dinosaurs in the world of energy generation


In this article, we’ll take a look at the current trend in “re-branding” incineration as a viable option to deal with the mountains of garbage generated by our society. Incineration can produce energy for electricity, but can the costs—both economically, and ecologically—justify the benefits? What are the alternatives?

Changes in our waste stream

In today’s world of consumerism and production, waste disposal is a chronic problem facing most communities worldwide. Lack of attention to recycling and composting, as well as ubiquitous dependence on plastics, synthetics, and poorly-constructed or single-use goods has created a waste crisis in the United States. So much of the waste that we create could be recycled or composted, however, taking extraordinary levels of pressure off our landfills. According to estimates in 2017 by the US Environmental Protection Agency (EPA), over 30 percent of municipal solid waste is made up of organic matter like food waste, wood, and yard trimmings, almost all of which could be composted. Paper, glass, and metals – also recyclable – make up nearly 40 percent of the residential waste stream. Recycling plastic, a material which comprises 13% of the waste stream, has largely been a failed endeavor thus far.

Why say NO to incinerators?

  • They are bad for the environment, producing toxic chlorinated byproducts like dioxins. Incineration often converts toxic municipal waste into other forms, some of which are even more toxic than their precursors.
  • They often consume more energy than they produce and are not profitable to run.
  • They add CO2 to the atmosphere.
  • They promote the false narrative that we can “get something” from our trash
  • They detract from the conversation about actual renewable energy sources like wind power, solar power, and geothermal energy that will stop the acceleration of climate chaos.

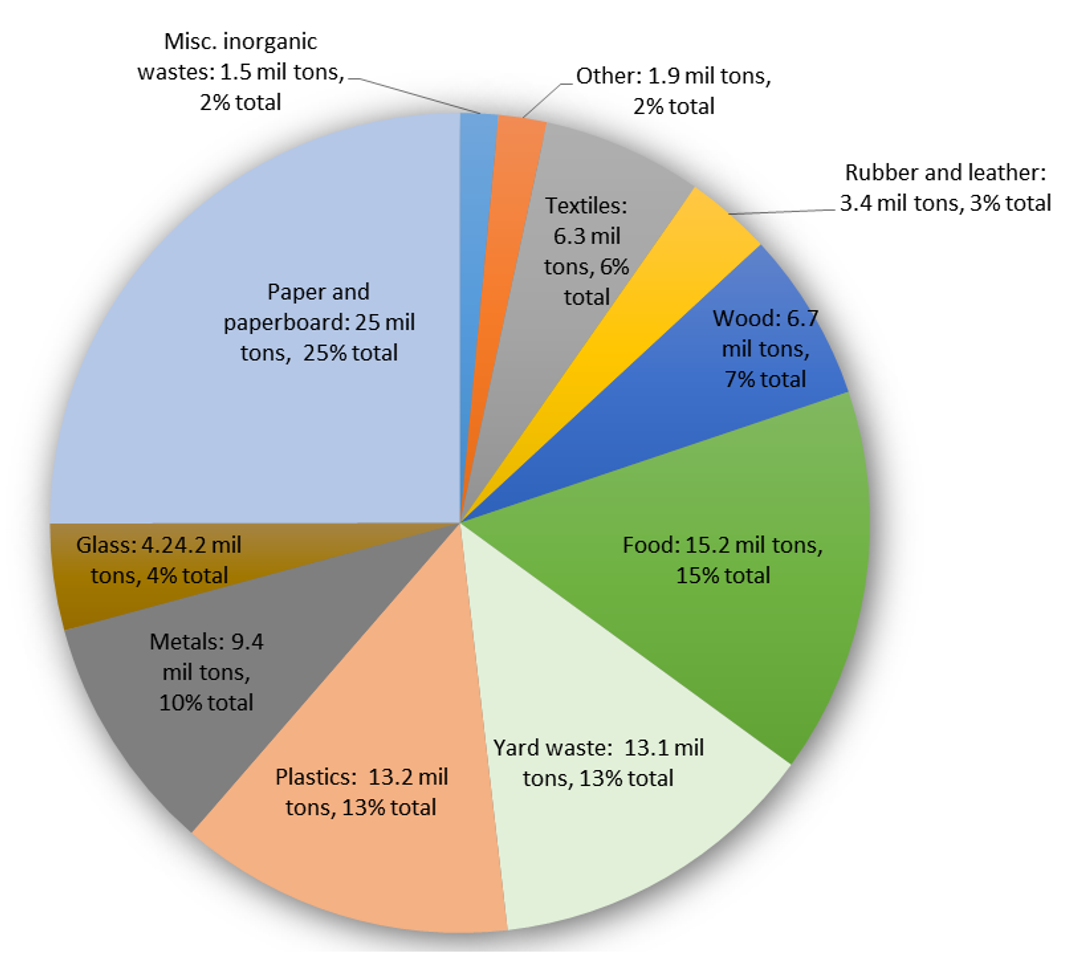
Figure 1: A breakdown of the 267.78 million tons of municipal waste that were generated in the US in 2017. Source: figure developed by FracTracker Alliance, based on 2017 EPA data. Source: https://www.epa.gov/facts-and-figures-about-materials-waste-and-recycling/national-overview-facts-and-figures-materials

Nevertheless, of the approximately 400 million tons of plastic produced annually around the world, only about 10% of it is recycled. The rest winds up in the waste stream or as microfragments (or microplastics) in our oceans, freshwater lakes, and streams.

Figure 2: Increase in global plastics production, 1950-2015, Source: Geyer, R., Jambeck, J. R., & Law, K. L. (2017). Production, use, and fate of all plastics ever made. Science Advances, 3(7), e1700782. Available at: http://advances.sciencemag.org/content/3/7/e1700782 Referenced in https://ourworldindata.org/plastic-pollution

According to an EPA fact sheet, by 2017, municipal solid waste generation increased three-fold compared with 1960. In 1960, that number was 88.1 million tons. By 2017, this number had risen to nearly 267.8 million tons. Over that same period, per-capita waste generation rose from 2.68 pounds per person per day, to 4.38 pounds per person per day, as our culture became more wed to disposable items.

The EPA provides a robust “facts and figures” breakdown of waste generation and disposal here.  In 2017, 42.53 million tons of US waste was shipped to landfills, which are under increasing pressure to expand and receive larger and larger loads from surrounding area, and, in some cases, hundreds of miles away.

How are Americans doing in reducing waste?

On average, in 2017, Americans recycled and composted 35.2% of our individual waste generation rate of 4.51 pounds per person per day.  While this is a notable jump from decades earlier, much of the gain appears to be in the development of municipal yard waste composting programs. Although the benefits of recycling are abundantly clear, in today’s culture, according to a PEW Research Center report published in 2016, just under 30% of Americans live in communities where recycling is strongly encouraged. An EPA estimate for 2014 noted that the recycling rate that year was only 34.6%, nationwide, with the highest compliance rate at 89.5% for corrugated boxes.

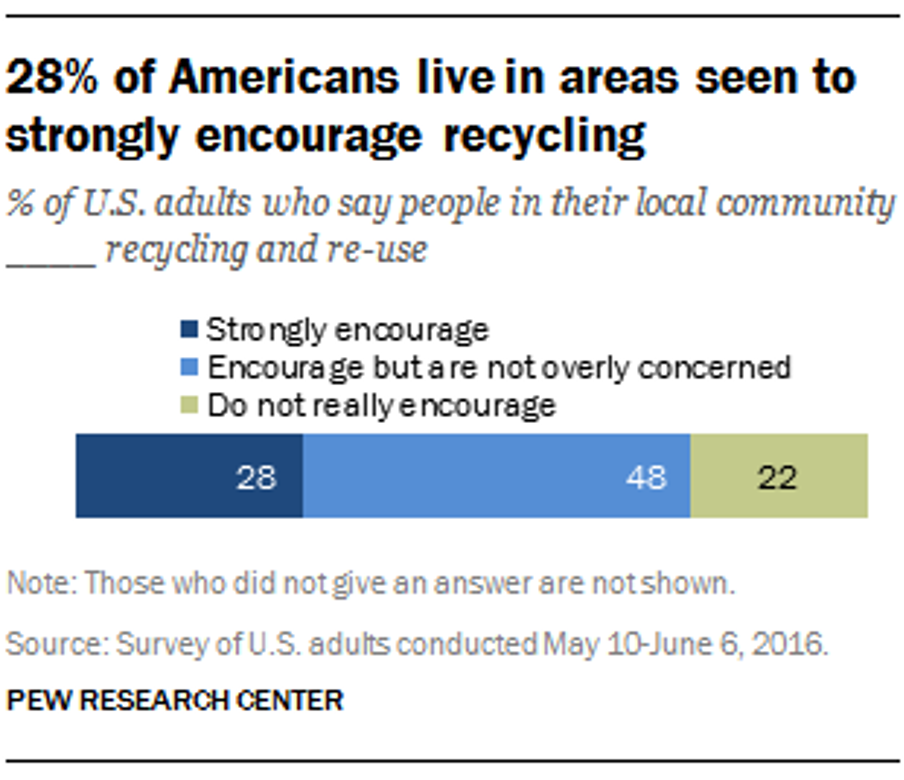
Figure 3. Percent of Americans who report recycling and re-use behaviors in their communities, via Pew Research center
Historically, incineration – or burning solid waste – has been one method for disposing of waste. And in 2017, this was the fate of 34 million tons—or nearly 13%– of all municipal waste generated in the United States. Nearly a quarter of this waste consisted of containers and packaging—much of that made from plastic.  The quantity of packaging materials in the combusted waste stream has jumped from only 150,000 tons in 1970 to 7.86 million tons in 2017.  Plastic, in its many forms, made up 16.4% of all incinerated materials, according to the EPA’s estimates in 2017.

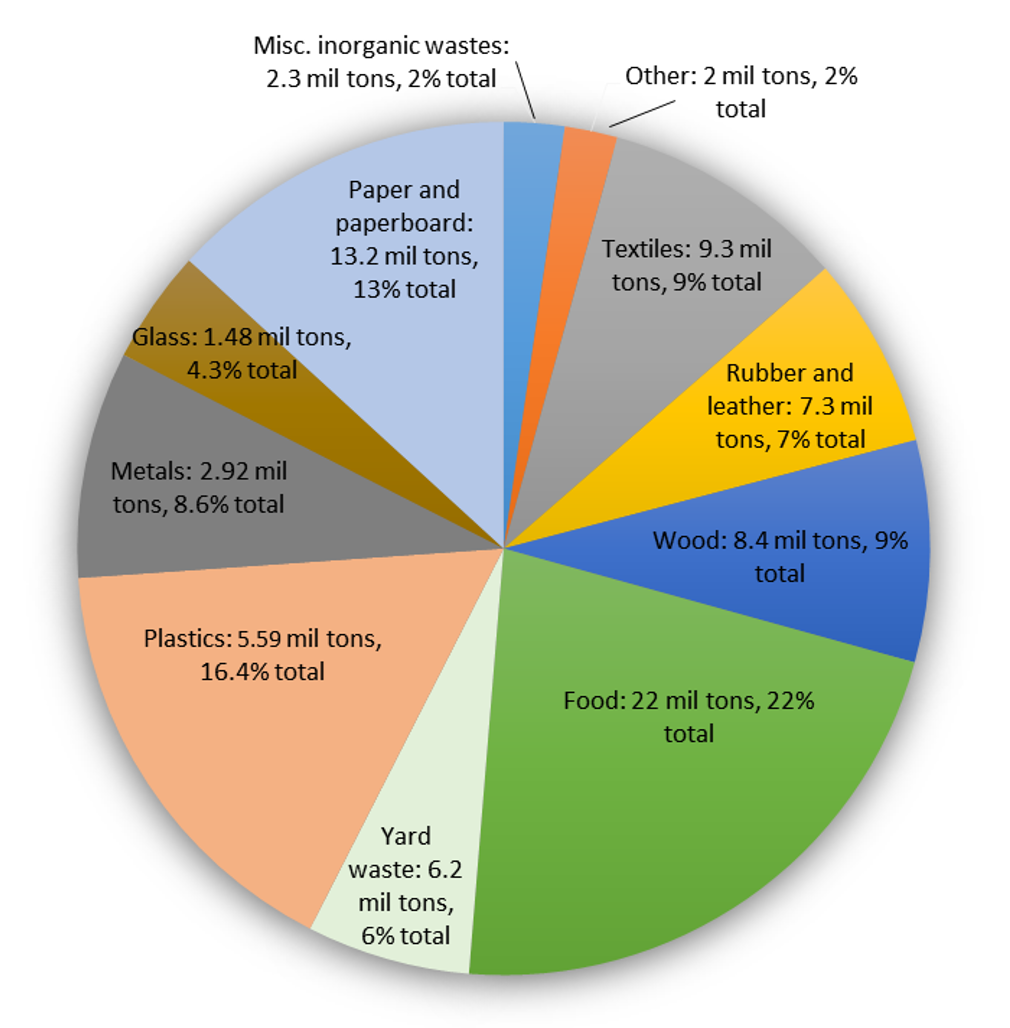
Figure 4: A breakdown of the 34.03 tons of municipal waste incinerated for energy in the US in 2017

What is driving the abundance of throw-away plastics in our waste stream?

Sadly, the answer is this: The oil and gas industry produces copious amounts of ethane, which is a byproduct of oil and gas extraction. Plastics are an “added value” component of the cycle of fossil fuel extraction. FracTracker has reported extensively on the controversial development of ethane “cracker” plants, which chemically change this extraction waste product into feedstock for the production of polypropylene plastic nuggets. These nuggets, or “nurdles,” are the building blocks for everything from fleece sportswear, to lumber, to packaging materials. The harmful impacts from plastics manufacturing on air and water quality, as well as on human and environmental health, are nothing short of stunning.

FracTracker has reported extensively on this issue. For further background reading, explore:

A report co-authored by FracTracker Alliance and the Center for Environmental Integrity in 2019 found that plastic production and incineration in 2019 contributed greenhouse gas emissions equivalent to that of 189 new 500-megawatt coal power plants. If plastic production and use grow as currently planned, by 2050, these emissions could rise to the equivalent to the emissions released by more than 615 coal-fired power plants.

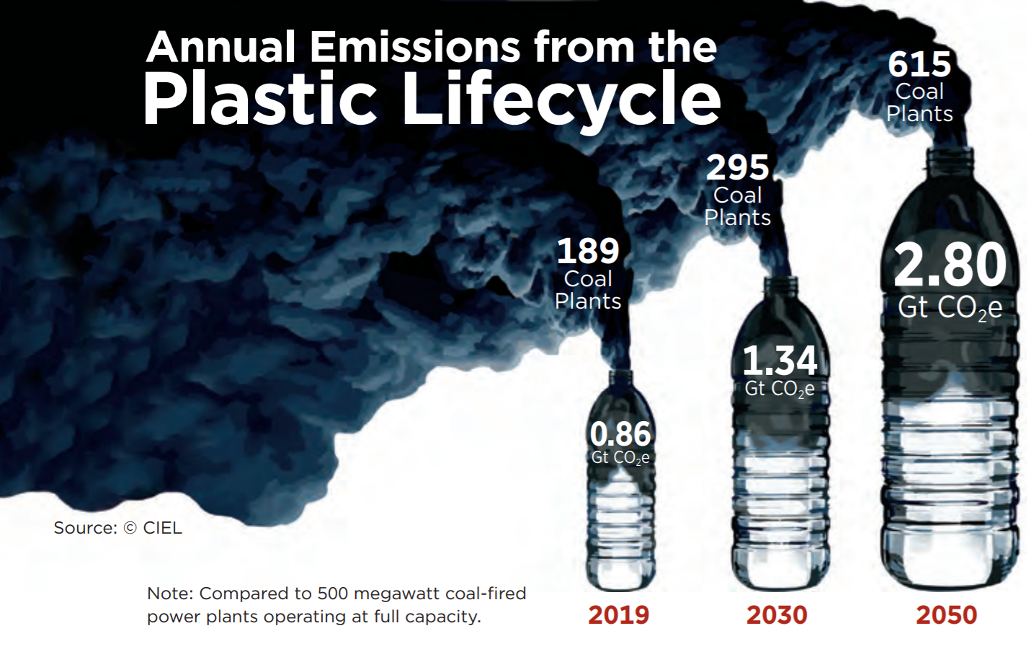
Figure 5: Projected carbon dioxide equivalencies in plastics emissions, 2019-2050. Source: Plastic and Climate https://www.ciel.org/plasticandclimate/

Just another way of putting fossil fuels into our atmosphere

Incineration is now strongly critiqued as a dangerous solution to waste disposal as more synthetic and heavily processed materials derived from fossils fuels have entered the waste stream. Filters and other scrubbers that are designed to remove toxins and particulates from incineration smoke are anything but fail-safe. Furthermore, the fly-ash and bottom ash that are produced by incineration only concentrate hazardous compounds even further, posing additional conundrums for disposal.

Incineration as a means of waste disposal, in some states is considered a “renewable energy” source when electricity is generated as a by-product. Opponents of incineration and the so-called “waste-to-energy” process see it as a dangerous route for toxins to get into our lungs, and into the food stream. In fact, Energy Justice Network sees incineration as:

… the most expensive and polluting way to make energy or to manage waste. It produces the fewest jobs compared to reuse, recycling and composting the same materials. It is the dirtiest way to manage waste – far more polluting than landfills. It is also the dirtiest way to produce energy – far more polluting than coal burning.

Municipal waste incineration: bad environmentally, economically, ethically

Waste incineration has been one solution for disposing of trash for millennia. And now, aided by technology, and fueled by a crisis to dispose of ever-increasing trash our society generates, waste-to-energy (WTE) incineration facilities are a component in how we produce electricity.

But what is a common characteristic of the communities in which WTEs are sited? According to a 2019 report by the Tishman Environmental and Design Center at the New School, 79% of all municipal solid waste incinerators are located in communities of color and low-income communities.  Incinerators are not only highly problematic environmentally and economically. They present direct and dire environmental justice threats.

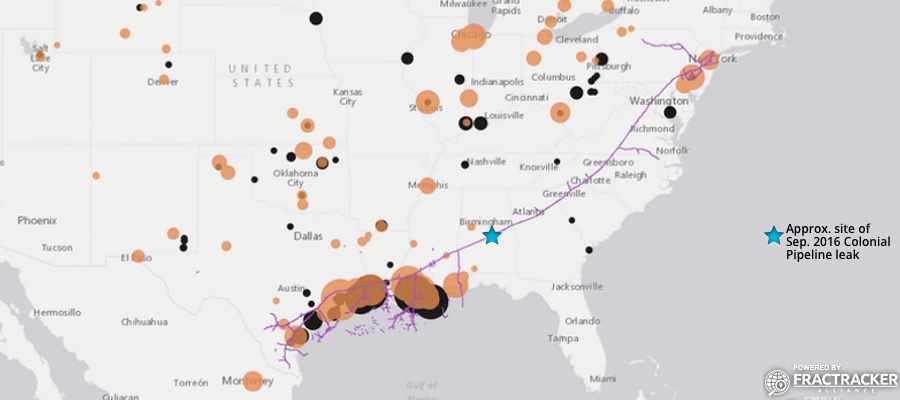
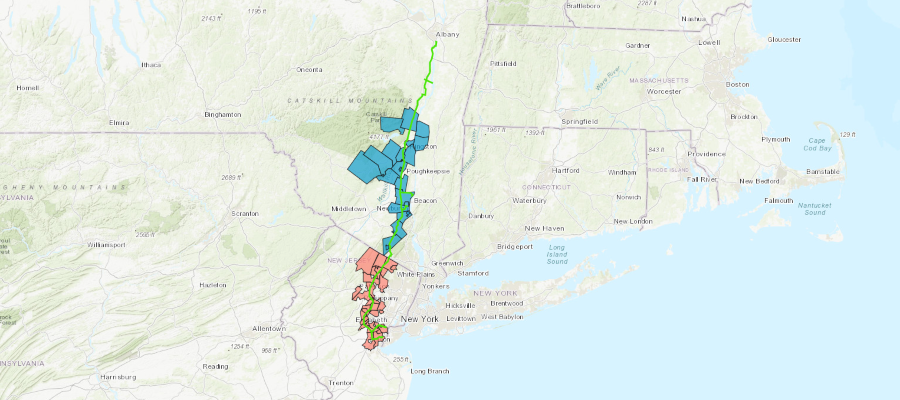
Waste-to-Energy facilities in the US, existing and proposed

Click here to view this map full-screen

Activate the Layers List button to turn on Environmental Justice data on air pollutants and cancer occurrences across the United States.  We have also included real-time air monitoring data in the interactive map because one of the health impacts of incineration includes respiratory illnesses. These air monitoring stations measure ambient particulate matter (PM 2.5) in the atmosphere, which can be a helpful metric.

What are the true costs of incineration?

These trash incinerators capture energy released from the process of burning materials, and turn it into electricity. But what are the costs? Proponents of incineration say it is a sensible way to reclaim or recovery energy that would otherwise be lost to landfill disposal. The US EIA also points out that burning waste reduces the volume of waste products by up to 87%.

The down-side of incineration of municipal waste, however, is proportionally much greater, with a panoply of health effects documented by the National Institutes for Health, and others.

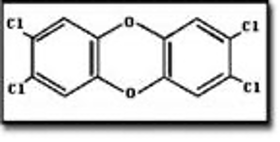
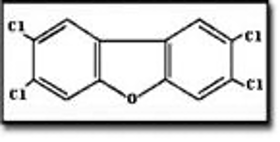
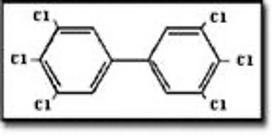
Dioxins (shown in Figures 6-11) are some of the most dangerous byproducts of trash incineration. They make up a group of highly persistent organic pollutants that take a long time to degrade in the environment and are prone to bioaccumulation up the food chain.

Dioxins are known to cause cancer, disrupt the endocrine and immune systems, and lead to reproductive and developmental problems. Dioxins are some of the most dangerous compounds produced from incineration. Compared with the air pollution from coal-burning power plants, dioxin concentrations produced from incineration may be up to 28 times as high.

2,3,7,8-Tetrachlorodibenzo-p-dioxin

2,3,7,8-Tetrachlorodibenzofuran

3,3′,4,4′,5,5′-Hexachlorobiphenyl

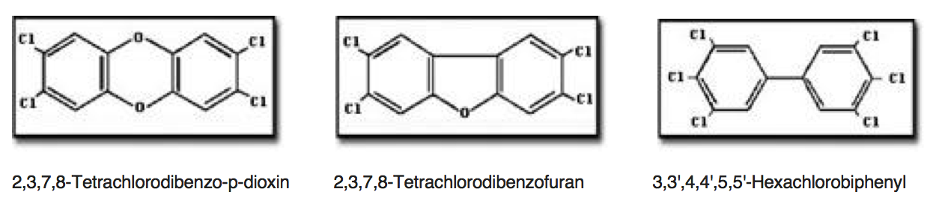
Figures 6-11: Dioxin chemical structures via US EPA. Source: https://www.epa.gov/dioxin/learn-about-dioxin
 

Federal EPA regulations between 2000 and 2005 resulted in the closure of nearly 200 high dioxin emitting plants. Currently, there are fewer than 100 waste-to-energy incinerators operating in the United States, all of which are required to operate with high-tech equipment that reduces dioxins to 1% of what used to be emitted. Nevertheless, even with these add-ons, incinerators still produce 28 times the amount of dioxin per BTU when compared with power plants that burn coal.

Even with pollution controls required of trash incinerators since 2005, compared with coal-burning energy generation, incineration still releases 6.4 times as much of the notoriously toxic pollutant mercury to produce the equivalent amount of energy.

Energy Justice Network, furthermore, notes that incineration is the most expensive means of managing waste… as well as making energy. This price tag includes high costs to build incinerators, as well as staff and maintain them — exceeding operation and maintenance costs of coal by a factor of 11, and nuclear by a factor of 4.2.

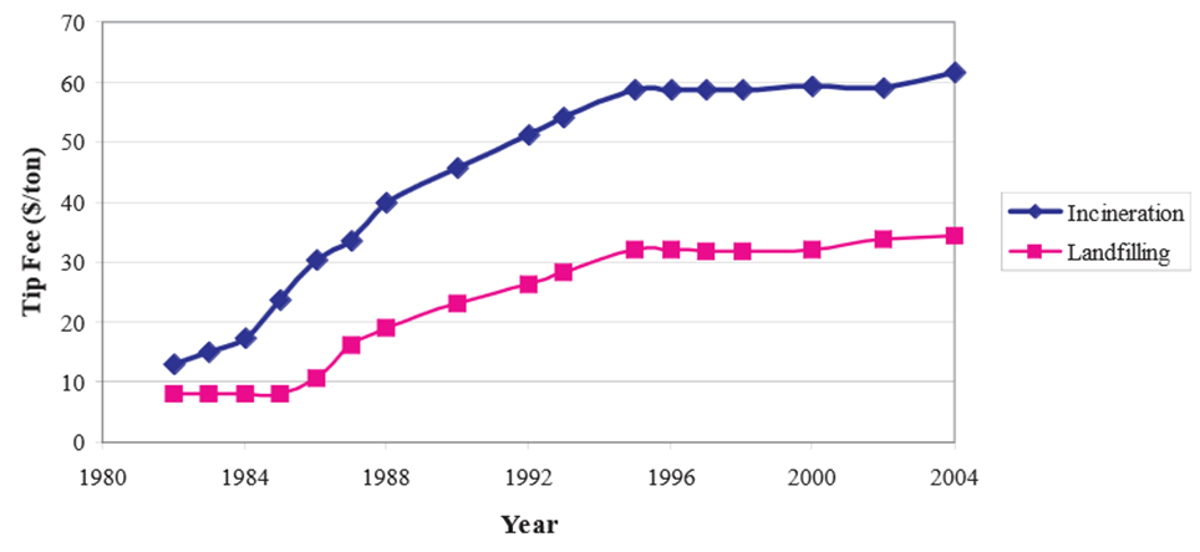
Figure 12. Costs of incineration per ton are nearly twice that of landfilling. Source: National Solid Waste Management Association 2005 Tip Fee Survey, p. 3.
Energy Justice Network and others have pointed out that the amount of energy recovered and/or saved from recycling or composting is up to five times that which would be provided through incineration.

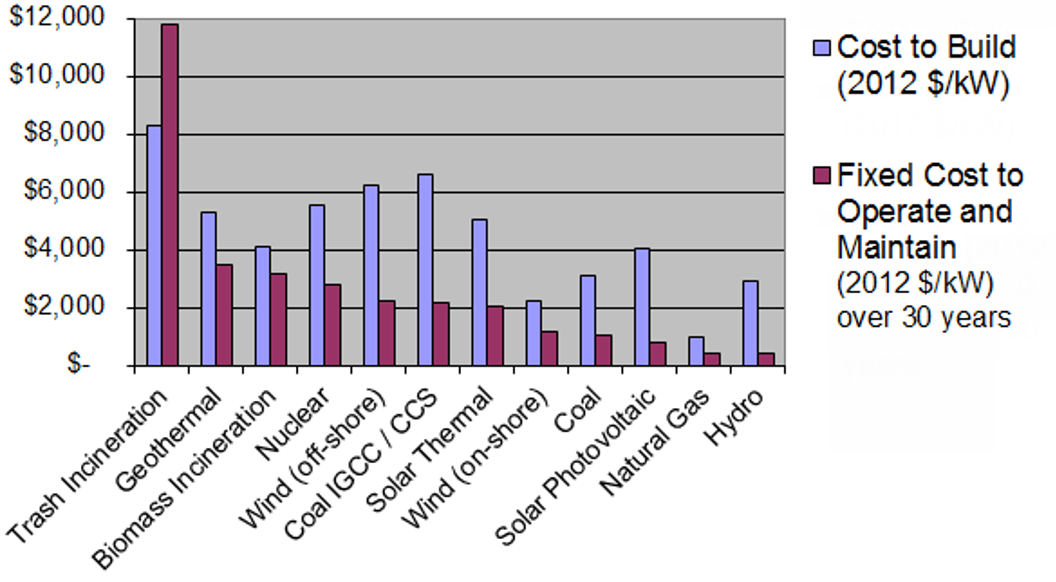
Figure 13. Estimated power plant capital and operating costs. Source: Energy Justice Network

The myth that incineration is a form of “renewable energy”

Waste is a “renewable” resource only to the extent that humans will continue to generate waste. In general, the definition of “renewable” refers to non-fossil fuel based energy, such as wind, solar, geothermal, wind, hydropower, and biomass. Synthetic materials like plastics, derived from oil and gas, however, are not. Although not created from fossil fuels, biologically-derived products are not technically “renewable” either.

ZeroWasteEurope argues that:

Biogenic materials you find in the residual waste stream, such as food, paper, card and natural textiles, are derived from intensive agriculture – monoculture forests, cotton fields and other “green deserts”. The ecosystems from which these materials are derived could not survive in the absence of human intervention, and of energy inputs from fossil sources. It is, therefore, more than debatable whether such materials should be referred to as renewable.

Although incineration may reduce waste volumes by up to 90%, the resulting waste-products are problematic. “Fly-ash,” which is composed of the light-weight byproducts, may be reused in concrete and wallboard. “Bottom ash” however, the more coarse fraction of incineration—about 10% overall—concentrates toxins like heavy metals. Bottom-ash is disposed of in landfills or sometimes incorporated into structural fill and aggregate road-base material.

How common is the practice of using trash to fuel power plants?

Trash incineration accounts for a fraction of the power produced in the United States. According to the United States Energy Information Administration, just under 13% of electricity generated in the US comes from burning of municipal solid waste, in fewer than 65 waste-to-energy plants nation-wide. Nevertheless, operational waste-to-incineration plants are found throughout the United States, with a concentration east of the Mississippi.

According to EnergyJustice.net’s count of waste incinerators in the US and Canada, currently, there are:

    • 88 operating
    • 41 proposed
    • 0 expanding
    • 207 closed or defeated

Figure 14. Locations of waste incinerators that are already shut down. Source: EnergyJustice.net)
Precise numbers of these incinerators are difficult to ascertain, however. Recent estimates from the federal government put the number of current waste-to-energy facilities at slightly fewer: EPA currently says there are 75 of these incinerators in the United States. And in their database, updated July 2020, the United States Energy Information Administration (EIA), lists 63 power plants that are fueled by municipal solid waste. Of these 63 plants, 40—or 66%—are in the northeast United States.

Regardless, advocates of clean energy, waste reduction, and sustainability argue that trash incinerators, despite improvements in pollution reduction over earlier times and the potential for at least some electric generation, are the least effective option for waste disposal that exists. The trend towards plant closure across the United States would support that assertion.

Let’s take a look at the dirty details on WTE facilities in three states in the Northeastern US.

Review of WTE plants in New York, Pennsylvania, and New Jersey

A. New York State

In NYS, there are currently 11 waste-to-energy facilities that are operational, and two that are proposed. Here’s a look at some of them:

The largest waste-to-energy facility in New York State, Covanta Hempstead Company (Nassau County), was built in 1989. It is a 72 MW generating plant, and considered by Covanta to be the “cornerstone of the town’s integrated waste service plan.”

According to the Environmental Protection Agency’s ECHO database, this plant has no violations listed. Oddly enough, even after drawing public attention in 2009 about the risks associated with particulate fall-out from the plant, the facility has not been inspected in the past 5 years.

Other WTE facilities in New York State include the Wheelabrator plant located in Peekskill (51 MW), Covanta Energy of Niagara in Niagara Falls (32 MW), Convanta Onondaga in Jamesville (39 MW), Huntington Resource Recovery in Suffolk County (24.3 MW), and the Babylon Resource Recovery Facility also in Suffolk County (16.8 MW). Five additional plants scattered throughout the state in Oswego, Dutchess, Suffolk, Tioga, and Washington Counties, are smaller than 15 MW each. Of those, two closed and one proposal was defeated.

B. Pennsylvania

In Pennsylvania, six WTE facilities are currently operating. Two have been closed, and six defeated.

C. New Jersey

And in New Jersey, there are currently four operating WTE facilities. Essex County Resource Recovery Facility, is New Jersey’s largest WTE facility. It opened in 1990, houses three burners, and produces 93 MW total.

Union County Resource Recovery Facility, which opened in 1994, operates three burners, producing 73 MW total. Covanta Camden Energy Recovery Center opened in 1991. It has 13 burners, producing a total of 46 MW. Wheelabrator Gloucester LP (Westville, NJ) opened in 1990. The two burners there produce 21 MW of power. Covanta Warren Energy is the oldest and smallest WTE facility in New Jersey. It produced 14 MW of energy and opened in 1988. Operations are currently shut down, but this closure may not be permanent.

Throw-aways, burn-aways, take-aways

Looming large above the arguments about appropriate siting, environmental justice, financial gain, and energy prices, is a bigger question:

How can we continue to live on this planet at our current rates of consumption, and the resultant waste generation?

The issue here is not so much about the sources of our heat and electricity in the future, but rather “How MUST we change our habits now to ensure a future on a livable planet?”

Professor Paul Connett (emeritus, St. Lawrence University), is a specialist in the build-up of dioxins in food chains, and the problems, dangers, and alternatives to incineration. He is a vocal advocate for a “Zero Waste” approach to consumption, and suggests that every community embrace these principles as ways to guide a reduction of our waste footprint on the planet. The fewer resources that are used, the less waste is produced, mitigating the extensive costs brought on by our consumptive lifestyles. Waste-to-energy incineration facilities are just a symptom of our excessively consumptive society.

Dr. Connett suggests these simple but powerful methods to drastically reduce the amount of materials that we dispose — whether by incineration, landfill, or out the car window on a back-road, anywhere in the world:

    • Source separation
    • Recycling
    • Door-to-door collection
    • Composting
    • Building Reuse, Repair and Community centers
    • Implementing waste reduction Initiatives
    • Building Residual Separation and Research centers
    • Better industrial design
    • Economic incentives
    • Interim landfill for non-recyclables and biological stabilization of other organic materials

Connett’s Zero Waste charge to industry is this: “If we can’t reuse, recycle, or compost it, industry shouldn’t be making it.” Reducing our waste reduces our energy footprint on the planet.

In a similar vein, FracTracker has written about the potential for managing waste through a circular economics model, which has been successfully implemented by the city of Freiburg, Germany. A circular economic model incorporates recycling, reuse, and repair to loop “waste” back into the system. A circular model focuses on designing products that last and can be repaired or re-introduced back into a natural ecosystem.
 

This is an important vision to embrace. Every day. Everywhere.

Recommended resources

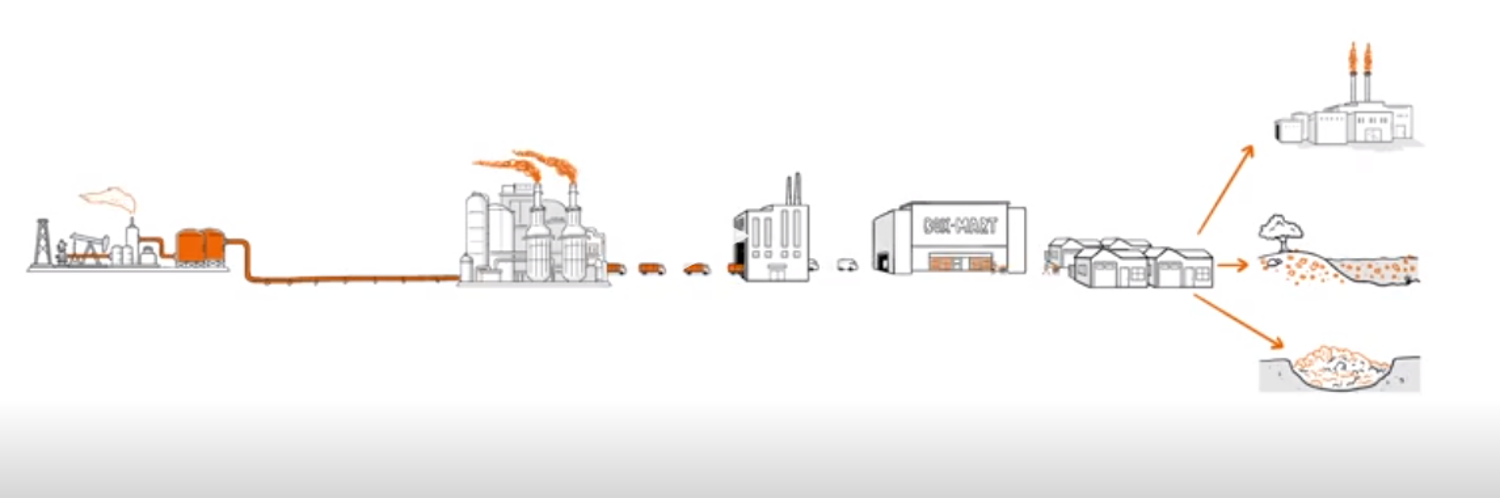
Figure 17: Illustration of common waste streams from “The Story of Plastic” (https://www.storyofplastic.org/)

By Karen Edelstein, Eastern Program Coordinator


Support this work

DONATE

Stay in the know

LNG development puts Wyalusing, Pennsylvania in the cross-hairs

New Fortress Energy plans to build a liquefied natural gas (LNG) plant in Wyalusing, Pennsylvania, but residents in close proximity to the extensive facility and those along the transportation routes are pushing back due to health and safety concerns.

Overview

North America has an excess of fracked gas. The price of gas continues to plummet, due largely to an oversupply that exceeds market demand from Americans who want to enjoy their so-called “energy independence.” According to the United States Energy Information Administration (EIA), there is almost 18% more stored gas at the end of 2019 as there was at the end of 2018, translating to an increase of over 500 billion cubic feet over the course of a year.

What was once a promised economic boom to many communities has given way to bust. This is due, in part, to less production across the fracking fields, to the cancellation of numerous pipelines, and to the lack of domestic markets for fracked gas.

As costs for wind, solar, and grid-scale battery storage continue to drop, people are increasingly less reliant on fossil fuels. Aside from underground storage, what can industry do with all that excess product so industry has a justification to keep drilling?

Rather than cutting back on production, industry chooses to relieve domestic over-saturation by sending the gas off-shore for export.

While gas is typically moved from source to consumer via pipelines, transporting gas long distances overseas presents a technical challenge. Industry chooses to compress the gas under pressure or cryogenics so that it takes up less space. Liquefied natural gas, or LNG, is simply super-cooled methane, stored at minus 260 degrees Fahrenheit.

A new LNG project in northern Pennsylvania

A little more than a year ago, New Fortress Energy announced plans to invest $800 million to develop a liquefied natural gas plant along the scenic Susquehanna River in the Bradford County, Pennsylvania community of Wyalusing. In this quiet community of fewer than 600 people, formerly open fields and woodland are slated to be converted into massive LNG complex spanning 260 acres. The plant would produce approximately 3.6 million gallons of LNG each day.

Located on the site of the proposed LNG project is a historic marker, memorializing the pre-Colonial settlement of Friedenshütten. Here, indigenous Mahican, Lenape, and Haudenosaunee converts to Christianity lived with Moravian missionaries. The village was active between 1765 and 1772. According to Katherine Faull of Bucknell University “the Friedenshütten mission was dissolved in 1772, ostensibly because of the uncertainty of the land deals that had been made with the Cayuga who had jurisdiction over that part of Pennsylvania.” Portions of the settlement structure area visible in the 1768 map (Figure 1) are 700 feet from the New Fortress methane liquefaction buildings.

Figure 1. Map by Georg Wenzel Golkowsky, 1768 (TS Mp.213.13, Unity Archives, Herrnhut)

New Fortress Energy has plans to cut a 50-foot-wide stormwater drainage ditch directly through this historic site. Construction of the plant would reportedly create up to 500 temporary jobs, and 50 permanent ones.

Figure 2. Aerial view of site preparation work at the New Fortress LNG plant site. Source: Ted Auch, FracTracker Alliance

The site plan for the new facility, developed in October 2018, includes large gas engines, a liquefaction facility, a hydrocarbon impoundment basin, LNG storage and pumps, a gas treatment facility, transformers, and tanker staging areas. Some features are sited within 500 feet of the railroad.

Figure 3. Proposed site plan of the New Fortress LNG facility in Wyalusing, Pennsylvania. Map by FracTracker Alliance.

An air quality plan for the New Fortress LNG facility was approved in July, 2019. Although construction was well underway starting in spring 2019, work is currently paused on the site. New Fortress has not indicated when work would resume, but expects the construction process to span two to 2.5 years.

Where to, after Wyalusing?

Without an adequate market for the gas in the United States, LNG is destined for shipping overseas in specially-designed LNG carrier ships. In 2018, according to US government data reported in rigzone.com:

“….28 countries in total received LNG exports during 2018. However, just ten countries accounted for 82 percent of the U.S. LNG direct tanker exports that year and the top four markets shared 187 shipments between them. South Korea, the top destination, received 73 cargoes in all, followed by Mexico with 53, Japan with 37 and lastly China with 24. Of the remainder, Jordan, Chile, India, Turkey, Spain, Argentina, and Brazil took only a small number of shipments each. In addition to the standard large shipments of LNG in dedicated tankers, small shipments of LNG in special containers known as ISOs were sent to the Bahamas and Barbados.”

Presently, plans are in the works for the construction of a new LNG export facility in Gibbstown, New Jersey, located just downstream from Philadelphia on the Delaware River. The Gibbstown site was formerly the home of Dupont Repauno Works, where dynamite was manufactured from 1880 to 1954. Later, the main products made there were commodity chemicals such as nitric acid. The proposed export terminal design includes two 43-foot-deep docks that would accommodate LNG tankers.

The advocacy organization “Empower NJ” provides a comprehensive description here of the proposed expansion of the deepwater LNG export terminal at Gibbstown. LNG delivered to the site would be stored in an old underground cavern previously used by Dupont. While dredging for a single dock at Gibbstown was approved by the Delaware River in 2019, new plans to build two more loading berths at a second dock are now under consideration.

Modes of transportation from Wyalusing to Gibbstown

In collaboration with Delaware Riverkeeper Network (DRN), FracTracker looked at potential overland routes for how the LNG produced in Wyalusing would reach the nearest export terminal in Gibbstown, New Jersey, a distance of 200 or more miles away.

While transportation by rail of liquefied natural gas had not been permitted by federal regulations, a significant change in rules occurred in June 2020. Under pressure from the current administration in Washington, DC, the Pipeline and Hazardous Materials Safety Administration (PHMSA) issued a final rule that authorized the bulk transportation of LNG by rail.

Plans on how to deliver the LNG from the plant in Wyalusing to the export terminal in Gibbstown, New Jersey have not been finalized, and could be by roadway or railway, or both. According to the Wilkes-Barre, Pennsylvania-based Citizen’s Voice:

In its assessment, PHMSA concluded that transporting LNG via roadways carries the same inherent risks as railways, but there is a higher likelihood of an accident because of the larger number of trucks needed compared to train cars.

The DOT-113 tank cars New Fortress received approval for can carry nearly 30,700 gallons of LNG — three times more than a single tanker truck. But, because train cars carry significantly more LNG and are transported together along railways, an incident “could lead to higher consequences,” according to the environmental assessment.

How much risk?

Because there is little to no precedent of transporting such high volumes of liquefied natural gas on roads or railroads, the extent of the disaster that could occur from a leak or crash is generally unknown. However, Delaware Riverkeeper has cited research warning about the unique characteristics of supercooled gas if it rapidly expands and spreads across terrain:

“….transport of LNG has unique safety hazards, exposing those along this particular rail route to unprecedented and unjustifiable risk. An LNG release boils furiously into a flammable vapor cloud 600 times larger than the storage container. An unignited ground-hugging vapor cloud can move far distances,[1]  and exposure to the vapor can cause extreme freeze burns. If in an enclosed space, it asphyxiates, causing death.1 If ignited, the fire is inextinguishable; the fire is so hot that second-degree burns can occur within 30 seconds for those exposed within a mile. An LNG release can cause a Boiling Liquid Expanding Vapor Explosion.[2]  The explosive force of LNG is similar to a thermobaric explosion – a catastrophically powerful bomb. The 2016 U.S. Emergency Response Guidebook advises fire chiefs initially to immediately evacuate the surrounding 1-mile area.[3]  No federal field research has shown how far the vapor cloud can move chiefs initially to immediately evacuate the surrounding 1-mile area.[4]  No federal field research has shown how far the vapor cloud can move…”

You can read Delaware Riverkeeper’s full statement of the organization’s opposition to the transportation of LNG in rail cars here.

Visualizing the routes

FracTracker mapped the most likely transport routes by road and by rail, along with demographic information (Figures 5 – 9). In collaboration with DRN, we also assessed minority and low-income population density along each route, using the Environmental Protection Agency (EPA)’s environmental justice (EJ) screening dataset, EJSCREEN. “Minority” as defined by the United States Census data used by EPA, refers to individuals who reported their race and ethnicity as something other than “non-Hispanic White” alone.

On average, around 21% of the population along the truck routes, and about 25% of the population along the train routes, is part of an EJ community. EJ communities are those that are disproportionately impacted by environmental hazards and with increased vulnerability to said hazards. Due to systemic racism, injustice, and poverty, EJ communities tend to have higher proportions of residents who are low-income and/or minorities.

  Total Population Minority Population Low-Income Population
Truck Route A 612,747 123,071 (20%) 122,830 (20%)
Truck Route B 929,236 207,924 (22%) 183,420 (20%)
Rail Route A 1,649,638 477,816 (29%) 392,577 (24%)
Rail Route B 1,947,544 479,500 (25%) 411,536 (21%)

Figure 4. Demographics of Environmental Justice (EJ) communities along New Fortress Energy’s liquified natural gas (LNG) transportation routes in the eastern United States.

Click here to view this map fullscreen, in its own window.

And click through the tabs below to see static images of the various routes.

Figure 5. Rail Route A passes within 2 miles of a population of 1,649,638. 29% (477,816 individuals) are minorities, and 24% (392,577 individuals) are low income, according to 2010 US Census data compiled by the Environmental Protection Agency as part of their EJSCREEN program. Map made by FracTracker Alliance and published by Delaware Riverkeeper Network.

Growing municipal and regulatory opposition to transport of LNG through communities

Municipal opposition against the plan to construct the LNG facility at Wyalusing is mounting. On Wednesday, September 2, 2020, the Borough Council of Clarks Summit, Pennsylvania (Lackawanna County) voted in opposition to the New Fortress Energy LNG project. Their resolution asked the Delaware River Basin Commission to vote to disapprove Dock 2, the cargo destination of the LNG trucks and trains that will be traversing Lackawanna County with their hazardous content.

And in most recent news, on September 10, the Delaware River Basin Commission (DRBC) voted to delay approving an application to expand the port facilities at Gibbstown, NJ that would have enabled LNG tankers to dock there. In this important turn of events, the representatives from New York, Delaware and New Jersey voted for the delay, while the Pennsylvania representative abstained, and the Federal representative from the US Army Corps of Engineers voted to deny it. The vote was preceded by a comment period in which the public expressed unanimous desire to stop the project, citing impacts to human and environmental health, as well as impacts from methane on climate catastrophe.

In the upcoming months, prior to when they meet again until December, the DRBC will more deeply consider the details of the application. Until that time, forward progress on the LNG plant and the export terminal is effectively halted.


8/24/21: This article was updated with the following information:

At their December meeting, the DRBC issued a final approval for construction of the terminal to move ahead, voting 4-0 in favor of the proposal, with the representative from New York State abstaining.

In conclusion

As communities start to consider the impacts to health and safety posed by massive fossil fuel infrastructure—whether that is pipelines, compressor stations, drilling operations, or rail and road transport—clean energy alternatives like solar, wind, and geothermal become the sensible option for all. We applaud the elected officials in Clarks Summit for their vote early this month, and look forward to more following suit.

To stay up to date on the regional pushback against LNG and engage your voice in resistance, learn more at protectnorthernpa.org or sign-up to become an E-activist with Delaware Riverkeeper Network.

By Karen Edelstein, Eastern Program Coordinator, FracTracker Alliance

Feature photo by Ted Auch, FracTracker Alliance, with aerial support by Lighthawk

[1] “Immediate ignition with liquid still on the ground could cause the spill to develop into a pool fire and present a radiant heat hazard. If there is no ignition source, the LNG will vaporize rapidly forming a cold gas cloud that is initially heavier than air, mixes with ambient air, spreads and is carried downwind.” P. 10 “Methane in vapor state can be an asphyxiant when it displaces oxygen in a confined space.” P. 11. SP 20534 Special Permit to transport LNG by rail in DOT-113C120W rail tank cars. Final Environmental Assessment. Docket No. PHMSA-2019-0100. December 5, 2019. P. 10.

[2] “LNG tank BLEVE is possible in some transportation scenarios.” Sandia National Laboratories, “LNG Use and Safety Concerns (LNG export facility, refueling stations, marine/barge/ferry/rail/truck transport)”, Tom Blanchat, Mike Hightower, Anay Luketa. November 2014. https://www.osti.gov/servlets/purl/1367739  P. 23.

[3] US DOT Emergency Response Guidebook. https://www.phmsa.dot.gov/hazmat/erg/emergency-response-guidebook-erg

[4] US DOT Emergency Response Guidebook. https://www.phmsa.dot.gov/hazmat/erg/emergency-response-guidebook-erg

Support this work

DONATE

Stay in the know

National Energy and Petrochemical Map

FracTracker Alliance has released a new national map, filled with energy and petrochemical data. Explore the map, continue reading to learn more, and see how your state measures up!

View Full Size Map | Updated 9/1/21 | Data Tutorial

This map has been updated since this blog post was originally published, and therefore statistics and figures below may no longer correspond with the map

The items on the map (followed by facility count in parenthesis) include:

         For oil and gas wells, view FracTracker’s state maps. 

This map is by no means exhaustive, but is exhausting. It takes a lot of infrastructure to meet the energy demands from industries, transportation, residents, and businesses – and the vast majority of these facilities are powered by fossil fuels. What can we learn about the state of our national energy ecosystem from visualizing this infrastructure? And with increasing urgency to decarbonize within the next one to three decades, how close are we to completely reengineering the way we make energy?

Key Takeaways

  • Natural gas accounts for 44% of electricity generation in the United States – more than any other source. Despite that, the cost per megawatt hour of electricity for renewable energy power plants is now cheaper than that of natural gas power plants.
  • The state generating the largest amount of solar energy is California, while wind energy is Texas. The state with the greatest relative solar energy is not technically a state – it’s D.C., where 18% of electricity generation is from solar, closely followed by Nevada at 17%. Iowa leads the country in relative wind energy production, at 45%.
  • The state generating the most amount of energy from both natural gas and coal is Texas. Relatively, West Virginia has the greatest reliance on coal for electricity (85%), and Rhode Island has the greatest percentage of natural gas (92%).
  • With 28% of total U.S. energy consumption for transportation, many of the refineries, crude oil and petroleum product pipelines, and terminals on this map are dedicated towards gasoline, diesel, and other fuel production.
  • Petrochemical production, which is expected to account for over a third of global oil demand growth by 2030, takes the form of chemical plants, ethylene crackers, and natural gas liquid pipelines on this map, largely concentrated in the Gulf Coast.

Electricity generation

The “power plant” legend item on this map contains facilities with an electric generating capacity of at least one megawatt, and includes independent power producers, electric utilities, commercial plants, and industrial plants. What does this data reveal?

National Map of Power plants

Power plants by energy source. Data from EIA.

In terms of the raw number of power plants – solar plants tops the list, with 2,916 facilities, followed by natural gas at 1,747.

In terms of megawatts of electricity generated, the picture is much different – with natural gas supplying the highest percentage of electricity (44%), much more than the second place source, which is coal at 21%, and far more than solar, which generates only 3% (Figure 1).

National Energy Sources Pie Chart

Figure 1. Electricity generation by source in the United States, 2019. Data from EIA.

This difference speaks to the decentralized nature of the solar industry, with more facilities producing less energy. At a glance, this may seem less efficient and more costly than the natural gas alternative, which has fewer plants producing more energy. But in reality, each of these natural gas plants depend on thousands of fracked wells – and they’re anything but efficient.Fracking's astronomical decline rates - after one year, a well may be producing less than one-fifth of the oil and gas it produced its first year. To keep up with production, operators must pump exponentially more water, chemicals, and sand, or just drill a new well.

The cost per megawatt hour of electricity for a renewable energy power plants is now cheaper than that of fracked gas power plants. A report by the Rocky Mountain Institute, found “even as clean energy costs continue to fall, utilities and other investors have announced plans for over $70 billion in new gas-fired power plant construction through 2025. RMI research finds that 90% of this proposed capacity is more costly than equivalent [clean energy portfolios, which consist of wind, solar, and energy storage technologies] and, if those plants are built anyway, they would be uneconomic to continue operating in 2035.”

The economics side with renewables – but with solar, wind, geothermal comprising only 12% of the energy pie, and hydropower at 7%, do renewables have the capacity to meet the nation’s energy needs? Yes! Even the Energy Information Administration, a notorious skeptic of renewable energy’s potential, forecasted renewables would beat out natural gas in terms of electricity generation by 2050 in their 2020 Annual Energy Outlook.

This prediction doesn’t take into account any future legislation limiting fossil fuel infrastructure. A ban on fracking or policies under a Green New Deal could push renewables into the lead much sooner than 2050.

In a void of national leadership on the transition to cleaner energy, a few states have bolstered their renewable portfolio.

How does your state generate electricity?
Legend

Figure 2. Electricity generation state-wide by source, 2019. Data from EIA.

One final factor to consider – the pie pieces on these state charts aren’t weighted equally, with some states’ capacity to generate electricity far greater than others.  The top five electricity producers are Texas, California, Florida, Pennsylvania, and Illinois.

Transportation

In 2018, approximately 28% of total U.S. energy consumption was for transportation. To understand the scale of infrastructure that serves this sector, it’s helpful to click on the petroleum refineries, crude oil rail terminals, and crude oil pipelines on the map.

Map of transportation infrastructure

Transportation Fuel Infrastructure. Data from EIA.

The majority of gasoline we use in our cars in the US is produced domestically. Crude oil from wells goes to refineries to be processed into products like diesel fuel and gasoline. Gasoline is taken by pipelines, tanker, rail, or barge to storage terminals (add the “petroleum product terminal” and “petroleum product pipelines” legend items), and then by truck to be further processed and delivered to gas stations.

The International Energy Agency predicts that demand for crude oil will reach a peak in 2030 due to a rise in electric vehicles, including busses.  Over 75% of the gasoline and diesel displacement by electric vehicles globally has come from electric buses.

China leads the world in this movement. In 2018, just over half of the world’s electric vehicles sales occurred in China. Analysts predict that the country’s oil demand will peak in the next five years thanks to battery-powered vehicles and high-speed rail.

In the United States, the percentage of electric vehicles on the road is small but growing quickly. Tax credits and incentives will be important for encouraging this transition. Almost half of the country’s electric vehicle sales are in California, where incentives are added to the federal tax credit. California also has a  “Zero Emission Vehicle” program, requiring electric vehicles to comprise a certain percentage of sales.

We can’t ignore where electric vehicles are sourcing their power – and for that we must go back up to the electricity generation section. If you’re charging your car in a state powered mainly by fossil fuels (as many are), then the electricity is still tied to fossil fuels.

Petrochemicals

Many of the oil and gas infrastructure on the map doesn’t go towards energy at all, but rather aids in manufacturing petrochemicals – the basis of products like plastic, fertilizer, solvents, detergents, and resins.

This industry is largely concentrated in Texas and Louisiana but rapidly expanding in Pennsylvania, Ohio, and West Virginia.

On this map, key petrochemical facilities include natural gas plants, chemical plants, ethane crackers, and natural gas liquid pipelines.

Map of Petrochemical Infrastructure

Petrochemical infrastructure. Data from EIA.

Natural gas processing plants separate components of the natural gas stream to extract natural gas liquids like ethane and propane – which are transported through the natural gas liquid pipelines. These natural gas liquids are key building blocks of the petrochemical industry.

Ethane crackers process natural gas liquids into polyethylene – the most common type of plastic.

The chemical plants on this map include petrochemical production plants and ammonia manufacturing. Ammonia, which is used in fertilizer production, is one of the top synthetic chemicals produced in the world, and most of it comes from steam reforming natural gas.

As we discuss ways to decarbonize the country, petrochemicals must be a major focus of our efforts. That’s because petrochemicals are expected to account for over a third of global oil demand growth by 2030 and nearly half of demand growth by 2050 – thanks largely to an increase in plastic production. The International Energy Agency calls petrochemicals a “blind spot” in the global energy debate.

Petrochemical infrastructure

Petrochemical development off the coast of Texas, November 2019. Photo by Ted Auch, aerial support provided by LightHawk.

Investing in plastic manufacturing is the fossil fuel industry’s strategy to remain relevant in a renewable energy world. As such, we can’t break up with fossil fuels without also giving up our reliance on plastic. Legislation like the Break Free From Plastic Pollution Act get to the heart of this issue, by pausing construction of new ethane crackers, ensuring the power of local governments to enact plastic bans, and phasing out certain single-use products.

“The greatest industrial challenge the world has ever faced”

Mapped out, this web of fossil fuel infrastructure seems like a permanent grid locking us into a carbon-intensive future. But even more overwhelming than the ubiquity of fossil fuels in the US is how quickly this infrastructure has all been built. Everything on this map was constructed since Industrial Revolution, and the vast majority in the last century (Figure 3) – an inch on the mile-long timeline of human civilization.

Figure 3. Global Fossil Fuel Consumption. Data from Vaclav Smil (2017)

In fact, over half of the carbon from burning fossil fuels has been released in the last 30 years. As David Wallace Wells writes in The Uninhabitable Earth, “we have done as much damage to the fate of the planet and its ability to sustain human life and civilization since Al Gore published his first book on climate than in all the centuries—all the millennia—that came before.”

What will this map look like in the next 30 years?

A recent report on the global economics of the oil industry states, “To phase out petroleum products (and fossil fuels in general), the entire global industrial ecosystem will need to be reengineered, retooled and fundamentally rebuilt…This will be perhaps the greatest industrial challenge the world has ever faced historically.”

Is it possible to build a decentralized energy grid, generated by a diverse array of renewable, local, natural resources and backed up by battery power? Could all communities have the opportunity to control their energy through member-owned cooperatives instead of profit-thirsty corporations? Could microgrids improve the resiliency of our system in the face of increasingly intense natural disasters and ensure power in remote regions? Could hydrogen provide power for energy-intensive industries like steel and iron production? Could high speed rail, electric vehicles, a robust public transportation network and bike-able cities negate the need for gasoline and diesel? Could traditional methods of farming reduce our dependency on oil and gas-based fertilizers? Could  zero waste cities stop our reliance on single-use plastic?

Of course! Technology evolves at lightning speed. Thirty years ago we didn’t know what fracking was and we didn’t have smart phones. The greater challenge lies in breaking the fossil fuel industry’s hold on our political system and convincing our leaders that human health and the environment shouldn’t be externalized costs of economic growth.

Support this work

DONATE

Stay in the know

Release: The 2019 You Are Here map launches, showing New York’s hurdles to climate leadership

For Immediate Release

Contact: Lee Ziesche, lee@saneenergyproject.org, 954-415-6282

Interactive Map Shows Expansion of Fracked Gas Infrastructure in New York State

And showcases powerful community resistance to it

New York, NY – A little over a year after 55 New Yorkers were arrested outside of Governor Cuomo’s door calling on him to be a true climate leader and halt the expansion of fracked gas infrastructure in New York State, grassroots advocates Sane Energy Project re-launched the You Are Here (YAH) map, an interactive map that shows an expanding system of fracked infrastructure approved by the Governor.

“When Governor Cuomo announced New York’s climate goals in early 2019, it’s clear there is no room for more extractive energy, like fossil fuels.” said Kim Fraczek, Director of Sane Energy Project, “Yet, I look at the You Are Here Map, and I see a web of fracked gas pipelines and power plants trapping communities, poisoning our water, and contributing to climate change.”

Sane Energy originally launched the YAH map in 2014 on the eve of the historic People’s Climate March, and since then, has been working with communities that resist fracked gas infrastructure to update the map and tell their stories.

“If you read the paper, you might think Governor Cuomo is a climate leader, but one look at the YAH Map and you know that isn’t true. Communities across the state are living with the risks of Governor Cuomo’s unprecedented buildout of fracked gas infrastructure,” said Courtney Williams, a mother of two young children living within 400 feet of the AIM fracked gas pipeline. “The Governor has done nothing to address the risks posed by the “Algonquin” Pipeline running under Indian Point Nuclear Power Plant. That is the center of a bullseye that puts 20 million people in danger.”

Fracked gas infrastructure poses many of the same health risks as fracking and the YAH map exposes a major hypocrisy when it comes to Governor Cuomo’s environmental credentials. The Governor has promised a Green New Deal for New York, but climate science has found the expansion of fracking and fracked gas infrastructure is increasing greenhouse gas emissions in the United States.

“The YAH map has been an invaluable organizing tool. The mothers I work with see the map and instantly understand how they are connected across geography and they feel less alone. This solidarity among mothers is how we build our power ,” said Lisa Marshall who began organizing with Mothers Out Front to oppose the expansion of the Dominion fracked gas pipeline in the Southern Tier and a compressor station built near her home in Horseheads, New York. “One look at the map and it’s obvious that Governor Cuomo hasn’t done enough to preserve a livable climate for our children.”

“Community resistance beat fracking and the Constitution Pipeline in our area,” said Kate O’Donnell  of Concerned Citizens of Oneonta and Compressor Free Franklin. “Yet smaller, lesser known infrastructure like bomb trucks and a proposed gas decompressor station and 25 % increase in gas supply still threaten our communities.”

The YAH map was built in partnership with FracTracker, a non-profit that shares maps, images, data, and analysis related to the oil and gas industry hoping that a better informed public will be able to make better informed decisions regarding the world’s energy future.

“It has been a privilege to collaborate with Sane Energy Project to bring our different expertise to visualizing the extent of the destruction from the fossil fuel industry. We look forward to moving these detrimental projects to the WINS layer, as communities organize together to take control of their energy future. Only then, can we see a true expansion of renewable energy and sustainable communities,” said Karen Edelstein, Eastern Program Coordinator at Fractracker Alliance.

Throughout May and June Sane Energy Project and 350.org will be traveling across the state on the ‘Sit, Stand Sing’ tour to communities featured on the map to hold trainings on nonviolent direct action and building organizing skills that connect together the communities of resistance.

“Resistance to fracking infrastructure always starts with small, volunteer led community groups,” said Lee Ziesche, Sane Energy Community Engagement Coordinator. “When these fracked gas projects come to town they’re up against one of the most powerful industries in the world. The You Are Here Map and ‘Sit, Stand Sing’ tour will connect these fights and help build the power we need to stop the harm and make a just transition to community owned renewable energy.”

Colonial Pipeline and site of Sept 2016 leak in Alabama

A Proper Picture of the Colonial Pipeline’s Past

On September 9, 2016 a pipeline leak was detected from the Colonial Pipeline by a mine inspector in Shelby County, Alabama. It is estimated to have spilled ~336,000 gallons of gasoline, resulting in the shutdown of a major part of America’s gasoline distribution system. As such, we thought it timely to provide some data and a map on the Colonial Pipeline Project.

Figure 1. Dynamic map of Colonial Pipeline route and related infrastructure

View Map Fullscreen | How Our Maps Work | The Sept. 2016 leak occurred in Shelby County, Alabama

Pipeline History

The Colonial Pipeline was built in 1963, with some segments dating back to at least 1954. Colonial carries gasoline and other refined petroleum projects throughout the South and Eastern U.S. – originating at Houston, Texas and terminating at the Port of New York and New Jersey. This ~5,000-mile pipeline travels through 12 states and the Gulf of Mexico at one point. According to available data, prior to the September 2016 incident for which the cause is still not known, roughly 113,382 gallons had been released from the Colonial Pipeline in 125 separate incidents since 2010 (Table 1).

Table 1. Reported Colonial Pipeline incident impacts by state, between 3/24/10 and 7/25/16

State Incidents (#) Barrels* Released Total Cost ($)
AL 10 91.49 2,718,683
GA 11 132.38 1,283,406
LA 23 86.05 1,002,379
MD 6 4.43 27,862
MS 6 27.36 299,738
NC 15 382.76 3,453,298
NJ 7 7.81 255,124
NY 2 27.71 88,426
PA 1 0.88 28,075
SC 9 1639.26 4,779,536
TN 2 90.2 1,326,300
TX 19 74.34 1,398,513
VA 14 134.89 15,153,471
Total** 125 2699.56 31,814,811
*1 Barrel = 42 U.S. Gallons

** The total amount of petroleum products spilled from the Colonial Pipeline in this time frame equates to roughly 113,382 gallons. This figure does not include the September 2016 spill of ~336,000 gallons.

Data source: PHMSA

Unfortunately, the Colonial Pipeline has also been the source of South Carolina’s largest pipeline spill. The incident occurred in 1996 near Fork Shoals, South Carolina and spilled nearly 1 million gallons of fuel into the Reedy River. The September 2016 spill has not reached any major waterways or protected ecological areas, to-date.

Additional Details

Owners of the pipeline include Koch Industries, South Korea’s National Pension Service and Kohlberg Kravis Roberts, Caisse de dépôt et placement du Québec, Royal Dutch Shell, and Industry Funds Management.

For more details about the Colonial Pipeline, see Table 2.

Table 2. Specifications of the Colonial and/or Intercontinental pipeline

Pipeline Segments 1,1118
Mileage (mi.)
Avg. Length 4.3
Max. Length 206
Total Length 4,774
Segment Flow Direction (# Segments)
Null 657
East 33
North 59
Northeast 202
Northwest 68
South 20
Southeast 30
Southwest 14
West 35
Segment Bi-Directional (# Segments)
Null 643
No 429
Yes 46
Segment Location
State Number Total Mileage Avg. Mileage Long Avg. PSI Avg. Diameter (in.)
Alabama 11 782 71 206 794 35
Georgia 8 266 33 75 772 27
Gulf of Mexico 437 522 1.2 77 50 1.4
Louisiana 189 737 3.9 27 413 11
Maryland 11 68 6.2 9 781 30
Mississippi 63 56 0.9 15 784 29
North Carolina 13 146 11.2 23 812 27
New Jersey 65 314 4.8 28 785 28
New York 2 6.4 3.2 6.4 800 26
Pennsylvania 72 415 5.8 17 925 22
South Carolina 6 119 19.9 55 783 28
Texas 209 1,004 4.8 33 429 10
Virginia 32 340 10.6 22 795 27
PSI = Pounds per square inch (pressure)

Data source: US EIA


By Sam Rubright, Ted Auch, and Matt Kelso – FracTracker Alliance

Pilgrim Pipelines proposal & community actions

Controversial 178-mile-long parallel pipelines proposed for NY’s Hudson Valley/Northern NJ

By Karen Edelstein, Eastern Program Coordinator

Over the past seven years, there has been a very strong upswing in domestic oil production coming from Bakken Formation in North Dakota. Extraction rates increased over 700% between November 2007 and November 2015, to over 1.2 million barrels per day. With all this oil coming out of the North Dakota oil fields, the challenge is how to get that oil to port, and to refineries. For the large part, the method of choice has been to move the oil by rail. Annual shipments out of North Dakota have jumped from 9500 carloads in 2008 to close to a half million carloads by 2013.

Nearly 25% of oil leaving the Bakken Formation is destined for east coast refineries located in New Jersey, Philadelphia, and Delaware. Trains carrying the crude enter New York State along two routes. A southern route, passes through Minneapolis, Chicago, Cleveland, and Buffalo, and on to Albany. A northern route, which originates in the oil fields of southern Manitoba and Saskatchewan Provinces in Canada, passes through Toronto, Montreal, and then south to Albany.

Currently, once the oil reaches Albany, it is transported south through the Hudson Valley, either by barge or by train. Two “unit trains” per day, each carrying 3 million gallons in 125-tank car trains, are bound for Philadelphia-area refineries. In addition, a barge per day, carrying 4 million gallons, heads to New Jersey refineries. Environmental groups in New York’s Hudson Valley, including Hudson RiverKeeper, have registered alarm and opposition about the potential impacts and risks of the transport of this process poses to the safety of residents of the Hudson Valley, and to the health of the Hudson River. More background information is available in this Pilgrim Pipelines 101 webinar.

What are the Pilgrim Pipelines?

The proposed Pilgrim Pipelines are two parallel 18-24-inch pipelines that would run from the Port of Albany to Linden, NJ, alongside the New York State Thruway (I-87) for 170 miles just to the west of the Hudson River, with nearly 80% of the pipeline within the public right-of-way. The rest of the pipeline would traverse private property and some utility areas.

The pipeline running south from Albany would carry the light, explosive crude to refineries in NJ, Philadelphia, and Delaware. After the oil is refined, the North-bound pipeline would carry the oil back to Albany, moving 200,000 barrels (8.4 million gallons) of oil in each direction, every day. Touted by Pilgrim Pipeline Holdings, LLC as a central component in “stabilization of the East Coast oil infrastructure,” the project proposes to:

provide the Northeast region of the United States with a more stable supply of essential refined petroleum products… and… provide the region with a safer and more environmentally friendly method of transporting oil and petroleum products.

The Controversy

The Pilgrim company is lead by two individuals with deep ties to the energy industry. Both the company president, Errol B. Boyles, as well as vice-president, Roger L. Williams, were in the upper echelon management of Wichita, Kansas-based Koch Industries.

Proponents of the project claim that it includes environmental benefits, such as 20% lower greenhouse gas emissions than would be generated moving the same quantity of oil via barge, and even claim that the proposed Pilgrim Pipelines “will produce a net air quality benefit to the region.” Of course, this argument is predicated on the belief that the unbridled oil extraction from the Bakken Formation is both environmentally desirable, and nationally required.

Economic benefits described by the pipeline company include the faster rate the petroleum products can be pumped through existing terminals in New York, and also meet a hoped-for demand surge for petroleum products. Naturally, the company would also create some construction jobs (albeit somewhat temporary and for out-of-state firms), and increase fuel available to consumers at lower prices because of proposed transportation savings. However, the Albany Business Review indicated that the pipeline could actually create a net loss of jobs if the pipeline were to make the Port of Albany less active as a shipping location.

Project opponents cite both short- and long-term impacts of the project on human and environmental health, the local and regional economy, property values, nearly a dozen threatened and endangered wildlife species, water quality, ecology of the pristine Hudson Highlands Region, and contributions that the project invariably makes to accelerating climate change, both through local impacts, and as an infrastructure component supporting the extraction of crude from the East Coast all the way to the Bakken Fields of North Dakota. Groups also cite the high rate of “non-technical” pipeline failures, due to excavation damage, natural force damage, and incorrect operation.

Communities in Action

Close to 60 municipalities along the pipeline route have passed local resolutions and ordinances expressing their opposition to the pipeline. Residents assert that the local communities would bear most of the risks, and few, if any, of the benefits associated with the Pilgrim Pipeline. These communities, represented by over a million people in New York and New Jersey, are shown in the map below. Other groups – including the New Jersey State Assembly and Senate, numerous county boards in both New York and New Jersey, and several school districts – have also passed resolutions opposing the project.

Access links to the resolution documents for individual towns by clicking on the town location in the map below.


View full screen map | How to work with our maps

Decision Makers in Question

The New York State Thruway Authority was initially the sole lead agency on the State Environmental Quality Review (SEQR) of the project, a decision that was decried by impacted municipalities, environmental groups, and the Ramapough Lenape Nation. Dwain Perry, Ramapough Lenape chief, urged that the New York State Department of Environmental Conservation be the lead agency, instead, saying:

…DEC has a much more thorough outlook into different things that can happen….[and]..is looking out for everyone’s interest.

However, in a development announced in late December 2015, the New York State Department of Environmental Conservation revealed that they, along with the NYS Thruway Authority, would jointly lead the environmental review of the project. This decision has perplexed many groups involved in the debate, and environmental groups such as Scenic Hudson, Environmental Advocates of New York, Hudson Riverkeeper, and Coalition Against the Pilgrim Pipeline expressed their dismay over this choice, and urged that the SEQR review address whether the project will be consistent with NY Governor Cuomo’s aggressive goals to reduce carbon emissions that are driving climate disruption.

DEC’s own guidelines advise against creating co-lead agencies in projects particularly because there is no prescribed process for resolution of disputes between two such agencies. Nonetheless, a DEC spokesperson, Sean Mahar, tried to assure critics that because the two lead agencies have “unique and distinct expertise” few problems would arise.

We’ll post updates as the project’s SEQR process gets underway.

Resources

Pilgrim Pipelines 101 webinar, presented by Kate Hudson (Riverkeeper) and Jennifer Metzger (Rosendale Town Board)

Tag Archive for: New Jersey

New Jersey Shale Viewer

New Jersey