FracTracker Alliance has released a new national map, filled with energy and petrochemical data. Explore the map, continue reading to learn more, and see how your state measures up!
This map has been updated since this blog post was originally published, and therefore statistics and figures below may no longer correspond with the map
The items on the map (followed by facility count in parenthesis) include:
For oil and gas wells, view FracTracker’s state maps.
Transportation & Storage
Natural gas compressor stations (1,367) – Facilities built along a pipeline route that pressurize natural gas to keep it flowing through the pipeline.
Crude oil rail terminals (94) – Rail terminals that load and unload crude oil (liquid hydrocarbons that have yet to be processed into higher-value petroleum products).
Liquefied natural gas import/export terminals (8) – Facilities that can a) liquefy natural gas so it can be exported as LNG (liquefied natural gas) and/or b) re-gasify LNG so it can be used as natural gas. Natural gas is transported in a liquid state because it takes up less space as a liquid than as a gas.
Natural Gas Underground Storage (486) – Locations where natural gas is stored underground in aquifers, depleted gas fields, and salt formations.
Petroleum Product Terminals (1,484) – Terminals with a storage capacity of 50,000 barrels or more and/or the ability to receive volumes from tanker, barge, or pipeline. Petroleum products include products “produced from the processing of crude oil and other liquids at petroleum refineries, from extraction of liquid hydrocarbons at natural gas processing plants, and from production of finished petroleum products at blending facilities.”
Petroleum Ports (242) – A port that can import and/or export 200,000 or more short tons of petroleum products a year.
Natural gas import/export pipeline facility (54) – A facility where natural gas crosses the border of the continental United States.
Pipelines
Crude oil pipelines – major crude oil pipelines, including interstate truck lines and selected intrastate lines, but not including gathering lines.
Natural gas liquid pipelines – Also referred to as hydrocarbon gas liquid pipelines, they carry the heavier components of the natural gas stream which are liquid under intense pressure and extreme cold, but gas in normal conditions.
Natural gas pipelines– Interstate and intrastate natural gas pipelines. Due to the immensity of this pipeline network and lack of available data, this pipeline layer in particular varies in degree of accuracy.
Petroleum Product Pipelines – Major petroleum product pipelines.
Recent Pipeline Projects – Pipeline projects that have been announced since 2017. This includes projects in various stages, including under construction, complete, planned or canceled. Click on the pipeline for the status.
Processing & Downstream
Natural Gas Processing Plants (478) – Plants that separate impurities and components of the natural gas stream.
Chemical plants (36) – Includes two types of chemical plants – petrochemical production and ammonia manufacturing – that report to EPA’s Greenhouse Gas Reporting Program.
Ethylene Crackers (30) – Also referred to as ethane crackers, these petrochemical complexes that converts ethane (a natural gas liquid) into ethylene. Ethylene is used to make products like polyethylene plastic.
Petroleum Refineries (135) – A plant that processes crude oil into products like petroleum naphtha, diesel fuel, and gasoline.
Power Plants (9,414) – Electric generating plants with a capacity of at least one megawatt, sorted by energy source.
Wind Turbines (63,003) – Zoom in on wind power plants to see this legend item appear.
Natural Resources
Shale Plays (45) – Tight oil and gas shale plays, which are formations where oil and gas can be extracted.
Major Rivers
Solar Energy Potential – Potential solar energy generation, in kilowatt-hours per square meter per day – averaged annually.
This map is by no means exhaustive, but is exhausting. It takes a lot of infrastructure to meet the energy demands from industries, transportation, residents, and businesses – and the vast majority of these facilities are powered by fossil fuels. What can we learn about the state of our national energy ecosystem from visualizing this infrastructure? And with increasing urgency to decarbonize within the next one to three decades, how close are we to completely reengineering the way we make energy?
Key Takeaways
Natural gas accounts for 44% of electricity generation in the United States – more than any other source. Despite that, the cost per megawatt hour of electricity for renewable energy power plants is now cheaper than that of natural gas power plants.
The state generating the largest amount of solar energy is California, while wind energy is Texas. The state with the greatest relative solar energy is not technically a state – it’s D.C., where 18% of electricity generation is from solar, closely followed by Nevada at 17%. Iowa leads the country in relative wind energy production, at 45%.
The state generating the most amount of energy from both natural gas and coal is Texas. Relatively, West Virginia has the greatest reliance on coal for electricity (85%), and Rhode Island has the greatest percentage of natural gas (92%).
With 28% of total U.S. energy consumption for transportation, many of the refineries, crude oil and petroleum product pipelines, and terminals on this map are dedicated towards gasoline, diesel, and other fuel production.
Petrochemical production, which is expected to account for over a third of global oil demand growth by 2030, takes the form of chemical plants, ethylene crackers, and natural gas liquid pipelines on this map, largely concentrated in the Gulf Coast.
Electricity generation
The “power plant” legend item on this map contains facilities with an electric generating capacity of at least one megawatt, and includes independent power producers, electric utilities, commercial plants, and industrial plants. What does this data reveal?
In terms of the raw number of power plants – solar plants tops the list, with 2,916 facilities, followed by natural gas at 1,747.
In terms of megawatts of electricity generated, the picture is much different – with natural gas supplying the highest percentage of electricity (44%), much more than the second place source, which is coal at 21%, and far more than solar, which generates only 3% (Figure 1).
Figure 1. Electricity generation by source in the United States, 2019. Data from EIA.
This difference speaks to the decentralized nature of the solar industry, with more facilities producing less energy. At a glance, this may seem less efficient and more costly than the natural gas alternative, which has fewer plants producing more energy. But in reality, each of these natural gas plants depend on thousands of fracked wells – and they’re anything but efficient.
The cost per megawatt hour of electricity for a renewable energy power plants is now cheaper than that of fracked gas power plants. A report by the Rocky Mountain Institute, found “even as clean energy costs continue to fall, utilities and other investors have announced plans for over $70 billion in new gas-fired power plant construction through 2025. RMI research finds that 90% of this proposed capacity is more costly than equivalent [clean energy portfolios, which consist of wind, solar, and energy storage technologies] and, if those plants are built anyway, they would be uneconomic to continue operating in 2035.”
The economics side with renewables – but with solar, wind, geothermal comprising only 12% of the energy pie, and hydropower at 7%, do renewables have the capacity to meet the nation’s energy needs? Yes! Even the Energy Information Administration, a notorious skeptic of renewable energy’s potential, forecasted renewables would beat out natural gas in terms of electricity generation by 2050 in their 2020 Annual Energy Outlook.
This prediction doesn’t take into account any future legislation limiting fossil fuel infrastructure. A ban on fracking or policies under a Green New Deal could push renewables into the lead much sooner than 2050.
In a void of national leadership on the transition to cleaner energy, a few states have bolstered their renewable portfolio.
Figure 2. Electricity generation state-wide by source, 2019. Data from EIA.
One final factor to consider – the pie pieces on these state charts aren’t weighted equally, with some states’ capacity to generate electricity far greater than others. The top five electricity producers are Texas, California, Florida, Pennsylvania, and Illinois.
Transportation
In 2018, approximately 28% of total U.S. energy consumption was for transportation. To understand the scale of infrastructure that serves this sector, it’s helpful to click on the petroleum refineries, crude oil rail terminals, and crude oil pipelines on the map.
Transportation Fuel Infrastructure. Data from EIA.
The majority of gasoline we use in our cars in the US is produced domestically. Crude oil from wells goes to refineries to be processed into products like diesel fuel and gasoline. Gasoline is taken by pipelines, tanker, rail, or barge to storage terminals (add the “petroleum product terminal” and “petroleum product pipelines” legend items), and then by truck to be further processed and delivered to gas stations.
China leads the world in this movement. In 2018, just over half of the world’s electric vehicles sales occurred in China. Analysts predict that the country’s oil demand will peak in the next five years thanks to battery-powered vehicles and high-speed rail.
In the United States, the percentage of electric vehicles on the road is small but growing quickly. Tax credits and incentives will be important for encouraging this transition. Almost half of the country’s electric vehicle sales are in California, where incentives are added to the federal tax credit. California also has a “Zero Emission Vehicle” program, requiring electric vehicles to comprise a certain percentage of sales.
We can’t ignore where electric vehicles are sourcing their power – and for that we must go back up to the electricity generation section. If you’re charging your car in a state powered mainly by fossil fuels (as many are), then the electricity is still tied to fossil fuels.
Petrochemicals
Many of the oil and gas infrastructure on the map doesn’t go towards energy at all, but rather aids in manufacturing petrochemicals – the basis of products like plastic, fertilizer, solvents, detergents, and resins.
Natural gas processing plants separate components of the natural gas stream to extract natural gas liquids like ethane and propane – which are transported through the natural gas liquid pipelines. These natural gas liquids are key building blocks of the petrochemical industry.
Ethane crackers process natural gas liquids into polyethylene – the most common type of plastic.
The chemical plants on this map include petrochemical production plants and ammonia manufacturing. Ammonia, which is used in fertilizer production, is one of the top synthetic chemicals produced in the world, and most of it comes from steam reforming natural gas.
As we discuss ways to decarbonize the country, petrochemicals must be a major focus of our efforts. That’s because petrochemicals are expected to account for over a third of global oil demand growth by 2030 and nearly half of demand growth by 2050 – thanks largely to an increase in plastic production. The International Energy Agency calls petrochemicals a “blind spot” in the global energy debate.
Petrochemical development off the coast of Texas, November 2019. Photo by Ted Auch, aerial support provided by LightHawk.
Investing in plastic manufacturing is the fossil fuel industry’s strategy to remain relevant in a renewable energy world. As such, we can’t break up with fossil fuels without also giving up our reliance on plastic. Legislation like the Break Free From Plastic Pollution Act get to the heart of this issue, by pausing construction of new ethane crackers, ensuring the power of local governments to enact plastic bans, and phasing out certain single-use products.
“The greatest industrial challenge the world has ever faced”
Mapped out, this web of fossil fuel infrastructure seems like a permanent grid locking us into a carbon-intensive future. But even more overwhelming than the ubiquity of fossil fuels in the US is how quickly this infrastructure has all been built. Everything on this map was constructed since Industrial Revolution, and the vast majority in the last century (Figure 3) – an inch on the mile-long timeline of human civilization.
Figure 3. Global Fossil Fuel Consumption. Data from Vaclav Smil (2017)
In fact, over half of the carbon from burning fossil fuels has been released in the last 30 years. As David Wallace Wells writes in The Uninhabitable Earth, “we have done as much damage to the fate of the planet and its ability to sustain human life and civilization since Al Gore published his first book on climate than in all the centuries—all the millennia—that came before.”
What will this map look like in the next 30 years?
A recent report on the global economics of the oil industry states, “To phase out petroleum products (and fossil fuels in general), the entire global industrial ecosystem will need to be reengineered, retooled and fundamentally rebuilt…This will be perhaps the greatest industrial challenge the world has ever faced historically.”
Is it possible to build a decentralized energy grid, generated by a diverse array of renewable, local, natural resources and backed up by battery power? Could all communities have the opportunity to control their energy through member-owned cooperatives instead of profit-thirsty corporations? Could microgrids improve the resiliency of our system in the face of increasingly intense natural disasters and ensure power in remote regions? Could hydrogen provide power for energy-intensive industries like steel and iron production? Could high speed rail, electric vehicles, a robust public transportation network and bike-able cities negate the need for gasoline and diesel? Could traditional methods of farming reduce our dependency on oil and gas-based fertilizers? Could zero waste cities stop our reliance on single-use plastic?
Of course! Technology evolves at lightning speed. Thirty years ago we didn’t know what fracking was and we didn’t have smart phones. The greater challenge lies in breaking the fossil fuel industry’s hold on our political system and convincing our leaders that human health and the environment shouldn’t be externalized costs of economic growth.
https://www.fractracker.org/a5ej20sjfwe/wp-content/uploads/2020/02/National-map-feature-3.png400900Erica Jacksonhttps://www.fractracker.org/a5ej20sjfwe/wp-content/uploads/2025/09/2025-Wordmark-Logo.pngErica Jackson2020-02-28 17:35:142022-05-02 15:21:42National Energy and Petrochemical Map
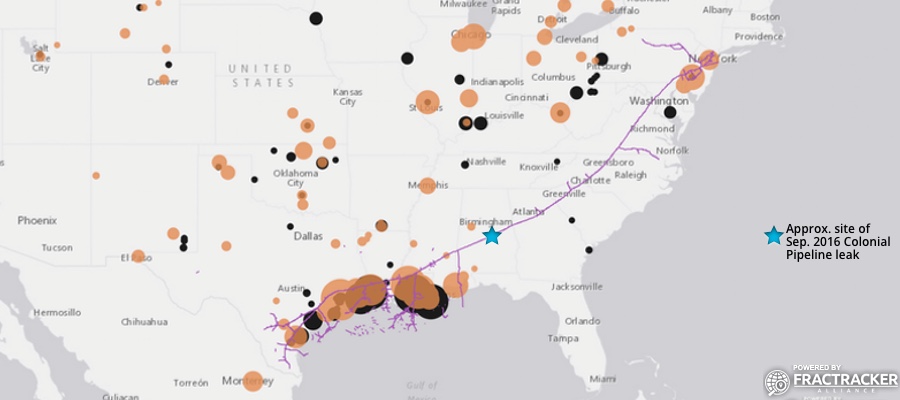
On September 9, 2016 a pipeline leak was detected from the Colonial Pipeline by a mine inspector in Shelby County, Alabama. It is estimated to have spilled ~336,000 gallons of gasoline, resulting in the shutdown of a major part of America’s gasoline distribution system. As such, we thought it timely to provide some data and a map on the Colonial Pipeline Project.
Figure 1. Dynamic map of Colonial Pipeline route and related infrastructure
The Colonial Pipeline was built in 1963, with some segments dating back to at least 1954. Colonial carries gasoline and other refined petroleum projects throughout the South and Eastern U.S. – originating at Houston, Texas and terminating at the Port of New York and New Jersey. This ~5,000-mile pipeline travels through 12 states and the Gulf of Mexico at one point. According to available data, prior to the September 2016 incident for which the cause is still not known, roughly 113,382 gallons had been released from the Colonial Pipeline in 125 separate incidents since 2010 (Table 1).
Table 1. Reported Colonial Pipeline incident impacts by state, between 3/24/10 and 7/25/16
State
Incidents (#)
Barrels* Released
Total Cost ($)
AL
10
91.49
2,718,683
GA
11
132.38
1,283,406
LA
23
86.05
1,002,379
MD
6
4.43
27,862
MS
6
27.36
299,738
NC
15
382.76
3,453,298
NJ
7
7.81
255,124
NY
2
27.71
88,426
PA
1
0.88
28,075
SC
9
1639.26
4,779,536
TN
2
90.2
1,326,300
TX
19
74.34
1,398,513
VA
14
134.89
15,153,471
Total**
125
2699.56
31,814,811
*1 Barrel = 42 U.S. Gallons
** The total amount of petroleum products spilled from the Colonial Pipeline in this time frame equates to roughly 113,382 gallons. This figure does not include the September 2016 spill of ~336,000 gallons.
Unfortunately, the Colonial Pipeline has also been the source of South Carolina’s largest pipeline spill. The incident occurred in 1996 near Fork Shoals, South Carolina and spilled nearly 1 million gallons of fuel into the Reedy River. The September 2016 spill has not reached any major waterways or protected ecological areas, to-date.
Additional Details
Owners of the pipeline include Koch Industries, South Korea’s National Pension Service and Kohlberg Kravis Roberts, Caisse de dépôt et placement du Québec, Royal Dutch Shell, and Industry Funds Management.
For more details about the Colonial Pipeline, see Table 2.
Table 2. Specifications of the Colonial and/or Intercontinental pipeline
https://www.fractracker.org/a5ej20sjfwe/wp-content/uploads/2016/09/ColonialPipeline-Feature.jpg400900FracTracker Alliancehttps://www.fractracker.org/a5ej20sjfwe/wp-content/uploads/2025/09/2025-Wordmark-Logo.pngFracTracker Alliance2016-09-26 13:35:032021-04-15 15:04:25A Proper Picture of the Colonial Pipeline’s Past
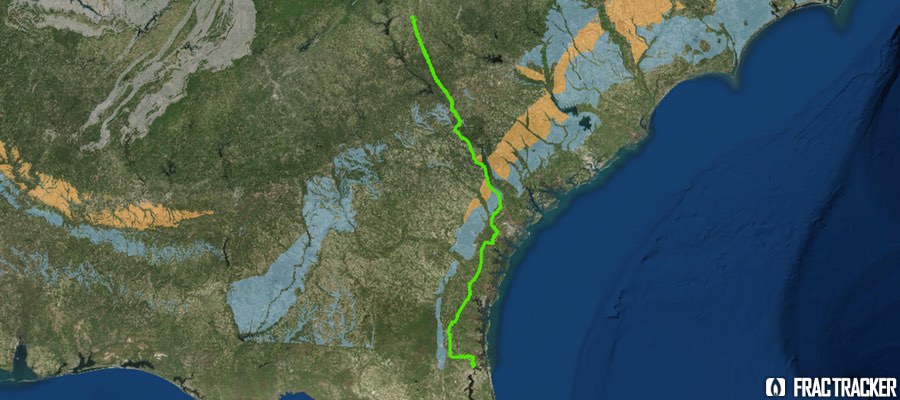
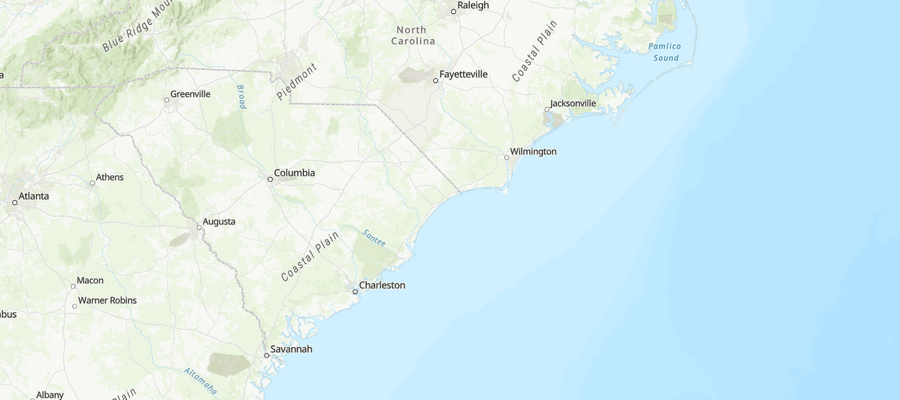
Asserting that the proposed Palmetto Pipeline is essential to supply gas and diesel to the residents of south Georgia and northern Florida, Houston-based energy giant Kinder Morgan has found themselves in the crosshairs of yet another battle. Connecting to the existing Plantation Pipeline, the proposed $1 billion Palmetto Pipeline would run from Belton, SC to terminals in Augusta, SC; Richmond Hill, GA; and Jacksonville, FL, a distance of 360+ miles. Along that corridor currently, gasoline is delivered from inland terminals to ports via trucking companies rather than by pipeline.
In order for the pipeline to be built through Georgia, agreements for a pipeline right-of-way would need to be sealed with 396 private landowners, and the land owned by these private citizens constitutes 92% of the route of the pipeline through the state. According to Kinder Morgan, however, 80% of the pipeline would be build next to (although not within) existing rights-of way for powerlines, pipelines, railroads, and roadways.
Kinder Morgan asserts that the Palmetto Pipeline would create 28 permanent jobs in Georgia. However, opponents of the pipeline measure the flip-side of economic impacts, with more than 250 jobs lost for coastal Georgia truckers, port workers, and Merchant Marines, as a result of changing the transportation medium for the petroleum to pipeline from truck.
The proposed pipeline would carry 167,000 barrels a day of refined petroleum – crossing the Savannah River, four other major watersheds in Georgia (Ogeechee, Altamaha, Satilla, and St. Mary’s), the upper reaches of the Okefenokee watershed, and countless freshwater, tidal, and brackish wetlands. These aquatic and terrestrial ecosystems through which the pipeline would pass are home to diverse numbers of rare and endangered species, as well as sportfish and notable forest habitats. Much of the area is underlain by extensive karst rock deposits, and as such, is especially at risk for groundwater contamination.
Pipeline Push Back
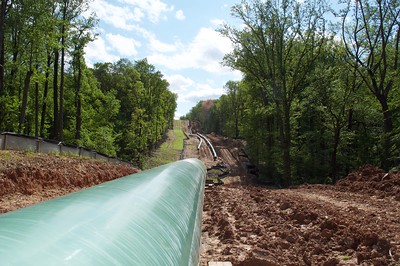
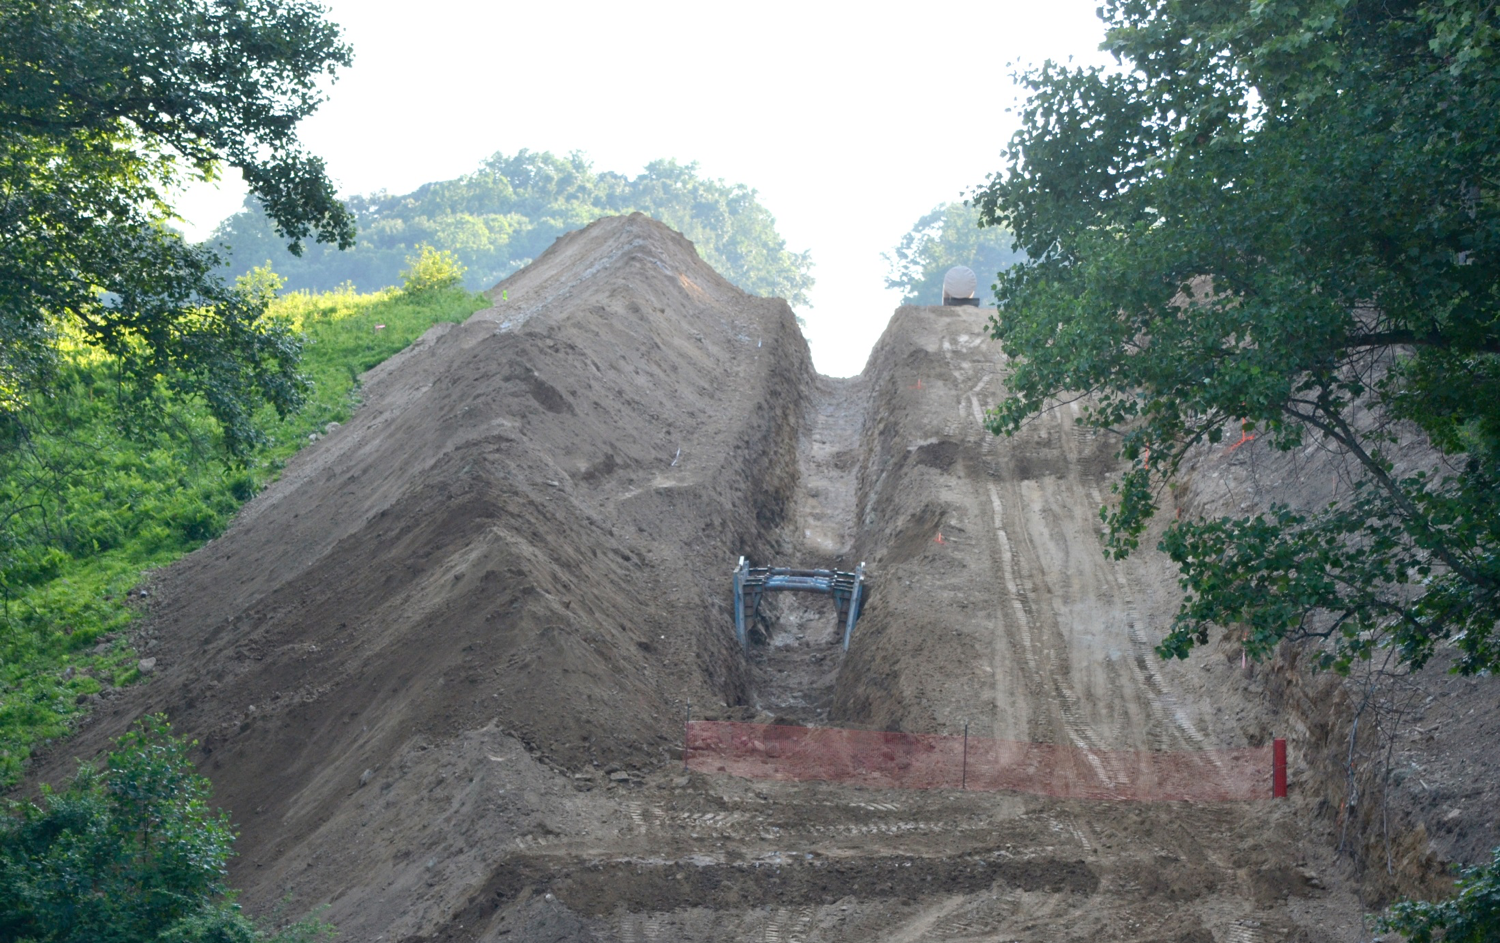
Example of a 42-inch Pipeline Installation in WV
A fight against the pipeline is being waged between the public and Kinder Morgan. Opponents of the pipeline, such as the group “Push Back The Pipeline,” point out contradictions between Kinder Morgan’s rhetoric and the actual situation. For example, although the pipeline will run underground, protected from surface disturbance, should it rupture, the spilled petroleum could still have major impacts on coastal rivers that drain through wetlands, marshes, and into the Atlantic Ocean. Although 80% of landowners approached by Kinder Morgan for rights-of-way agreed to sign leases, it turns out that none of them were given the option not to sign. Kinder Morgan surveyors also trespassed on landowner property in the proposed right-of-way without any permission to be there. Kinder Morgan asserts that the pipeline will reduce reliance on foreign oil, when, in fact, the US is already a net exporter of petroleum products. Kinder Morgan also claims that the need for this oil will only increase, when statistics show that Georgia’s energy demands peaked in 2002, and have fallen 18% between 2005 and 2012 (data from eia.gov). Property owners along the proposed pipeline route are no strangers to spills, either. Kinder Morgan claims that pipelines are the safest method for transporting fuel. As recently as December 2014, however, Kinder Morgan’s Plantation Pipeline in Belton, SC – the location where Palmetto is proposed to start – spilled at least 360,000 gallons of fuel into the ground. Only half of the spilled fuel was recovered.
Opposition to the project is not following party lines. In May of 2015, Georgia’s Republican governor, Nathan Deal, vowed to fight the project in court. Similarly, the Georgia Department of Transportation rejected the proposal, stating that it was not in the public interest, and therefore, seizing the right-of-way by eminent domain was not an acceptable strategy for Kinder Morgan to pursue.
Another formidable opponent of the project is William S. Morris III, a powerful media magnate who owns newspapers in Jacksonville, Savannah, and Augusta and has been providing continual coverage of the controversy. Morris also owns more than 20,000 acres directly along the pipeline route, and could potentially lose an 11- mile corridor of land to eminent domain if the pipeline project is approved.
In late February 2016, a Georgia House subcommittee approved a moratorium on use of eminent domain on petroleum pipelines. Eminent domain would allow Kinder Morgan to take a 50-foot-wide strip of land for the pipeline right-of-way, whether or not the private citizens owning that land were in favor. The bill now moves on to a full committee. Georgia state law also requires that petroleum companies must prove a project meets guidelines of “public necessity” before eminent domain could ever move ahead.
Although Kinder Morgan hopes to see the pipeline built and in service by December 2017, critical components, such as a complete right-of-way, are far from finalized.
See the recent documentary created about the Palmetto Pipeline here:
https://www.fractracker.org/a5ej20sjfwe/wp-content/uploads/2016/03/Palmetto-Pipeline-Feature.jpg400900Karen Edelsteinhttps://www.fractracker.org/a5ej20sjfwe/wp-content/uploads/2025/09/2025-Wordmark-Logo.pngKaren Edelstein2016-03-04 15:47:472020-03-12 17:32:43Proposed Palmetto Pipeline: At what cost?