Tag Archive for: Susquehanna

Water supplies article

Risks to Water Supplies in PA’s Susquehanna Basin

In this series of articles on the Susquehanna River Basin, FracTracker has explored the relationship between oil and gas extraction and the overall health of the watershed relative to oil and gas extraction impacts. We began with a basic overview of likely relationships, followed by an analysis of oil and gas violations relative to resources available for monitoring water quality changes. In the most recent article we assessed the corresponding effects of extraction on deforestation and habitat loss. With the rapid expansion of oil and gas drilling over the past decade, many have also formed legitimate concerns about threats to public and private water supplies. In the final article of the series we look closely at this issue, at the complexities of assessing risks to water supplies, while also highlighting recent research shedding new light on the nature of these risks.

Pennsylvania’s Hydrological System

The Susquehanna River is home to more than 3.3 million people who depend on the river and its tributaries for drinking water. The basin also feeds thousands of businesses that require water for their operations, such as manufacturing facilities, farms, golf courses, and more. In some instances, water supplies are fed by groundwater wells, which are in turn fed by underground aquifers of different depths. In other cases, water supplies are drawn from intake points in nearby lakes, rivers, and streams.

Map of PA's groundwater aquifer system.

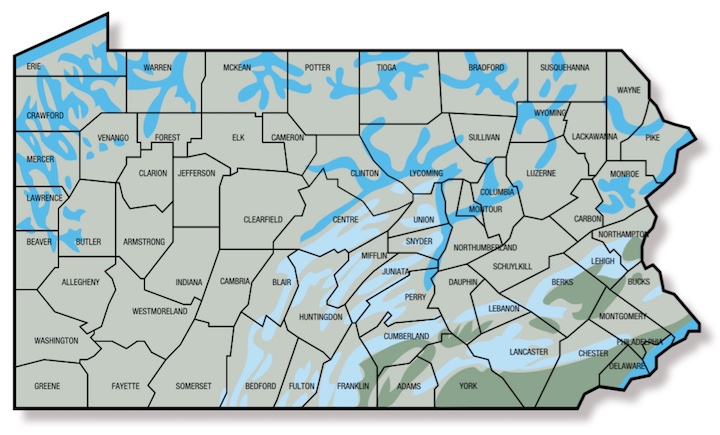
Figure 1: Map of PA’s groundwater aquifer system.

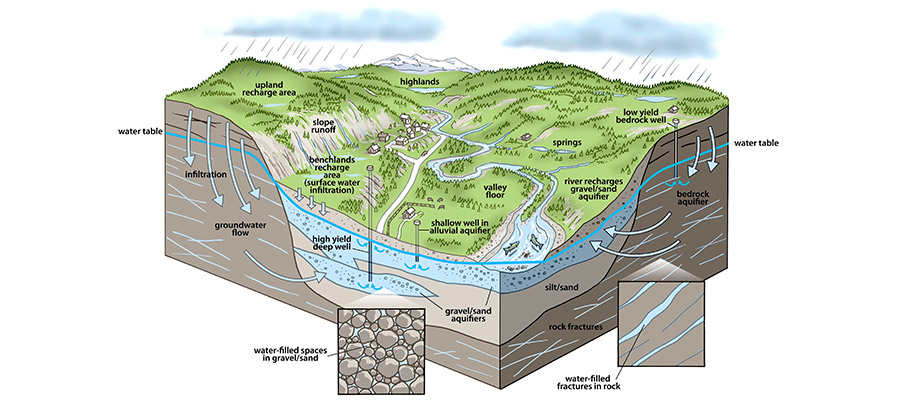
While many believe underground and surface water systems are somehow discrete, this is far from the case. Groundwater is a major contributor to rivers, lakes, and wetlands – as they are all connected through the hydrological cycle. Some precipitation runs directly into streams. But much of it filters through soil and rock into shallow and deep aquifers. Aquifers then carry water over the course of months, years, and even centuries, into larger water bodies. The most common discharge points are from springs and from low-lying wetlands. The figures above (figure 1) and below (figure 2) illustrate Pennsylvania’s four major aquifer types, compiled by Penn State Extension.

Figure 3: Types of groundwater aquifers in PA.

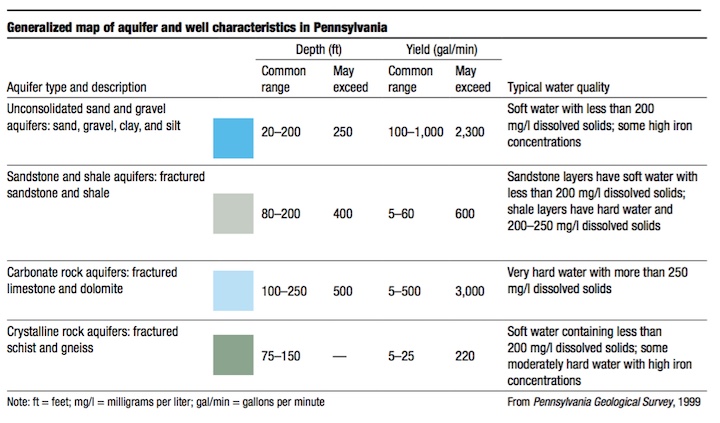
Figure 2: Types of groundwater aquifers in PA.

Assessing Groundwater Supply Risks

Managing the overall health of the hydrological cycle is of critical importance to the 3.3 million people who live in the Susquehanna River Basin. However, oil and gas extraction poses significant risks to the state’s water sources. As we have detailed in prior articles in this series, accidents and spills can cause chemicals and hydraulic fracturing fluids to run off into nearby watersheds. Growing evidence also suggests that groundwater can be contaminated by migrating hydraulic fracturing fluids.

Figure 4: Number of household and public water supply groundwater wells by state (DCNR).

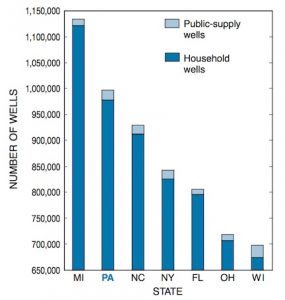
Figure 3: Number of household and public water supply groundwater wells by state (DCNR).

In one study, conducted by Columbia University in 2016, researchers found elevated levels of dissolved calcium, chlorine, sulfates and iron in lowland drinking wells within one kilometer of a drilling site compared to baseline averages. In lowland wells more than a kilometer away, they found elevated levels of methane, sodium, and manganese. Elevated levels dropped off in wells on higher ground, which suggests the hydraulic fracturing process affects shallow and deep groundwater sources along different timelines.

According to the PA Department of Conservation and Natural Resources (DCNR), Pennsylvania ranks second in the nation for total number of groundwater wells, second for number of private drinking wells, and third for number of public water supplies dependent on groundwater wells (figure 4). However, determining how many groundwater wells may be at risk to oil and gas extraction is complicated for a variety of reasons. First, DCNR acknowledges that only about half (480,000) of the 1 million groundwater wells in the state are documented. Registration of groundwater wells only began in 1955, and detailed information including latitude and longitudinal coordinates only came into being in the 1980s. These records are now maintained in the PA Groundwater Inventory System (PAGWIS). It is worth noting that the PA Department of Environmental Protection (DEP) does not regulate private drinking water wells. They are only required to respond to pollution complaints.

Correlating O&G Wells to Complaints Data

Despite these data gaps, we can still learn a lot from the wells that are documented in PAGWIS. For instance, we compared the location of groundwater wells to oil and gas related complaints and found some interesting correlations. The below map can be used to explore these relationships.

Map of at-risk groundwater wells, public water supplies, and citizen complaints


View Map Fullscreen | How FracTracker Maps Work

The first stage our analysis involved narrowing the PGWIS registered groundwater wells in the Susquehanna Basin to those that are actively used for drinking water, agriculture, and irrigation (66,306 total). We then limited to those within 1 kilometer of an oil and gas well, essentially mirroring the distances used by the Columbia University study. We found 2,551 groundwater wells within this “risk zone” of 1 kilometer.

For our second stage, we utilized research conducted by Public Herald, an investigative reporting team that spent three years reviewing oil and gas related complaints submitted to the DEP from 2004-2016. They found 9,442 total complaints, of which 43% were water related (surface and groundwater), and that the frequency of complaints track with the rise and fall of unconventional oil and gas development (figure 5).

Figure 5: Relationship of complaints to O&G development (Public Herald).

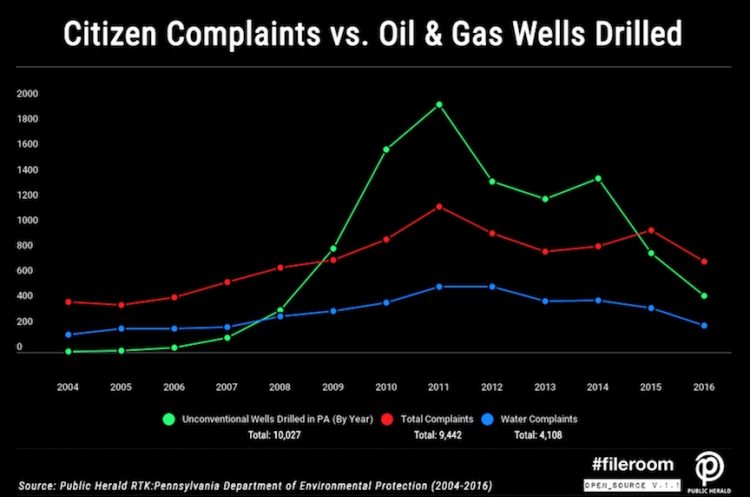
Figure 4: Relationship of complaints to O&G development (Public Herald).

From the Public Herald dataset, we found 1,573 total complaints were in the Susquehanna River Basin, of which 65% were water related complaints — a much higher percentage than the larger dataset’s average. We then compare the location of these complaints to our “risk zone” groundwater wells and found a statistically significant correlation between the number of groundwater wells within 1km of oil and gas activity and higher numbers of complaints by residents. What do these findings tell us?

In short, where we see more groundwater wells in proximity to an oil and gas well, we also see more water related complaints to the DEP.

The below graph illustrates this relationship (figure 6).

Figure 6: Relationship of complaints to at-risk groundwater wells.

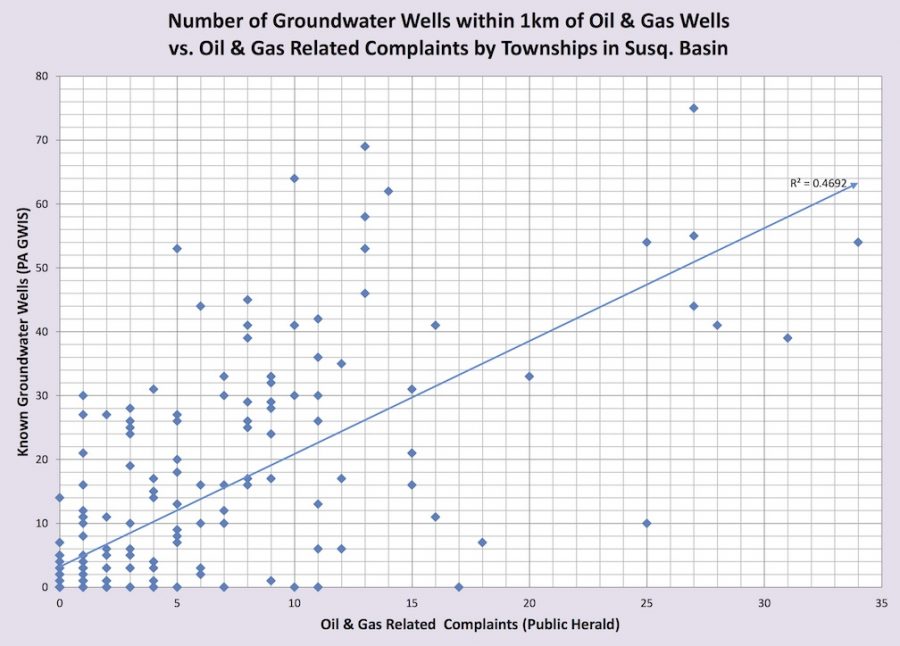
Figure 5: Relationship of complaints to at-risk groundwater wells.

Groundwater to Surface Water Risks

DCNR estimates that Pennsylvania’s streams and wetlands get about 2/3 of their flow from groundwater sources. Meanwhile, there are 786 public water suppliers in the Susquehanna River Basin that are fed by different arrangements of groundwater and surface water sources. These suppliers are included in the interactive map for reference.

Assessing risks to public water supply systems is equally complicated to that of groundwater wells. The DEP regulates public water suppliers under the Safe Drinking Water Act, but the general public is not permitted to know the location of actual water sources or intake points due to security risks. This restriction poses a problem for nongovernmental organizations when doing analyses that would benefit from knowing the locations of these source points. Nevertheless, like our breakdown of risk zone groundwater wells, we can still learn a great deal from what we do know of public water supplies.

Figure 6: Wellsboro, PA, public water supply along with O&G wells and water-related citizen complaints in the supply watershed.

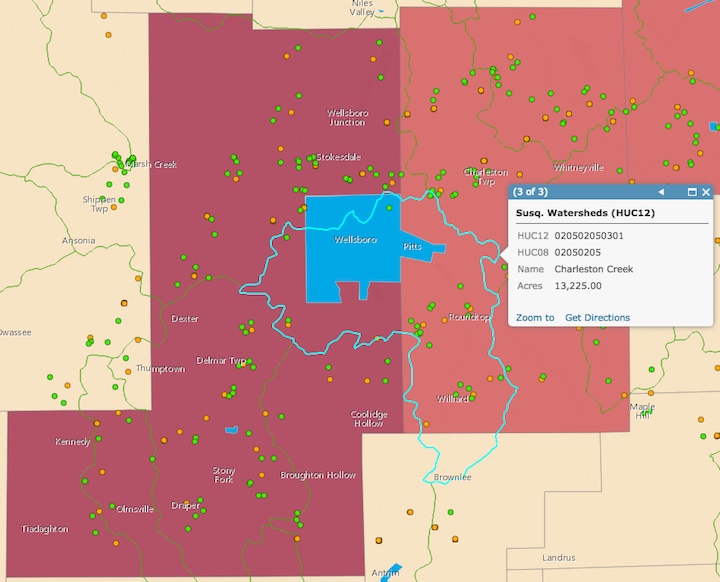
Figure 6: Wellsboro, PA, public water supply with O&G wells and citizen complaints in the supply’s watershed.

For instance, the town of Wellsboro, in Tioga County, is home to an estimated 3,300 people. The Wellsboro Municipal Authority supplies water to Wellsboro residents as well as to 1,000 people in surrounding Charleston and Delmar Townships. According to DEP records, groundwater and surface water sources for this system come from Hamilton Lake and tributaries of the Charleston Creek Watershed, much of which is designated as high-quality coldwater fisheries. Nevertheless, there are seven unconventional oil and gas wells in this watershed, one of which is only 400ft from Charleston Creek, just upstream from Hamilton Lake.

The area is also one of the brightest hot-spots for complaints to the DEP in the Public Herald dataset, with 40 water related complaints in Charleston and Delmar townships.

These relationships should be of particular concern to residents who believe their water is protected from extraction industry activities. In addition, while recent research suggests homes values can be negatively affected in neighborhoods dependent on private well water near drilling activity, correlations between potential groundwater and surface water pollution suggest that any changes in home value are more a matter of perceived rather than actual risk—homes on public water supplies should also be considered at risk in communities experiencing extraction.

Conclusion

Returning to the hydrological cycle, we can assume that pollutants from oil and gas extraction, like precipitation, will eventually find their way into larger water bodies, either directly through runoff into watershed tributaries or through groundwater migrations. While this article has primarily focused on the Pennsylvania headwaters of the Susquehanna, home to 570,000 residents, and risks to their water sources, groundwater complaints are not the exclusive problem of residents who are dependent on private drinking water wells. “We all live downstream” as the saying goes, and those who rely on the watershed for their drinking water and other water resource needs throughout the watershed should be concerned by the correlations illustrated in our analysis.


By Kirk Jalbert, Manager of Community based Research & Engagement, FracTracker Alliance

Feature image: Hydrologic cycle graphic by Watershed-Watch.org

Susquehanna River Basin map article #2

Violations and Monitoring in Pennsylvania’s Susquehanna River Basin

The Susquehanna River is a 444-mile long waterway extending from the area around Cooperstown, New York to the Chesapeake Bay. In Pennsylvania, the basin includes more than 37,000 miles of streams that feed into the river, which capture the precipitation of more than 20,000 square miles of land, and is home to over 3.3 million people.

The region has been heavily impacted by oil and natural gas extraction in recent years; more than 5,500 unconventional wells and roughly 13,500 conventional wells have been drilled in the PA segment of the basin since 2000. Unconventional wells, in particular, have brought industrial-scaled activity, pollution, and waste products to a wide area of the basin, with especially heavy development occurring in three counties along Pennsylvania’s northern tier – Bradford, Susquehanna, and Tioga.

Several governmental agencies are involved with monitoring impacts to this massive watershed. This article focuses on the Pennsylvania portion of the basin, and examines how capable agency-run monitoring efforts are in capturing oil and gas (O&G) related pollution events. The Pennsylvania Department of Environmental Protection (DEP), the US Geological Survey (USGS), and the Susquehanna River Basin Commission (SRBC) maintain a combined network of 274 monthly “grab sample” monitoring sites and 58 continuous data loggers in the Pennsylvania portion of the river basin. Meanwhile, between January 1, 2000 and February 7, 2017, the DEP logged 6,522 on the O&G violations compliance report within the same region. More than three out of every four of these violations have been assessed to unconventional wells, even though only one out of every four active wells in the basin is categorized as such.

Map of O&G Monitoring & Violations in PA’s Susquehanna River Basin


View Map Fullscreen | How FracTracker Maps Work

Limitations of Monitoring Efforts

Grab samples obtained from official monitoring locations are the preferred method for regulatory purposes in understanding the long-term health of the river system. Researchers can test for any number of analytes from samples that are collected in-stream, but analyzed in certified laboratories. However, samples from these locations are collected periodically – usually once per month – and therefore are very likely to miss the effects of a significant spill or issue that may impact surface water chemistry for a number of hours or days before being diluted and washing downstream.

Continuous data loggers give regulators a near real-time assessment of what is happening in selected points in the basin, usually at 15-minute intervals. While there are numerous events that contribute to fluctuations in these measurements, these data loggers would be the most likely instruments available to register an event impacting the surface water within the basin. However, there are unique issues with data loggers. For instance, available data from these data loggers are much more limited in scope, as temperature, pH, and conductivity are typically the only available analytes. In addition, because the analysis occurs on site, the results carry less weight than laboratory results would. Finally, even though data loggers collect data at rapid intervals, only some are equipped to send data real-time to agency offices. Some data loggers must be manually collected on a periodic basis by program managers.

Perhaps the greatest challenge for monitoring in the Susquehanna River Basin is that it is simply not practical to monitor in all places likely to be impacted by oil and gas operations. Testing within the jurisdiction of the Susquehanna River Basin is actually fairly extensive when compared to other regions, such as the Ohio River Basin. The Ohio River Valley Water Sanitation Commission – the equivalent of the SRBC for the Ohio River Basin – only monitors basic analytes like total dissolved solids at 29 locations, all at or near the main stem of the river. However, none of the agencies monitoring water quality in the Susquehanna River Basin have capacity to test everywhere. On average, there is one testing location for every 111 miles of rivers and streams within the basin.

Case Studies

If agency-based monitoring is so limited, then the important question is: How well do these efforts capture oil and gas-related impacts? Some violations are more likely to impact surface water quality than others. This article takes a closer look at some of the bigger problem areas within the basin, including the Dimock region in Susquehanna County, Leroy Township in Bradford County, and Bell Township in Clearfield County.

Dimock

Map of O&G violations and water monitoring near Dimock, PA

O&G violations and water monitoring near Dimock, PA. Note that multiple violations can occur at the same location. Click to expand map.

The highest concentration of oil and gas violations in the Susquehanna Basin is located in the townships of Dimock and Springville, in Susquehanna County, PA, with a total of 591 incidents reported on the compliance report. This makes the region the highest concentration of O&G violations in the entire state. Many of these violations are related to the systemic failure of well integrity, resulting in the contamination of numerous groundwater supplies. In terms of how these might affect surface water, 443 of the violations are in areas that drain into the Thomas Creek-Meshoppen Creek subwatershed by the southern edge of Springville Township, while most of the rest of the violations drain into the parallel West Branch of Meshoppen Creek.

The USGS operates a monthly monitoring location in the middle of the cluster of violations, at the confluence of Burdick and Meshoppen creeks, just north of the Dimock’s southern border. While this location might seem ideal at first, only 180 of the 443 violations in the subwatershed are upstream of the grab sample site. There is another water monitoring location that captures all of these violations in the Meshoppen subwatershed, but it is more than 15 miles downstream. (link to EJ article about Dimock)

Leroy Township

Map of O&G Violations and monitoring near Leroy Township, PA

O&G Violations and monitoring near Leroy Township, PA. Click to expand map.

Compared to the huge amount of oil and gas violations throughout the Dimock area, Leroy Township in Bradford County looks relatively quiet. It also appears to be well covered by monitoring locations, including a data logger site near the western edge of the township, a centrally located monthly monitoring location, as well as another monthly grab sample site upstream on Towanda Creek, just beyond the eastern boundary in Franklin Township.

And yet, this area was hit hard in the early part of the decade by two significant spills. On April 19, 2011, Chesapeake Appalachia lost control of the Atlas 2H well, with thousands of gallons of flowback fluid spilling onto the countryside and into the nearby Towanda Creek.

A little over a year later on July 4, 2012, a second major spill in the township saw 4,700 gallons of hydrochloric acid hit the ground. According to the DEP compliance report, this did not make it into the waterways, despite the gas well being located only about 550 feet from Towanda Creek, and less than 300 feet from another unnamed tributary.

Both incidents were within a reasonable distance of downstream monitoring locations. However, as these are grab sample sites that collect data once per month, they can only offer a limited insight into how Towanda Creek and its tributaries were impacted by these notable O&G related spills.

Bell Township

Map of O&G violations and monitoring near Bell Township, PA. Susquehanna River Basin project

O&G violations and monitoring near Bell Township, PA. Click to expand map.

Bell Township is a small community in Clearfield County along the banks of the West Branch Susquehanna River. The northwestern portion of the township ultimately drains to the Ohio River, but all of the violations in Bell Township are within the Susquehanna River Basin.

Two significant incidents occurred in the township in 2016. On February 18, 2016, Alliance Petroleum Corp lost control of the McGee 11 OG Well, located less than 250 feet from Deer Run. According to the oil and gas compliance report, control of the well was regained five days later, after releasing unspecified quantities of gas, produced fluid, and crude oil. On December 5th of the same year, Exco Resources was cited for allowing 30 barrels (1,260 gallons) of produced fluid to spill at the Clyde Muth M-631 Wellpad in Bell Township.

A United States Geological Survey monthly monitoring location along the West Branch Susquehanna in nearby Greenwood Township is upstream, and could capture the effects of spills throughout much of Bell Township. However, the incident at the Clyde Muth well pad occurred in the Curry Run subwatershed, which meets up with the West Branch Susquehanna downstream of the monitoring location, so any pollution events in that area will not be reflected by monitoring efforts.

Conclusions

In the case of Dimock and Springville townships, we see how official water monitoring efforts capture only a fraction of the notorious cluster of wells that have resulted in hundreds of violations over the past decade. There could scarcely be a better candidate for systematic observation, and yet only a single grab sample site covers the immediate vicinity. Leroy Township does not have the same quantity of impacts as Dimock, but it did see one the worst blowouts in the recent history of O&G operations in Pennsylvania. The area is relatively well covered by grab samples sites, but due to the monthly sampling schedule, these locations would still be unlikely to capture significant changes in water quality. In Bell Township, much of the area is upstream of a monthly grab sample site, but the nearest downstream monitoring location to a major spill of produced fluid that occurred here is more than 17 miles away from the incident as the crow flies.

It should be noted that there are a number of industries and activities that contribute to water pollution in Pennsylvania, and as a result, the monitoring efforts are not specifically designed to capture oil and gas impacts. However, the compliance record shows heavy impacts from oil and gas wells in the basin, particularly from modern unconventional wells.

While the network of government-operated manual monitoring locations and data logger sites are fairly extensive in Susquehanna River Basin, these efforts are not sufficient to capture the full extent of oil and gas impacts in the region. Finding evidence of a small to medium sized spill at a site with monthly testing is unlikely, as contaminated water doesn’t stay in place in a dynamic river system. Data loggers also have a limited capacity, but are a useful tool for identifying substantial changes in water chemistry, and could therefore be employed to identify the presence of substantial spills. As such, it might be beneficial for additional data loggers to be distributed throughout the basin, particularly in areas that are heavily affected by the oil and gas industry. Furthermore, given resource gaps and staff cuts within agencies tasked with protecting the river basin, agencies should strongly consider utilizing networks of volunteers to augment their limited monitoring networks.

Project Info

Read more about the Susquehanna River Basin Impacts Project

By Matt Kelso, Manager of Data and Technology, FracTracker Alliance